What governs the fluidic behavior of water near single DNA molecules at the micro/nano scale 111Supported by the National Natural Science Foundation of China under Grant No. 10474109, Foundation of Ministry of Personnel of China and Shanghai Supercomputer Center of China
Abstract
The fluidic behavior of water at the micro/nano scale is studied by using of single DNA molecules as a model system. Stable curved DNA patterns with spans about one micron were generated by using of water flows, and observed by Atomic Force Microscopy. By rigorously comparing the numerical simulation results with these patterns, it is suggested that the form of the macroscopic hydrodynamic equation still works quantitatively well on the fluid flows at the nanoscale. The molecular effects, however, are still apparent that the effective viscosity of the adjacent water is considerably larger than its bulk value. Our observation is also helpful to understand of the dynamics of biomolecules in solutions from nanoscale to microscale.
pacs:
68.08.-p, 47.85.Np, 87.15.NnNovel micro-fluidics has provided new possibilities for the development of fabricating high-performance devices with micrometer or even submicrometer dimensions Volkmuth92 ; Ho01 ; Hu02 , as well as bio-processing for bio-medical analysis Thorstenson98 . The ability to control accurately the flow requires the understanding of fluid flows at the micro/nano scale near macromolecules or above solid surfaces. Recent experiments have shown that macroscopic hydrodynamics can reliably describe the flow of fluids through channels with cross-sectional dimensions that range from tens to hundreds of micrometers Truskett03 . The nanometer scale, however, is in the transition regime between continuum and molecule dominated conditions Ho01 ; Laughlin00 , about which we know very little Laughlin00 . Molecular dynamics has been used to study the nanofluid Koplik88 and consistence between the numerical results from molecular dynamics and Navier-Stokes equations has been obtained recently Nie03 . However, both high and normal ‘effective’ viscosities, its departure from the bulk value usually characterizing the molecular effects, and boundary slip have been observed in the confined water when the sample thickness is comparable to or below the diameter of DNA molecules Zhu01 , indicating that the dynamics of nanofluid should be much complex. Moreover, it has been found experimentally that the water flow through orifices with diameter about 8 m is considerably different from that of ordinary size Hasegawa97 . At a hydrophobic surface, in an unexpectedly extended ( 4 ) water layer, the density of water has a noticeable reduction (85-90 of the density of bulk water) Schwendel03 . Consequently, the fluidity of water several to tens of nanometers above non-liquid materials should be different from that of the macroscopic systems despite the fact that the water molecules are much smaller.
The difficulty in the experimental studies is partially due to the limited experimental technologies to obtain data that can be compared by theoretical predictions quantitatively. Although molecules with fluorescent labels have been widely used Smith99 to make the biomolecules visible, the resolution is limited by the minimal photon wavelength, which is about half a micron. Atomic Force Microscopy (AFM) and Electronic Microscopy (EM) have the nanometer resolution. However, they require the objects to be fixed on solid substrates. It is obviously questionable that the quantitative details on the dynamics can be exploited from motionless objects unless they are in steady-states, which are difficult to be confirmed.
The study of biological systems will continue to inspire the development of new physics Frauenfelder99 and the dynamics of DNA in fluid flow has been extensively studied by various methods Smith99 ; Meiners00 . Thanks to the elastic behavior of DNA fibers that they reach maximal lengthes with a tension larger than 65 pN Cluzel96 and are not broken until 400 pN Bensimon95 , those overstretched DNA fibers can reach steady states in the fluid flows and be fixed on substrates. In this Letter a simple experiment was then set up to obtain steady curved DNA patterns for span lengths about or less than 1 m, generated by water flow. By rigorously comparing the observed DNA patterns with theoretical predictions, it is suggested that macroscopic hydrodynamic equations still works quantitatively well on the fluid flow at the nanoscale at least at steady states. To our best knowledge, this is the first report on the applicability of the Navier-Stokes equations on the fluidic behavior of water near single DNA molecules at the nanoscale by testing the numerical predictions with the experimental observation.
The DNA, purchased from Sigma Co. (USA), was diluted before use to a concentration of 3 ng/l with TE buffer (40 mMol/L Tris-HCl, 1 mMol/L EDTA, pH 8.0). The experiment began by depositing a drop of 10 l DNA solution onto a mica sheet modified by APTES Lu04 that was placed on a rotary device. The distance between the drops of DNA solution and the axis of the rotary device was always about 10 mm. The spin speed of rotation is kept to be 1150 rpm. After rotation, the drop would be thrown off and some DNA molecules were aligned on the surface. To demonstrate that DNA molecules were aligned by water flow rather than the liquid-gas interface, some DNA fibers were observed by Tapping-Mode AFM (Nanoscope IIIa, Veeco Instruments, Santa Barbara, CA) using silicon tips (Silicon-MDT Ltd., Russia) Hu02 . It is found that the relative extensions of those aligned DNA molecules are within while those are about to in the molecular combing by the receding meniscus Bensimon94 ; Bensimon95 . Then another drop of water was placed on the same area of the surface on which there are aligned DNA molecules while the orientation of the mica sheet on the rotary device was changed about 90o. A subsequent rotation created a second flow on the mica surface, approximately perpendicular to the first one. The velocity of the drop was estimated to be about 1 cm/s, with an upper limit of 3 cm/s. The as-generated DNA patterns were revealed by Tapping-mode AFM Hu02 .
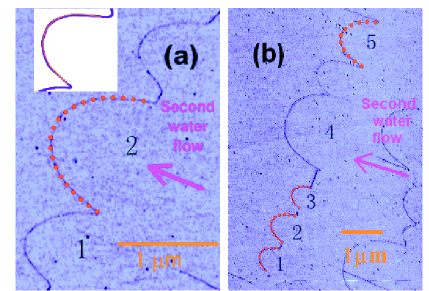
We have systematically observed over 100 curves with span length , 50 nm 2 m after the second water flow, as typically shown in Fig. 1. Some of the DNA segments still have their original aligned patterns, while other segments bend in the direction of the second water flow. Among them, 7 symmetric curves are constituted of those overstretched DNA fibers, which reach their maximal lengthes, with span length ranging from 580 nm to 1260 nm. The fact that the ratio of the contour and the span is about 1.75 for those overstretched patterns further verifies that DNA molecules are aligned and curved by water flows rather than the interface. The relative extension is calculated from the contour and the span length of a curve. In the following we will demonstrate that these symmetric and steady DNA curves are a result of the balance of the macroscopic hydrodynamic forces with an adjusted viscosity, as illustrated by the 5 typical examples shown in Fig. 1, i.e., curve 2 in (a) and curves 1, 2, 3, 5 in (b). The other patterns, including the asymmetric curve 1 in Fig. 1(a) and the double-peaked curve 4 in Fig. 1(b), have been initially analyzed in Li03 and will be discussed in details elsewhere.
The numerical analysis is based on the bead-spring model Larson99 . To test whether the macroscopic hydrodynamic equations still works quantitatively well, the forces acting on the beads are computed by simulating water flow according to the Navier-Stokes equations. Explicitly, the lattice Boltzmann simulation Chen91 is applied to simulate the water flow around the spherical beads. A non-slip boundary condition Filippova97 is applied at the bead-fluid boundaries. The momentum exchange Ladd94 ; Li04 at the solid-fluid interface is used to determine the force acting on the DNA beads. In the lattice Boltzmann simulations, the non-dimensional radius of each bead is 5.2 lattice units and the relaxation time . The density and kinetic viscosity of the water are 998.3 and 1.007 Douglas , respectively.
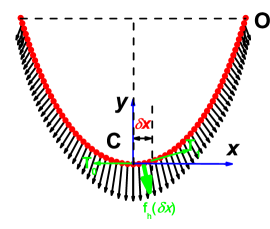
Let us take the curve marked by 2 in Fig. 1(a) as an example. The settings of our numerical simulations are shown in Fig. 2. Some beads, say sixty-nine, were placed on the DNA pattern scaled down from the curve. The radius of each bead is 1 nm, approximately equal to that of the DNA strands, while the center-to-center distance between the nearest-neighbor beads is always 2.308 nm. Periodic boundary conditions are applied for the and directions. The mesh sizes are: is a little larger than the span length of the DNA pattern, the inlet and outlet in direction is always 30.5 nm from the closest bead, see, e.g., nm and nm for =90.9 nm; =41.1 nm. It is found that is large enough so that the effect of the periodic boundary condition in the direction is negligible. The fluid velocity at the inlet and outlet is assumed to be 1 cm/s and along the - direction at all time.
The force distribution acting on beads is shown in Fig. 2. Since the actual DNA fiber is continuous rather than discrete, we therefore used the best continuum curve fitting from the calculated discrete force to approximate the realistic hydrodynamic force distribution along the DNA fiber.
It is evident that if a DNA fiber is in a steady state of the hydrodynamic force, the total force, i.e., the sum of the hydrodynamic force and the tensions, acting on any segment of the DNA fiber should vanish. Unfortunately, the tension is unknown and it is difficult to measure the velocity of water flow acting on the DNA molecules to an acceptable accuracy so that we cannot examine the equilibrium condition explicitly. However, if we assume that the coordinates of the two ends of the DNA at locations and (see Fig. 2) are given, then the hydrodynamic force distribution obtained above will uniquely determine a curve . Further, can be used to compare with the experimental result. If these two curves coincide with each other, the DNA pattern obtained by the experiment is indeed in the steady state of the hydrodynamic force. Otherwise the discrepancy reflects the special behavior at the nanoscale.
To construct the curve , we start our steady force balance calculation from the critical point as shown in Figure 2. Assuming that there is a small displacement in the -direction, then there are three forces acting on the DNA segment between () and : the tension TC at along the -direction, the tension T1 at the other end of the segment and the hydrodynamic force f on this segment. nm was used in our calculations. For the equilibrium state, the force balance for the DNA segment gives:
| (1) |
If we assume that the magnitude of is , both the magnitude and direction of the tension T1 can be obtained through Eq. 1. Consequently we can obtain the coordinate of the DNA segment at . Next, we consider the position of the curve at . The tangential direction at this point can be obtained similarly to find the increment of value from to . This extrapolation process can be repeated until is reached. Then an iterative process is used to self-consistently determine to meet the value required at . In this way, we obtain the curve . It should be noted that the force to bend the DNA molecules to the curves shown in Fig. 1, except for the parts near the anchored points, is about 0.1 pN, negligibly smaller than the tension in the DNA curves.
is displayed as red circles in Fig. 1(a). To our great surprise it is found that from our theoretical prediction agrees extremely well with the curve from the experiment. Numerical simulations for and beads, corresponding to span lengths , 63.6, and 116.6 nm, respectively, have also been carried out. It is found that the normalized patterns from numerical predictions with different length scales can be normalized to a high accuracy. In the same way, we obtain the theoretical predictions for the curves 1, 2, 3, 5 in Fig. 1(b). In order to obtain a quantitative comparison between the numerical predictions and the experimental results, the global relative error is computed from those 5 curves, which is 5 1 .
The tension at the critical point from our calculations for different is shown in Fig. 3, which fits very well to a linear function when the inlet fluid velocity equals 1 cm/s. Following this linear scaling, we found that 9.0 and 19.7 pN for and 1260 nm, respectively.
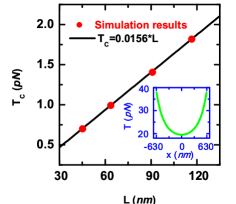
The tensions are larger than 65 pN Cluzel96 in the overstretched DNA fibers with relative extension about 1.75. However, calculated for nm is only 9.0 pN. Even for the upper limit of the velocity, 3 cm/s, of the water drop, pN is still smaller than 65 pN. We also note that the viscosity of water is the same as its bulk value in the calculation. If we assume that the local effective viscosity near the DNA fiber is more than 3 times of its bulk value, the calculated tension in all the 7 steady and symmetric curved DNA patterns will be larger than pN. Enhanced by a factor of 6 for the effective viscosity of water near proteins has been also observed recently Halle03 . In the inset of Fig. 3, we have included the tension distribution along the DNA fiber for of 1260 nm.
The numerical analysis in the manuscript has neglected the fact that DNA fibers are close to the mica surface. It has shown that polymer molecules can move on the surface with a low barrier although the absorption on molecules by the surface is strong Gennes87 . Therefore, we believe the interaction between the extended DNA strands and the substrate will not change the conclusion we obtain above. In this case the flow around the DNA fibers may be a shear flow. We have performed new numerical simulations. The distance from the plane, where the DNA curve located, to a non-slip boundary is . The velocity of the flow at the inlet increases linearly from the boundary whereas the velocity in the line with the plane is 1 cm/s. The other settings are the same as before. It is found that the normalized patterns obtained in this way for nm and nm are consistent with those obtained above perfectly, while the tensions increase by a factor of 1.2 and 2.6 separately. The fluid velocity near wall is usually much smaller than that of the drop of water, therefore higher effective viscosity is also demanded.
The accuracy of the fitting of the theoretical predictions to the experimental patterns is at the level of AFM resolution, about 10-20 nm. This observation suggests that the force exerted by the adjacent water on the DNA fiber can be determined quantitatively by the macroscopic hydrodynamic equations at least in the steady state even at a resolution of about 20 nm. The viscosity of the adjacent water, however, is much larger than its bulk value. It should be noted that the excellent agreement between our numerical predictions and the experimental results further demonstrate the robustness of the numerical model although the detail of the experiment should be much complex.
We thank Dr. Gary D. Doolen, Profs. D. Bensimon, V. Croquette and Z. Ye for helpful discussion and suggestions, Miss Chunmei Wang for extracting DNA data from AFM images.
References
- (1) Volkmuth WD, Austin RH. DNA electrophoresis in microlithographic arrays. Nature, 1992, 358(13): 600602; Gau H, Herminghaus S, Lenz P, and Lipowsky R. Liquid Morphologies on Structured Surfaces: From Microchannels to Microchips. Science, 1999, 283: 4649; Nilsson KPR and Inganas O. Chip and solution detection of DNA hybridization using a luminescent zwitterionic polythophene derivative. Nature Mater., 2003 2 419; Mirkin C A. Programming the assembly of two- and three-dimensional architectures with DNA and nanoscale inorganic building blocks. Inorg. Chem., 2000, 39: 22582262; Seeman NC. DNA in a material world. Nature, 2003, 421: 427431
- (2) Ho CM. Fluidics-the link between micro and nano sciences and technologies. 2001 Technical digest of the 14th IEEE international MEMS conference (ISBN-0-7803-6251-9) p 375384
- (3) Hu J et al. Artificial DNA patterns by mechanical nanomanipulation. Nano Lett., 2002, 2(1): 5557
- (4) Thorstenson YR et al. An automated hydrodynamic process for controlled, unbiased, DNA shearing. Genome Res., 1998, 8: 848852; Lengsfeld CS, Anchordoquy TJ. Shear-induced degradation of plasmid DNA. J. Pharm. Sci., 2002, 91 15811588
- (5) Truskett TM. The subtleties of water in small spaces. Proc. Natl. Acad. Sci. USA, 2003, 100: 10139; Sharp KV, Adrian RJ, Santiago JG, and Molho JI. Handbook of MEMS ed Gad-el-Hak M (CRC, Boca Raton, FL), 2001, p 6.1; Whitesides GM, , Stroock AD Phys. Today, 2001, 54 42
- (6) Laughlin RB, Pines D, Schmalian J, Stojkovic BP, and Wolynes P. The middle way. Proc. Natl. Acad. Sci., 2000, 97: 3237
- (7) Koplik J, Banaver JR, and Willemsen JF. Molecular dynamics of Poiseuille flow and moving contact lines. Phys. Rev. Lett., 1988, 60: 12821285
- (8) Nie XB, Chen SY, E WN, and Robbins MO. A continuum and molecular dynamics hybrid method for micro- and nano-fluid flow. J. Fluid. Mech., 2003, 500: 5564
- (9) Zhu Y, and Granick S. Viscosity of interfacial water. Phys. Rev. Lett., 2001, 87: 096105; Gee ML, McGuiggan PM and Israelachvili JN. Liquid to solidlike transitions of molecularly thin films under shear. J. Chem. Phys., 1990, 93: 1895; Raviv U, Laurat P and Klein J. Fluidity of water confined to subnanometre films. Nature, 2001, 413 5154; Cottin-Bizonne C, Cross B, Steinberger A and Charlaix E. Boundary slip on smooth hydrophobic surfaces: Intrinsic effects and possible artifacts. Phys. Rev. Lett. 94(5): 056102
- (10) Hasegawa T, Suganuma M, and Watanabe H. Anomaly of excess pressure drops of the flow through very small orifices. Phys. Fluids, 1997 9: 13
- (11) Schwendel D. et al. Interaction of water with self-assembly monolayers: Neutron reflectivity measurements of water density in the interface region. Langmuir, 2003, 19(6): 22842293
- (12) Smith DE, Babcock HP and Chu S. Single-polymer dynamics in steady shear flow. Science, 1999, 283: 17241727; Schroeder CM, Babcock HP, Shaqfeh ESG and Chu S. Observation of Polymer conformation hysteresis in extensional flow. Science, 2003, 301: 15151519; LeDuc P, Haber C, Bao G, and Wirtz D. Dynamics of individual flexible polymers in a shear flow.Nature, 1999, 399: 564566
- (13) Frauenfelder H, Wolynes PG, and Austin RH. Biological Physics. Rev. Mod. Phys., 1999, 71(2): S419S430
- (14) Meiners JC and Quake SR. Femtonewton Force Spectroscopy of Single Extended DNA Molecules. Phys. Rev. Lett., 2000, 84: 50145017
- (15) Cluzel P et al. DNA: An extensible molecule. Science, 1996, 271: 792794; Smith SB, Cui YJ, and Bustamante C. Overstretching B-DNA: The elastic response of individual double-stranded and single-stranded DNA molecules. Science, 1996, 271: 795799
- (16) Bensimon D, Simon A J, Croquette V, and Bensimon A. Stretching DNA with a receding meniscus: Experiments and models. Phys. Rev. Lett., 1995, 74: 47544757; Grandbois M, Beyer M, Rief M, Clausen-Schaumann H, and Gaub HE. How strong is a covalent bonds? Science, 1999, 283: 17271730
- (17) Lu JH et al.. Positioning Isolation and Biochemical Analysis of Single DNA Molecules Based on Nanomanipulation and Single-Molecule PCR. J. Am. Chem. Soc., 2004, 126(36): 1113611137
- (18) Bensimon A, Croquette V, Heslot F, and Bensimon D. Alignment and sensitive detection of DNA by a moving interface. Science, 1994, 265: 2096
- (19) Li D et al. Understanding the symmetric and asymmetric DNA patterns by water flow on a solid surface. Commun. Theor. Phys., 2003, 39: 125
- (20) Larson RG, Hu H, Smith DE, and Chu S. Brownian dynamics simulations of a DNA molecule in an extensional flow field. J. Rheol., 1999, 43: 267; Jendrejack RM, de Pablo JJ and Graham MD. Stochastic simulations of DNA in flow: Dynamics and the effects of hydrodynamic interactions. J. Chem. Phys., 2002 116(17): 77527759
- (21) Chen SY et al.. Lattice Boltzmann model for simulation of magnetohydrodynamics. Phys. Rev. Lett., 1991, 67: 3776; Qian YH, d’Humiéres D, and Lallemand P. Lattice BGK models for Navier-Stokes equation. Europhys. Lett., 1992, 17: 479; Chen HD et al. Extended Boltzmann kinetic equation for turbulent flows. Science, 2003, 301: 633636
- (22) Filippova O, and Hanel D. Lattice-Boltzmann simulation of gas-particle flow in filters. Comput. Fluids., 1997, 26: 697
- (23) Ladd AJC. Numerical simulations for particulate suspensions via a discretized Boltzmann equations: theoretical foundation. J. Fluid Mech., 1994, 271: 285
- (24) Li HB, Lu XY, Fang HP, and Qian YH. Phys. Rev. E., 2004, 70: 026701
- (25) Douglas JF, Gasiorek JM and Swaffield JA. Fluid Mechanics (Third edition, Longman, Singapore), 1995
- (26) Halle B, and Davidovic M. Biomolecular hydration: From water dynamics to hydrodynamics. Proc. Natl. Acad. Sci. USA, 2003, 100: 1213512140
- (27) de Gennes PG. Polymers at an interface: a simplified view Adv. Colloid Interface Sci., 1987, 27: 189