Market Polarization in Presence of Individual Choice Volatility
Financial markets are subject to long periods of polarized behavior, such as bull-market or bear-market phases, in which the vast majority of market participants seem to almost exclusively choose one action (between buying or selling) over the other. From the point of view of conventional economic theory, such events are thought to reflect the arrival of “external news” that justifies the observed behavior. However, empirical observations of the events leading up to such market phases, as well events occurring during the lifetime of such a phase, have often failed to find significant correlation between news from outside the market and the behavior of the agents comprising the market. In this paper, we explore the alternative hypothesis that the occurrence of such market polarizations are due to interactions amongst the agents in the market, and not due to any influence external to it. In particular, we present a model where the market (i.e., the aggregate behavior of all the agents) is observed to become polarized even though individual agents regularly change their actions (buy or sell) on a time-scale much shorter than that of the market polarization phase.
1 Introduction
The past decade has seen an influx of ideas and techniques from physics into economics and other social sciences, prompting some to dub this new interdisciplinary venture as “econophysics” farmer05 . However, it is not just physicists who have migrated to working on problems in such non-traditional areas; social scientists have also started to use tools from, e.g., statistical mechanics, for understanding various socioeconomic phenomena as the outcomes of interactions between agents, which may represent individuals, firms or nations (see for example, Ref. durlauf99 ). The behavior of financial markets, in particular, has become a focus of this kind of multidisciplinary research, partly because of the large amount of empirical data available for such systems. This makes it possible to construct quantitatively predictive theories for such systems, and their subsequent validation.
Analysis of the empirical data from different financial markets has led to the discovery of several stylized facts, i.e., features that are relatively invariant with respect to the particular market under study. For example, it seems to be the case that markets (regardless of their stage of development) show much stronger fluctuations than would be expected from a purely Gaussian process gopikrishnan98 ; sinha06a . Another phenomenon that has been widely reported in financial markets is the existence of polarized phases, when the majority of market participants seem to opt exclusively to buy rather than sell (or vice versa) for prolonged periods. Such bull-market (or bear-market) phases, when the market exhibits excess demand (or supply) relative to the market equilibrium state, where the demand and supply are assumed to balance each other, are quite common and may be of substantial duration. Such events are less spectacular than episodes of speculative bubbles and crashes schiller00 , which occur over a relatively faster time-scale; however, their impact on the general economic development of nations maybe quite significant, partly because of their prolonged nature. Hence, it is important to understand the reasons for occurrence of such market polarizations.
Conventional economic theory seeks to explain such events as reflections of news external to the market. If it is indeed true that particular episodes of market polarizations can only be understood as responses to specific historical contingencies, then it should be possible to identify the significant historical events that precipitated each polarized phase. However, although a posteriori explanation of any particular event is always possible, there does not seem to be any general explanation for such events in terms of extra-market variables, especially one that can be used to predict future market phases.
In contrast to this preceding approach, one can view the market behavior entirely as an emergent outcome of the interactions between the agents comprising the market. While external factors may indeed influence the actions of such agents, and hence the market, they are no longer the main determinants of market dynamics, and it should be possible to observe the various “stylized facts” even in the absence of news from outside the market. In this explanatory framework, the occurrence of market polarization can be understood in terms of time evolution of the collective action of agents. It is important to note here that the individual agents are assumed to exercise their free will in choosing their particular course of action (i.e., whether to buy or sell). However, in any real-life situation, an agent’s action is also determined by the information it has access to about the possible consequences of the alternative choices available to it. In a free market economy, devoid of any central coordinating authority, the personal information available to each agent may be different. Thus the emergence of market behavior, which is a reflection of the collective action of agents, can be viewed as a self-organized coordination phenomenon in a system of heterogeneous entities.
The simplest model of collective action is one where the action of each agent is completely independent of the others; in other words, agents choose from the available alternatives at random. In the case of binary choice, where only two options are available to each agent, it is easy to see that the emergence of collective action is equivalent to a random walk on a one-dimensional line, with the number of steps equal to the number of agents. Therefore, the result will be a Gaussian distribution, with the most probable outcome being an equal number of agents choosing each alternative. As a result, for most of the time the market will be balanced, with neither excess demand nor supply. As already mentioned, while this would indeed be expected in the idealised situation of conventional economic theory, it is contrary to observations in real life indicating strongly polarized collective behavior among agents in a market. In these cases, a significant majority of agents choose one alternative over another, resulting in the market being either in a buying or selling phase. Examples of such strong bimodal behavior has been also observed in contexts other than financial markets, e.g., in the distribution of opening gross income for movies released in theaters across the USA sinha04b .
The polarization of collective action suggests that the agents do not choose their course of action completely independently, but are influenced by neighboring agents. In addition, their personal information may change over time as a result of the outcome of their previous choices, e.g., whether or not their choice of action agreed with that of the majority 111This would be the case if, as in Keynes’ “beauty contest” analogy for the stock market, agents are more interested in foreseeing how the general public will value certain investments in the immediate future, rather than the long-term probable yields of these investments based on their fundamental value keynes34 .. This latter effect is an example of global feedback process that we think is crucial for the polarization of the collective action of agents, and hence, the market.
In this paper, we propose a model for the dynamics of market behavior which takes into account these different effects in the decision process of an agent choosing between two alternatives (e.g., buy or sell) at any given time instant. We observe a phase transition in the market behavior from an equilibrium state to a far-from-equilibrium state characterized by either excess demand or excess supply under various conditions. However, most strikingly, we observe that the transition to polarized market states occurs when an agent learns to adjust its action according to whether or not its previous choice accorded with that of the majority. One of the striking consequences of this global feedback is that, although individual agents continue to regularly switch between the alternatives available to it, the duration of the polarized phase (during which the collective action is dominated by one of the alternatives) can become extremely long. The rest of the paper is organized as follows. In the next section, we give a detailed description of the model, followed in the subsequent section by a summary of the results. We conclude with a discussion of possible extensions of the model and implications of our results. For further details please refer to Ref. sinha04 .
2 The Model
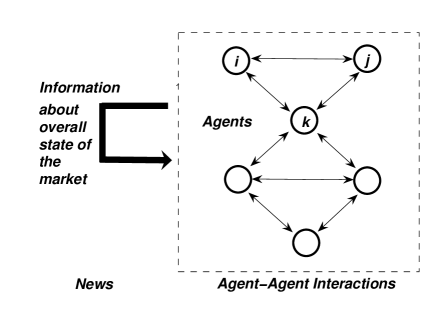
In this section we present a general model of collective action that shows how polarization in the presence of individual choice volatility can be achieved through adaptation and learning. We assume that individual agents behave in a rational manner, where rationality is identified with actions that would result in market equilibrium in the absence of interaction between agents. Therefore, for a large ensemble of such non-interacting agents we will observe only small fluctuations about the equilibrium. Here we explore how the situation alters when agents are allowed to interact with each other. In our model, the market behavior reflects the collective action of many interacting agents, each deciding to buy or sell based on limited information available to it about the consequences of such action. An example of such limited information available to an agent is news of the overall market sentiment as reflected in market indices such as S & P 500. A schematic diagram of the various influences acting in the market is shown in Fig. 1.
Our model is defined as follows. Consider a population of agents, whose actions are subject to bounded rationality, i.e., they either buy or sell an asset based on information about the action of their neighboring agents and how successful their previous actions were. The fundamental value of the asset is assumed to be unchanged throughout the period. In addition, the agents are assumed to have limited resources, so that they cannot continue to buy or sell indefinitely. However, instead of introducing explicit budget constraints iori02 , we have implemented gradually diminishing returns for a decision that is taken repeatedly. This is akin to the belief adaptation process in the Weisbuch-Stauffer model of social percolation weisbuch03 , where making similar choices in successive periods decreases the probability of making the same choice in the subsequent period.
At any given time , the state of an agent is fully described by two variables: its choice, , and its belief about the outcome of the choice, . The choice can be either buy () or sell (), while the belief can vary continuously over a range (initially, it is chosen from a uniform random distribution). At each time step, every agent considers the average choice of its neighbors at the previous instant, and if this exceeds its belief, then it makes the same choice; otherwise, it makes the opposite choice. Then, for the -th agent, the choice dynamics is described by:
| (1) |
where is the set of neighbors of agent (), and sign () = , if , and = , otherwise. The degree of interaction among neighboring agents, , is assumed to be a constant () for simplicity and normalized by (), the number of neighbors. In a lattice, is the set of spatial nearest neighbors and is the coordination number, while in the mean field approximation, is the set of all other agents in the system and .
The individual belief, evolves over time as:
| (2) |
where is the fractional excess demand and describes the overall state of the market at any given time . The adaptation rate governs the time-scale of diminishing returns, over which the agent switches from one choice to another in the absence of any interactions between agents. The learning rate controls the process by which an agent’s belief is modified when its action does not agree with that of the majority at the previous instant. As mentioned earlier, the desirability of a particular choice is assumed to be related to the fraction of the community choosing it. Hence, at any given time, every agent is trying to coordinate its choice with that of the majority. Note that, for , the model reduces to the well-known zero-temperature, random field Ising model (RFIM) of statistical physics.
We have also considered a 3-state model, where, in addition to , has a third state, , which corresponds to the agent choosing neither to buy nor sell. The corresponding choice dynamics, Eq. (1), is suitably modified by introducing a threshold, with the choice variable taking a finite value only if the magnitude of the difference between the average choice of its neighbors and its belief exceeds this threshold. This is possibly a more realistic model of markets where an agent may choose not to trade, rather than making a choice only between buying or selling. However, as the results are qualitatively almost identical to the 2-state model introduced before, in the following section we shall confine our discussion to the latter model only.
3 Results
In this section, we report the main results of the 2-state model introduced in the preceding section. As the connection topology of the contact network of agents is not known, we consider both the case where the agents are connected to each other at random, as well as, the case where agents are connected only to agents who are located at spatially neighboring locations. Both situations are idealised, and in reality is likely to be somewhere in between. However, it is significant that in both of these very different situations we observe market polarization phases which are of much longer duration compared to the timescale at which the individual agents switch their choice state ().
3.1 Random network of agents and the mean field model
We choose the neighbors of an agent at random from the other agents in the system. We also assume this randomness to be “annealed”, i.e., the next time the same agent interacts with other agents, they are chosen at random anew. Thus, by ignoring spatial correlations, a mean field approximation is achieved.
For , i.e., when every agent has the information about the entire system, it is easy to see that, in the absence of learning (), the collective decision follows the evolution equation rule:
| (3) |
For , the system alternates between the states (i.e., every agent is a buyer, or every agent is a seller) with a period . The residence time at any one state () increases with decreasing , and for , the system remains fixed at one of the states corresponding to , as expected from RFIM results. At , the system remains in the market equilibrium state (i.e., ). Therefore, we see a transition from a bimodal distribution of the fractional excess demand, , with peaks at non-zero values, to an unimodal distribution of centered about 0, at . When we introduce learning, so that , the agents try to coordinate with each other and at the limit it is easy to see that for all , so that all the agents make identical choice. In the simulations, we note that the bimodal distribution is recovered for when .
For finite values of , the population is no longer “well-mixed” and the mean-field approximation becomes less accurate the lower is. For , the critical value of at which the transition from a bimodal to a unimodal distribution occurs in the absence of learning, . For example, for , while it is 3/4 for . As increases, quickly converges to the mean-field value, . On introducing learning () for , we again notice a transition to a state corresponding to all agents being buyers (or all agents being sellers), with more and more agents coordinating their choice.
3.2 Agents on a spatial lattice
To implement the model when the neighbors are spatially related, we consider -dimensional lattices () and study the dynamics numerically. We report results obtained in systems with absorbing boundary conditions; using periodic boundary conditions leads to minor changes but the overall qualitative results remain the same.
In the absence of learning (), starting from an initial random distribution of choices and beliefs, we observe only very small clusters of similar choice behavior and the fractional excess demand, , fluctuates around 0. In other words, at any given time an equal number of agents (on average) make opposite choices so that the demand and supply are balanced. In fact, the most stable state under this condition is one where neighboring agents in the lattice make opposite choices. This manifests itself as a checkerboard pattern in simulations carried out in one- and two-dimensional square lattices (see e.g., Fig. 2, top left).
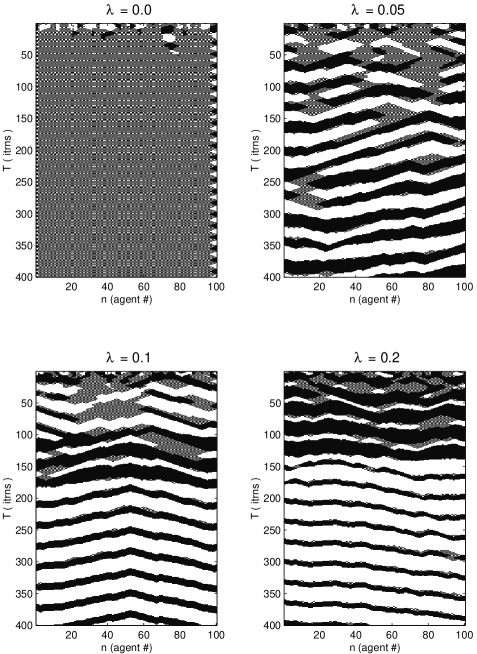
Introduction of learning in the model () gives rise to significant clustering among the choice of neighboring agents (Fig. 2), as well as, a large non-zero value for the fractional excess demand, . We find that the probability distribution of evolves from a single peak at 0, to a bimodal distribution (having two peaks at finite values of , symmetrically located about 0) as increases from 0 sinha05 . The fractional excess demand switches periodically from a positive value to a negative value having an average residence time which increases sharply with and with (Fig. 3).
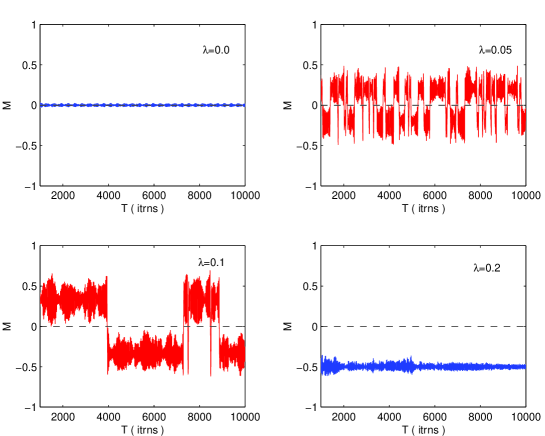
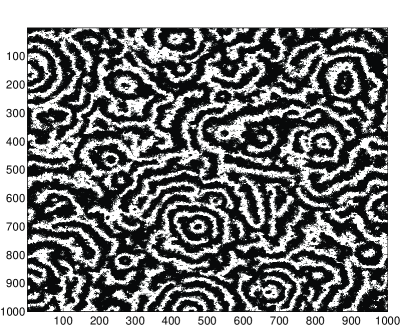
For instance, when is very high relative to , we see that gets locked into one of two states (depending on the initial condition), corresponding to the majority preferring either one or the other choice. This is reminiscent of lock-in in certain economic systems subject to positive feedback arthur89 . The special case of also results in a lock-in of the fractional excess demand, with the time required to get to this state increasing rapidly as . For , large clusters of agents with identical choice are observed to form and dissipate throughout the lattice. After sufficiently long times, we observe the emergence of structured patterns having the symmetry of the underlying lattice, with the behavior of agents belonging to a particular structure being highly correlated. Note that these patterns are dynamic, being essentially concentric waves that emerge at the center and travel to the boundary of the region, which continually expands until it meets another such pattern. Where two patterns meet their progress is arrested and their common boundary resembles a dislocation line. In the asymptotic limit, several such patterns fill up the entire system. Ordered patterns have previously been observed in spatial prisoner’s dilemma model nowak92 . However, in the present case, the patterns indicate the growth of clusters with strictly correlated choice behavior. The central site in these clusters act as the “opinion leader” for the entire group. This can be seen as analogous to the formation of “cultural groups” with shared beliefs axelrod97 . It is of interest to note that distributing from a random distribution among the agents disrupt the symmetry of the patterns, but we still observe patterns of correlated choice behavior (Fig. 4). It is the global feedback () which determines the formation of large connected regions of agents having similar choice behavior.
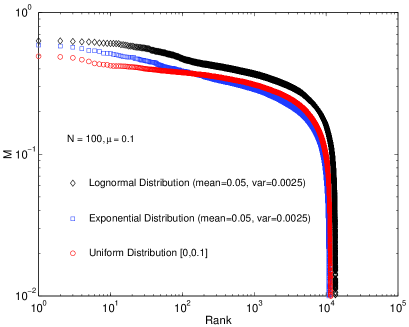
To get a better idea about the distribution of the magnitude of fractional excess demand, we have looked at the rank-ordered plot of , i.e., the curve obtained by putting the highest value of in position 1, the second highest value of in position 2, and so on. As explained in Ref. adamic02 , this plot is related to the cumulative distribution function of . The rank-ordering of shows that with , the distribution varies smoothly over a large range, while for , the largest values are close to each other, and then shows a sudden decrease. In other words, the presence of global feedback results in a high frequency of market events where the choice of a large number of agents become coordinated, resulting in excess demand or supply. Random distribution of among the agents results in only small changes to the curve (Fig. 5). However, the choice of certain distribution functions for elevates the highest values of beyond the trend of the curve, which reproduces an empirically observed feature in many popularity distributions that has sometimes been referred to as the “king effect” laherrere98 ; davies02 .
4 Conclusion
In summary, we have presented here a model for the emergence of collective action defining market behavior through interactions between agents who make decisions based on personal information that change over time through adaptation and learning. We find that introducing these effects produces market behavior marked by two phases: (a) market equilibrium, where the buyers and sellers (and hence, demand and supply) are balanced, and (b) market polarization, where either the buyers or the sellers dominate (resulting in excess demand or excess supply). There are multiple mechanisms by which the transition to market polarization occurs, e.g., (i) keeping the adaptation and learning rate fixed but switching from an initially regular neighborhood structure (lattice) to a random structure (mean-field) one sees a transition from market equilibrium to market polarization; (ii) in the lattice, by increasing the learning rate (keeping fixed) one sees a transition from equilibrium to polarization behavior; and (iii) in the case where agents have randomly chosen neighbors, by increasing the adaptation rate beyond a critical value (keeping fixed) one sees a transition from polarized to equilibrium market state.
The principal interesting observation seems to be that while, on the one hand, individual agents regularly switch between alternate choices as a result of adapting their beliefs in response to new information, on the other hand, their collective action (and hence, the market) may remain polarized in any one state for a prolonged period. Apart from financial markets, such phenomena has been observed, for example, in voter behavior, where preferences have been observed to change at the individual level which is not reflected in the collective level, so that the same party remains in power for extended periods. Similar behavior possibly underlies the emergence of cooperative behavior in societies. As in our model, each agent can switch regularly between cooperation and defection; however, society as a whole can get trapped in a non-cooperative mode (or a cooperative mode) if there is a strong global feedback.
Even with randomly distributed we see qualitatively similar results, which underlines their robustness. In contrast to many current models, we have not assumed a priori existence of contrarian and trend-follower strategies among the agents lux95 . Rather, such behavior emerges naturally from the micro-dynamics of agents’ choice behavior. Further, we have not considered external information shocks, so that all observed fluctuations in market activity is endogenous. This is supported by recent empirical studies which have failed to observe any significant correlation between market movements and exogenous economic variables like investment climate kaizoji00 .
We have recently studied a variant of the model in which the degree of interactions between neighboring agents is not uniform and static, but evolves in time sinha06b . This is implemented by assuming that agents seek out the most successful agents in its neighborhood, and choose to be influenced by them preferentially. Here, success is measured by the fraction of time the agents decision (to buy or sell) accorded with the market behavior. The resulting model exhibits extremely large fluctuations around the market equilibrium state () that quantitatively match the fluctuation distribution of stock price (the “inverse cubic law”) seen in real markets.
Another possible extension of the model involves introducing stochasticity in the dynamics. In real life, the information an agent obtains about the choice behavior of other agents is not completely reliable. This can be incorporated in the model by making the updating rule Eq. (1) probabilistic. The degree of randomness can be controlled by a “temperature” parameter, which represents the degree of reliability an agent attaches to the information available to it. Preliminary results indicate that higher temperature produces unimodal distribution for the fractional excess demand.
Our results concerning the disparity between behavior at the level of the individual agent, and that of a large group of such agents, has ramifications beyond the immediate context of financial markets sinha06 . As for example, it is often said that “democracies rarely go to war” because getting a consensus about such a momentous event is difficult in a society where everyone’s free opinion counts. This would indeed have been the case had it been true that the decision of each agent is made independently of others, and is based upon all evidence available to it. However, such an argument underestimates how much people are swayed by the collective opinion of those around them, in addition to being aroused by demagoguery and yellow journalism. Studying the harmless example of how market polarizations occur even though individuals may regularly alternate between different choices may help us in understanding how more dangerous mass madness-es can occur in a society.
Acknowledgements
We thank J. Barkley Rosser, Bikas Chakrabarti, Deepak Dhar, Matteo Marsili,
Mishael Milakovic, Ram Ramaswamy,
Purusattam Ray and Dietrich Stauffer for helpful discussions. SS would like
to thank the Santa Fe Institute where part of the work was done
and Sam Bowles, Jung-Kyoo Choi, Doyne Farmer and Lee Segel for comments.
References
- (1) Farmer J D, Shubik M, Smith E (2005) Is economics the next physical science ? Physics Today 58 (9):37–42
- (2) Durlauf S N (1999) How can statistical mechanics contribute to social science ? Proc. Natl. Acad. Sci. USA 96: 10582–10584
- (3) Gopikrishnan P, Meyer M, Amaral L A N, Stanley H E (1998) Inverse cubic law for the distribution of stock price variations, Eur. Phys. J. B 3:139–140
- (4) Sinha S, Pan R K (2006) The power (law) of Indian markets: Analysing NSE and BSE trading statistics. In: Chatterjee A, Chakrabarti B K (ed) Econophysics of stock and other markets. Springer, Milan
- (5) Schiller R J (2000) Irrational exuberance. Princeton University Press, Princeton
- (6) Sinha S, Raghavendra S (2004) Hollywood blockbusters and long-tailed distributions: An empirical study of the popularity of movies. Eur. Phys. J. B 42: 293–296
- (7) Keynes J M (1934) The general theory of employment, interest and money. Harcourt, New York
- (8) Sinha S, Raghavendra S (2004) Phase transition and pattern formation in a model of collective choice dynamics. SFI Working Paper 04-09-028
- (9) Iori G (2002) A microsimulation of traders activity in the stock market: the role of heterogeneity, agents’ interaction and trade frictions, J. Economic Behavior & Organization 49:269–285
- (10) Weisbuch G, Stauffer D (2003) Adjustment and social choice. Physica A 323: 651–662
- (11) Sinha S, Raghavendra S (2005) Emergence of two-phase behavior in markets through interaction and learning in agents with bounded rationality. In: Takayasu H (ed) Practical fruits of econophysics. Springer, Tokyo :200–204
- (12) Arthur B W (1989) Competing technologies, increasing returns, and lock-in by historical events. Economic J. 99: 116–131
- (13) Nowak M A, May R M (1992) Evolutionary games and spatial chaos. Nature 359: 826–829
- (14) Axelrod R (1997) The dissemination of culture: A model with local convergence and global polarization. J. Conflict Resolution 41: 203–226
- (15) Adamic L A, Huberman B A (2002) Zipf’s law and the internet. Glottometrics 3:143–150
- (16) Laherrere J, Sornette D (1998) Stretched exponential distributions in nature and economy: “fat tails” with characteristic scales. Eur. Phys. J. B 2: 525–539
- (17) Davies J A (2002) The individual success of musicians, like that of physicists, follows a stretched exponential distribution. Eur. Phys. J. B 4: 445–447
- (18) Lux T (1995) Herd behaviour, bubbles and crashes. Economic J. 105: 881–896
- (19) Kaizoji T (2000) Speculative bubbles and crashes in stock markets: An interacting-agent model of speculative activity. Physica A 287: 493–506
- (20) Sinha S (2006) Apparent madness of crowds: Irrational collective behavior emerging from interactions among rational agents. In: Chatterjee A, Chakrabarti B K (ed) Econophysics of stock and other markets. Springer, Milan
- (21) Sinha S, Pan R K (2006) How a “hit” is born: The emergence of popularity from the dynamics of collective choice. In: Chatterjee A, Chakraborti A, Chakrabarti B K (eds) Handbook of econophysics and sociophysics, Wiley-VCH