The dual-dose imaging technique: a way to enhance the dynamic range of X-ray detectors
Abstract
We describe a method aiming at increasing the dynamic range of X-ray detectors. Two X-ray exposures of an object are
acquired at different dose levels and constitute the only input data. The values of the parameters which are needed
to process these images are determined from information contained in the images themselves; the values of two parameters
are extracted from the input data. The two input images are finally merged in such a way as to create one image containing
useful information in all its entirety. This selective use of parts of each image allows both the contour of the irradiated
object to be visible and the high-attenuation areas to retain their image quality corresponding to the information contained
in the high-dose image. The benefits of the method are demonstrated with an example involving a head phantom.
pacs:
87.57.Ce, 85.57.Nk, 87.59.FmKeywords: cone-beam CT, flat-panel detector, image quality, dual dose, dual pulse
1 Introduction
The high-quality volumetric reconstruction is the common aim in many of the modern imaging modalities. A number of issues are casually packed in the term ‘high quality’, ranging from the suppression of the noise and of occasional artefacts to the enhancement of the contrast and spatial resolution. The dynamic range of the detectors, which are used in the data acquisition, is strongly linked to many of these issues.
Matsinos and Kaissl (2006) describe a method to calibrate one of the operation modes of flat-panel detectors (FDP) manufactured by Varian Medical Systems, Inc. (VMS), Palo Alto, CA; that mode had been developed as a response to the need for increasing the dynamic range of the VMS X-ray detectors. The present paper introduces an alternative approach which is general and simple enough to implement in a variety of FDP types; a patent application, relating to this method, is currently under reviewing, see Dasani et al(2006).
The dual-dose imaging technique may be outlined as follows. Two X-ray exposures of an object are obtained at different dose levels. Although this technique might also be used in case of scans in the future (via an implementation similar to the one proposed in Eberhard et al(2005) in dual-energy imaging), these exposures are currently static (no gantry movement), the irradiated object occupying a fixed position in space. Digitised images, corresponding to the two exposures, are obtained with the use of an X-ray detector. The first dose level is selected in such a way as to yield a good-quality signal in the high-attenuation areas of the projected image (onto the detector). Due to limitations in the range of the output signal (dynamic range of the detector), it is inevitable that the pixel signal in this high-dose image will saturate in the low-attenuation areas of the projected image; in most cases, the low-attenuation areas correspond to the contour of the irradiated object. The second dose level is chosen in such a way as to avoid saturation within the projected image, keeping at the same time the dose as high as possible (to suppress noise). Finally, the two images are combined and create one image with good-quality information in its entirety. The low-noise high-dose pixel signal is used wherever reliable (not saturated); otherwise, it is substituted by the low-dose pixel signal after the latter has been scaled by a factor which is determined on the basis of the two input images.
Given the geometry of an imaging unit, the delivered dose is a function of the X-ray-tube (simply called ‘tube’ hereupon) voltage, tube current and pulse width. A variation of the voltage in the two exposures induces physical effects which can only be accounted for by a dedicated calibration of the imaging unit, similar to the one developed by Matsinos and Kaissl (2006) in the case of the dual-gain mode; for instance, the scatter contribution and beam-hardening effects are energy-dependent. Although the technique of the dual-energy imaging was originally proposed (as a means to visualise simultaneously different parts of the anatomy) about twenty years ago, the research interest in this domain has hardly diminished; the corroboration of this interest is manifested by the amount of patent applications which are currently under reviewing, e.g., see Kump and Odogba (2003), Jabri et al(2004) and Zhao et al(2004). On the other hand, by varying either the current or the pulse width, one modifies the number of incident photons, not their energy; due to this reason, the implementation of an intensity-variation scheme constitutes a less demanding problem. On the technical side, the solution which is assumed in the VMS imaging units pertains to the variation of the intensity of the incident beam via changes induced in the width of the X-ray pulses. This is the reason why the terms ‘short pulse’, ‘long pulse’ and ‘dual pulse’ are often used in the VMS nomenclature as synonyms of ‘low dose’, ‘high dose’ and ‘dual dose’, respectively; in the present paper, we will make use of the latter terms.
2 Materials and methods
2.1 The imaging unit
The data analysed here has been acquired at the VMS laboratory in Baden, Switzerland. The ‘On-Board Imager’ system, comprising the imaging unit of a VMS machine which was recently constructed and put into operation to enable image-guided radiation therapy, has been used. The detailed description of this system may be obtained directly from the website of the manufacturer (‘www.varian.com’).
The X-ray source is the VMS model G242; it is a rotating-anode X-ray tube with maximal operation voltage of kV. The tube is driven and controlled by the X-ray generator. In the mode described herein, the generator has been programmed to trigger two X-ray pulses in succession, the short pulse preceding the long one.
The VMS PaxScan 4030CB amorphous-silicon FPD, which is currently used in the data acquisition, is a real-time digital X-ray imaging device comprising square elements (pixels) and spanning an approximate area of cm2. In order to expedite the data transfer and processing, the so-called half-resolution (-binning) mode is normally used; thus, the detector is assumed to consist of (logical) pixels (pitch: m). Due to the high sensitivity of the scintillating material (thallium-doped cesium iodide) and to sophisticated noise-reduction techniques, the low-dose imaging performance of this type of detector is remarkable, save for a small band ( mm wide) neighbouring its borders (‘inactive area of the detector’). The digitisation depth of this FPD type is bits. In reality, however, nonlinear effects are introduced at signals far below the -bit limit. A thorough method to determine accurately the threshold value (the highest pixel signal which still fulfills the dose-signal linearity) for each pixel separately has been described in Matsinos and Kaissl (2006). In the present paper, one constant (same for all pixels) threshold will be extracted from the data; to a good approximation, this number is equal to the minimal of the values of the threshold map. In the data processing, if a pixel signal exceeds this constant threshold value, the pixel will be assumed saturated.
2.2 The dual-dose imaging technique
2.2.1 Usefulness.
High-quality images are important in a variety of applications. Restricting ourselves to medical imaging, an obvious requirement is that anatomic details in the region of interest be discernible as good as possible. As regions of interest frequently lie well within the irradiated objects, high-dose X-ray pulses are needed to probe their structure; otherwise, the resulting images look grainy and the details are masked by quantum and discretisation noise. Evidently, the delivery of high dose is needed in the high-attenuation areas of the irradiated object.
Unfortunately, the delivery of high dose solves one problem at the expense of creating another; the low-attenuation areas of the object will not be visible if the delivered dose exceeds the limit which is associated with signal saturation. To conclude, due to limitations in the range of the output signal, the good visualisation of one part of the irradiated object impaired the retrieval of information in another.
The dual-dose imaging technique solves the afore-described problem by combining parts of the two images in such a way as to create one image containing useful information in all its entirety. The selective use of parts of the two images allows both the contour of the irradiated object to be clearly visible (avoiding saturation effects) and the high-attenuation areas to retain their image quality corresponding to the high-dose image. Therefore, the application of the technique results in the increase of the dynamic range of the detector which is used in the data acquisition.
2.2.2 Description of the algorithm.
One of the main features of the present approach is that the combination of the two images is based on information which is exclusively contained within them; hence, no additional calibration is needed, that is, beyond the standard calibrations of the dark field (offset) and flood field (flat field, flatness or gain) which are invariably applied to all images.
We now come to the description of the algorithm which is currently implemented. Two parameters are involved: hereupon, they will be called ‘threshold’ and ‘ratio’; their values are obtained from the two input images. The threshold value determines whether the low- or the high-dose information is to be used in the combination of the two images; the ratio value determines the amount by which the low-dose image is to be scaled whenever it is used. In the combination of the two images, the norm is assumed to be the high-dose image. The threshold values obtained in the present paper are offset corrected; this is due to the fact that the input data have been corrected for offset and gain effects.
In order to extract the threshold from the input data, the following steps are taken.
-
1.
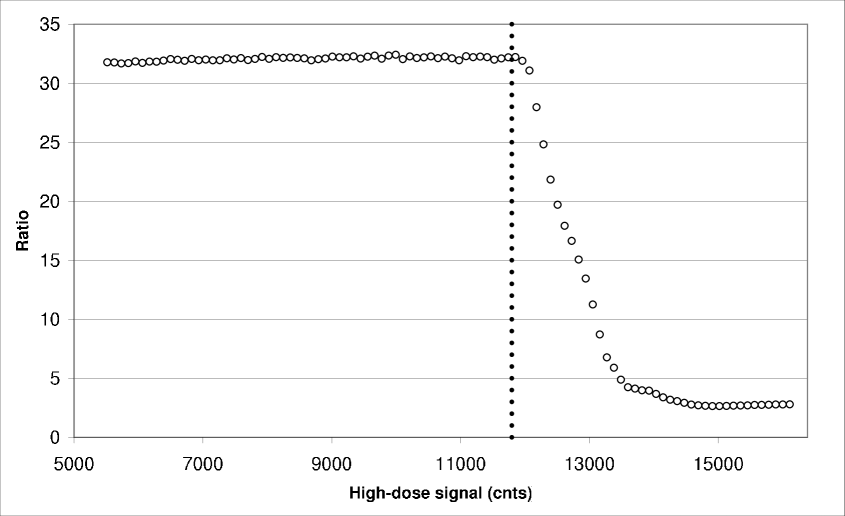
The ratio (high-to-low-dose) of the pixel signals (corresponding to the same position on the detector) in the two images is histogrammed in bins of the high-dose signal; an average value is obtained in each bin. To safeguard against the introduction of noise, bins with less than ten contents are ignored. An example of one such distribution is shown in figure 1. We observe that the ratio of the pixel signals is constant over a wide range of values of the high-dose signal, rapidly dropping at the place where signal saturation sets in.
-
2.
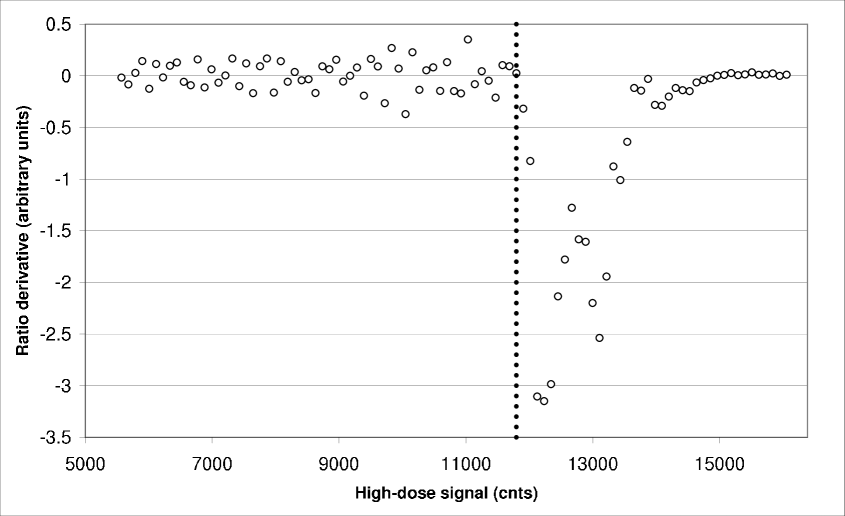
The derivative of the ratio distribution is subsequently obtained (figure 2). The use of the derivative has advantages, namely, the riddance of possible slope effects in the original histogram and larger sensitivity in the area where the ratio of the pixel signals departs from constancy.
-
3.
The threshold is obtained from the derivative plot as follows. Let us assume that an average of ratio-derivative values and an rms (standard deviation) have been calculated from a number of successive entries (bins); we will refer to these values as ‘current’. The value corresponding to the next bin in the plot (with increasing high-dose signal) is tested for constancy on the basis of the current average and rms; in case that the difference (of the bin value to the current average) is larger than fivefold the current rms (i.e., corresponding to a effect for the normal distribution), the procedure terminates and the signal which is associated with the lower bound of the bin tested is originaly assigned to the threshold. The starting point in this iterative scheme is assumed to be the average and the rms calculated from the first ten entries; therefore, the eleventh bin is the first one to be tested for a possible deviation from constancy. The scanning of the derivative plot is done from left (low values of the high-dose signal) to right (high values of the high-dose signal).
-
4.
The ratio-derivative plot is finally scanned backwards (decreasing high-dose signal) starting at the threshold determined in the previous step. A sign change in the difference of the bin value to the current average (compared to the sign of the corresponding difference in the case of the originally-assigned threshold) marks the position of the highest signal which still fulfils the linearity condition. This approach safeguards against several effects, including the existence of an occasional slope in the original plot (figure 1), a drift in the average and rms values extracted on the basis of figure 2, etc. The method is robust; we are not aware of cases in which it failed to yield a reasonable output.
In the implemented solution in the dual-dose imaging, the high-dose image is returned in case that no saturation could be detected (for example, as a result of the selection of inappropriate dose levels in the data acquisition).
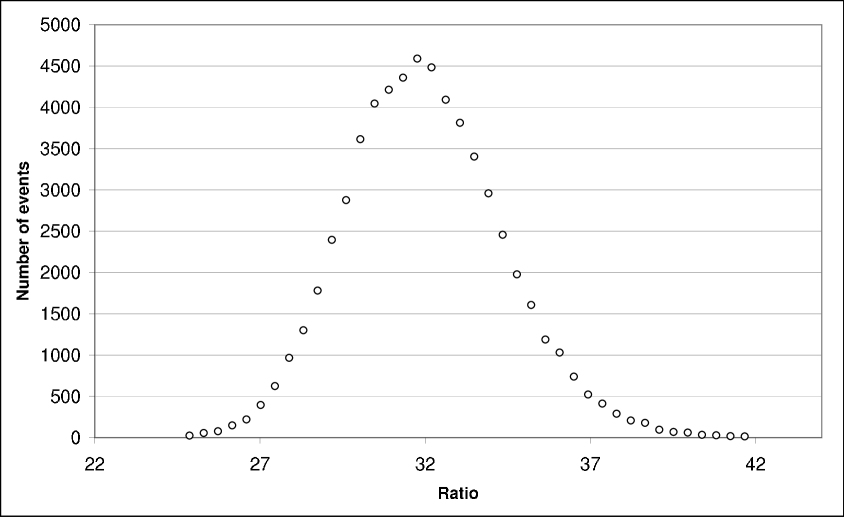
The optimal ratio of the pixel signals is subsequently obtained for all those pixels whose high-dose signal is below threshold (hence, unsaturated). Such a distribution is shown in figure 3; in case of less than ten entries, the bin values are neither shown nor taken into account in the statistics. The average of the distribution is obtained and used in the combination of the two images; the distribution of figure 3 yields an average value of and an rms of . In an ideal world, devoid of noise (quantum, readout, electronic, etc.), the ratio distribution should be a ‘-function’.
2.2.3 Combination of the two images.
Having determined the threshold and ratio values, we can now proceed to the combination of the two images. Our strategy may easily be described in one sentence. If the pixel signal in the high-dose image is below the threshold, it is directly used; otherwise, it is substituted by the low-dose pixel signal after it has properly been scaled by the optimal ratio determined at the end of the previous section.
The combination of the two images may easily be understood with the help of figure 4. The high-dose signal (line (a)) is used in area A (where it is smaller than the threshold); the low-dose signal (line (b)) is used in area B (where the high-dose signal is useless). Finally, the combined image is constructed in the basis of the straight line OM′; in the first segment (OZ), the high-dose signals are used, whereas in the second one (ZM′), the low-dose signals are involved, along with the optimal ratio. Evidently, the dynamic range of the output signal (proportional to the length OM′) is larger than the one corresponding only to the high-dose information (proportional to the length OZ).
3 Results
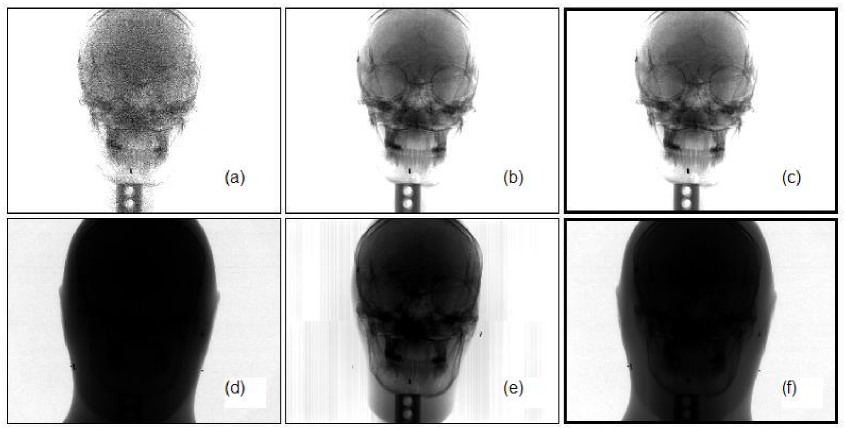
The improvement in the image quality when using the dual-dose imaging technique is demonstrated in figure 5. Two images of a head phantom were taken at kV and mA; the pulse-width settings were: msec for the low-dose image and msec for the high-dose image. Figures 1-3 actually correspond to the analysis performed on these two images. The ‘theoretical’ ratio of the pixel signals is expected to be equal to (ratio of the two pulse widths used), yet it came out closer to (figure 3) due to the fact that the acquisition pulse-width settings do not exactly match the properties of the actual pulses which are produced by the generator 111A correction scheme to account for this effect has been proposed and implemented in another problem, see Matsinos and Kaissl (2006)..
It is evident from figure 5a that the low-dose image is grainy; this is a good example of signal degredation as a result of quantum and discretisation noise. The high-dose image shown in figure 5b does not suffer from this effect. On the other hand, the contour of the irradiated object is nicely reproduced in the low-dose image (figure 5d); due to signal saturation, this is the place where the high-dose image fails (figure 5e). The images shown in figures 5c and 5f correspond to the combination of the two images. The window and level parameters have been adjusted in figures 5 in such a way as to demonstrate the usefulness of the approach described in the present paper. In this example, the use of the two input images was quite balanced: of the low-dose image is taken over in the combined image, of the high-dose image is used. Evidently, details can be simultaneously seen both in the high- and low-attenuation areas of the irradiated object in the combined image.
4 Conclusions
The present paper introduces a method to increase the dynamic range of X-ray detectors which are used in imaging. The input data comprise two fully-corrected (for offset and gain effects) X-ray images of an object, obtained at different dose levels. In the current implementation, the intensity modulation is achieved through a variation of the width of the X-ray pulse; another option would be to vary the X-ray-tube current, or simultaneously both acquisition settings.
The data of the two input images are processed and finally yield the values of two parameters: the first parameter defines the level at which the switching from the high- to the low-dose information will occur in the combination of the two input images, whereas the second represents the amount by which the low-dose image will be scaled whenever it is used. A robust method is proposed to extract reliably the values of these two parameters from the input images. The novelty of the approach relates to the fact that the parameters, needed in the combination of the input images, are determined exclusively from the information these images contain; therefore, no additional calibrations (save for the standard ones, leading to the offset and gain corrections) are needed.
Finally, one image is created, containing signals which are selectively obtained from either of the input images; the dynamic range of the output image is larger than the one corresponding to the input images (which is characterised by the limitation in the discretisation depth of the detector). The final image contains useful information in all its entirety. The selective use of parts of the two input images allows both the contour of the irradiated object to be visible and the high-attenuation areas to retain their image quality corresponding to the high-dose image. The benefits of the method have been convincingly demonstrated with an example involving a head phantom.
References
References
- [1] [] Dasani G, Kaissl W, Matsinos E, Morf D and Riem H 2006 Dual pulse imaging U.S. Patent Application 20060724667
- [2] [] Eberhard J W, Claus B E H and Landberg C 2005 Enhanced X-ray imaging system and method U.S. Patent Application 20050226375
- [3] [] Jabri K N, Avinash G B, Rader A E, Uppaluri R, Sabol J M and Nicolas F S 2004 Method, system and computer product for processing dual energy images U.S. Patent 6816572
- [4] [] Kump K S and Odogba J 2003 Method and system for dual or multiple energy imaging U.S. Patent Application 20030169850
- [5] [] Matsinos E and Kaissl W 2006 The dual-gain mode: a way to enhance the dynamic range of X-ray detectors Preprint physics/0607021
- [6] [] Zhao J, HibbsOpsahl-Ong B and Hopple M R 2004 Dual energy x-ray imaging system and method for radiography and mammography U.S. Patent 6683934