Measurement and Simulation of the Neutron Response of the Nordball Liquid Scintillator Array
Abstract
The response of the liquid scintillator array Nordball to neutrons in the energy range MeV has been measured by time of flight using a 252Cf fission source. Fission fragments were detected by means of a thin-film plastic scintillator. The measured differential and integral neutron detection efficiencies agree well with predictions of a Monte Carlo simulation of the detector which models geometry accurately and incorporates the measured, non-linear proton light output as a function of energy. The ability of the model to provide systematic corrections to photoneutron cross sections, measured by Nordball at low energy, is tested in a measurement of the two-body deuteron photodisintegration cross section in the range MeV. After correction the present measurements agree well with a published evaluation of the large body of data.
keywords:
PACS: 29.40.Mc scintillation detectors, 29.30.Hs neutron spectroscopy, 25.20.Lj photoproduction reactions, 87.53.Wz Monte Carlo applications., , , , , , , , , , , , , and
1 Introduction
Recently photoneutron production cross sections on a range of nuclei [1] have been measured in the energy region 11-30 MeV at the high-duty-factor, tagged-photon facility of MAX-lab [2] in Lund, Sweden. The purpose is to test calculations of neutron dose received during the course of bremsstrahlung radiotherapy [3]. In these time-of-flight (TOF) experiments, at relatively low kinetic energy (), the neutron signal is obscured by an accelerator-induced room background and a high rate of random-coincidence events produced by untagged photons incident on the experimental target. The bulk of this background arises from detected photons, so that good particle identification is required to access MeV, where both the photoproduction cross section and the biological effectiveness of neutrons are at a maximum. The MAX-lab liquid scintillator array Nordball [4], with good pulse shape discrimination (PSD) properties and ns (FWHM) time resolution, was used for these measurements. This paper presents Nordball calibration procedures and a computer model used to evaluate systematic effects which distort the measured neutron yield.
At low energies neutron attenuation and multiple scattering effects on measured neutron yields are large. Thus a simulation of the experiment based on GEANT-3 [5], which models neutron interactions in all materials in the vicinity of the detector array, has been developed to correct for these effects. The non-linear pulse-height response of the scintillators to low energy recoil protons has a critical bearing on these calculations, especially close to threshold, and so this was measured with a white 252Cf neutron source. This is a calibration standard since the neutron yield from spontaneous fission (decay branching ratio 3.1%) is high and both the absolute numbers and energy spectrum of prompt neutrons per fission are well known [6, 7]. Neutron detector response may be obtained in a TOF measurement if fission events are tagged by detection of at least one heavy fragment, which provides a time reference. Although fission chambers [8] are possibly the optimal detectors for fragment detection, a simple thin-film organic scintillator presented a viable, available alternative at the time of the measurement. This type of detector has several desirable properties:
-
1.
Insensitivity to -rays or neutrons as the plastic is extremely thin.
-
2.
Fast response with a similar time resolution to Nordball, which also gives high counting rate capability.
-
3.
Fast, cheap production.
Here we compare the measured and simulated fission-neutron response of the Nordball array and describe a test of the simulation by measurement of the well known cross section. Here the simulations have been used to compute the large attenuation and multiple scattering corrections, as well as the neutron detection efficiency. Sec. 2 gives an overview of the experimental setup, the measured Nordball response is presented in Sec. 3, the Monte Carlo (MC) simulation is described in Sec. 4, measurements and simulations are compared in Sec. 5, and a short summary is given in Sec. 6.
2 The time-of-flight experiment
2.1 The Nordball array
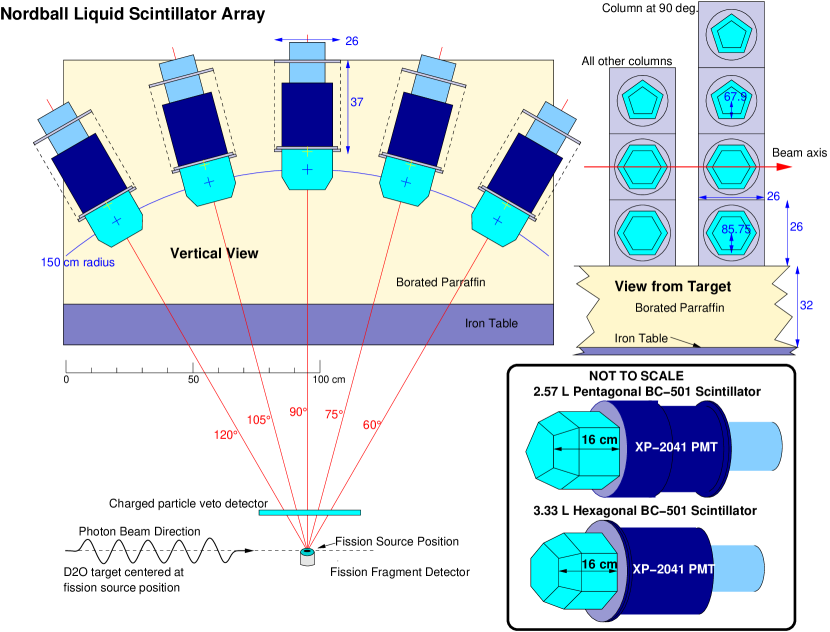
The Nordball detector (Fig. 1) consists of 16 liquid scintillators, type Bicron BC-501, with PSD capability. Ten detectors are of hexagonal cross section and six detectors of pentagonal cross section. Their respective volumes are 3.3 l and 2.6 l at a common thickness of 16 cm. The liquid is contained within a 2 mm thick, stainless steel cannister, coated on its inner surface with TiO2 reflective paint. This is connected to a 5 in. XP2041 photomultiplier tube (PMT) via a Pyrex glass window. A cylinder of -metal shields the PMT from stray magnetic fields and an outer plastic housing encases tube and voltage-divider circuit, which provides a negative anode signal.
All detectors were mounted on aluminium frames and placed on a 32 cm thick layer of borated paraffin, supported by an iron table. The configuration of Fig. 1 consisted of five detector columns, positioned in 15∘ steps, at a distance of 150 cm from the central position where the experimental target or the fission detector was located. The bigger hexagonal detectors were placed in the two bottom rows, five pentagonal detectors in the third, and the last one on top of the central column. Paraffin towers to both sides of the iron table partially shielded the array against regions of strong neutron background. For the deuteron photodisintegration experiment a cm plastic scintillator sheet was inserted between the target and Nordball to identify charged particle events.
2.2 Fission detector
The thin-film scintillator was prepared following Ref. [9]. A solution of plastic scintillator in xylene was spread uniformly over the glass window of a 2 in. PMT (Philips XP2262B) which was placed upright in a vacuum chamber. Slow evacuation of the chamber causes solvents to evaporate and a thin layer of scintillating material remains on the glass. Its thickness was tuned, by varying the amount of plastic in the solution, to optimise discrimination between fission fragments and the 30 times more numerous particles.
The fission source [10] consists of a platinum-clad, nickel disk, on to which was electro-deposited. The active area (0.2 cm2) is covered by a 50 g/cm2 layer of gold allowing the passage of fission fragments with relatively small energy loss. The source was placed on the centre of the scintillating film and the PMT was sealed with a plastic cap, lined with aluminised mylar foil, to exclude external light and provide some reflection of scintillation light. The fission detector was positioned so that the source sat at the target-centre position (Fig. 1) at the same height as the middle of the second Nordball row and the photon beam axis.
The axis of the PMT was offset from vertical. Apart from the bottom row of the array, this offset avoided fission neutrons having to pass through the glass of the PMT on the way to the Nordball detectors. Placing the PMT horizontally would have displaced the loose source from the active area of the PMT face. As a consequence of attenuation in glass, the detected neutron yield in the bottom detectors was found to be about 15% smaller at low energies where the interaction cross section is highest. These losses are consistent with the predictions of a computer model of the experiment (Sec. 4.2) which approximated the PMT by a 2 mm thick glass cylinder and calculated for tilting angles in the range of 5–15 degrees. However the angle was not sufficiently well determined to enable quantitative comparisons and hence the bottom detectors were excluded from the analysis of differential and absolute neutron detection efficiencies presented in Sec. 5.
No suppression of bottom-row neutron yield was observed in the deuteron photodisintegration measurement, which used a cylindrical target, supporting the assumption of increased neutron attenuation in glass during the 252Cf measurement.
Fig. 2 shows the fragment pulse-height distribution obtained from the 252Cf source, which produced a counting rate of kHz. With acceptance for charged particle detection, the effective thickness of the scintillator depended on emission angle and not all 6.11 MeV particles could be separated from heavy fragments by pulse height. A small fraction of particles had to be accepted in the trigger, resulting in the sharp spike observed around channel 250. These events are completely uncorrelated with any detected neutron, confirming that they are not produced by fission fragments. The two broad distributions represent interactions of heavy and light fission fragments, with % of the former lost, judging from the width of the peak. An estimate of the resulting distortion of the neutron spectrum was based on Ref. [6] where the shapes of the neutron energy distributions and the mean numbers of emitted neutrons per fission event for light (1.97) and heavy (1.70) fragments are presented. The distortion in the neutron spectrum is below 2%, and the mean number of neutrons is reduced by 5.4%. No significant deviations from this simple estimate were observed when measured neutron spectra, corresponding to different regions in the fission pulse-height distribution, were compared. However rather than attempt a more sophisticated correction we have factored these distortion effects into the systematic uncertainties associated with the evaluation of the 252Cf fission neutron yield [7].

2.3 Electronics
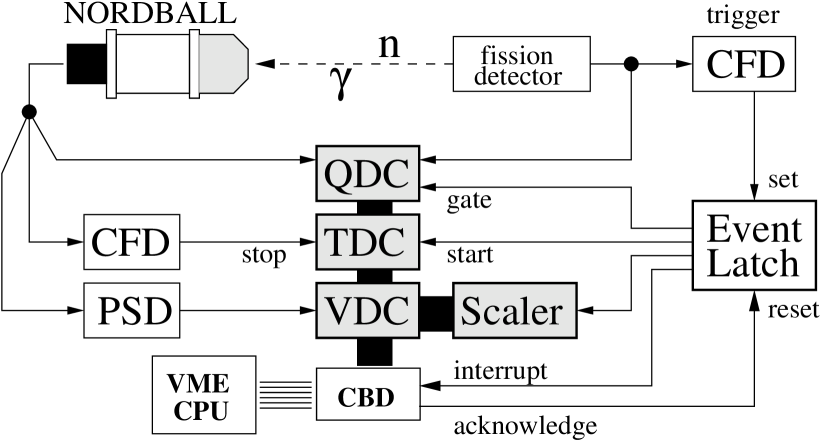
The layout of the electronics is shown in Fig. 3 and the data acquisition and analysis system ACQU is described in Ref. [11]. Analogue to digital converters (ADC) and scalers were read out by a VMEbus single board computer via the CAMAC bus and a VMEbus CAMAC parallel branch driver (CBD). During readout the event latch prevented further triggers until reset at the end of the event.
The experimental trigger for the 252Cf measurement was made by the constant-fraction discriminator (CFD) of the fission detector. The number of triggers was recorded by a scaler for normalisation purposes and the fission pulse height was recorded in a charge-integrating ADC (QDC). Gate and start signals for the various ADCs were derived from the trigger. The anode signal of each Nordball scintillator was split 3 ways and fed to:
-
1.
a QDC to record the pulse amplitude.
-
2.
a CFD connected to a time to digital converter (TDC) to record the time of flight to the scintillator.
-
3.
specialist hardware developed for fast pulse-shape analysis [12], which produces a “pulse-shape” output, recorded in a voltage to digital converter (VDC).
The electronics for the measurement were very similar, except that the trigger was made by the logical OR of the Nordball CFD outputs. In this case the logic outputs from the pulse-shape analysers, flagging a neutron, were used to gate the interrupt signal to the CPU. In addition the signals from each of the 64 focal-plane detectors of the photon-tagging spectrometer were recorded in TDCs and scalers.
3 Nordball Performance
3.1 Pulse-height calibration
The light output from the Nordball detectors was calibrated with the -ray sources , , and Pu/Be. Following Ref. [13], the edges of the resulting Compton electron spectra were initially assumed to be the channels containing 90% of the counts in the peaks in the Compton end-point pulse-height distributions. However this procedure may be over simplistic as the Compton edge position depends on the resolution of the detection system under consideration. In Ref. [14] an empirical formula was determined to estimate the resolution from measured pulse-height spectra and tables of resolution-dependent Compton edge positions, relative to the channel of maximum counts, were produced. These tables were checked using the present GEANT-3 simulation (Sec. 4), which reproduced the result for both Nordball and the detector geometries of Ref. [14]. However the simple approximation of Ref. [13] does not deviate from Ref. [14] by more than 3%.
The pulse-height resolution (FWHM) of the Nordball array was parameterised [14], in terms of scintillation light output in units of electron energy equivalent (MeVee), as:
| (1) |
Small non-linearities in the low energy electron response [15] were neglected. Since the individual detector responses were very similar, they were summed before least-squares fitting to obtain the average response of the Nordball array. Parameter values of 10 % and 5 % were obtained with fixed at zero and this resolution function was implemented in the MC simulation. The obtained values are similar to those of Ref. [16, 17, 18].
3.2 Particle identification
Pulse shape discrimination (Fig. 4) was applied to separate detected neutrons and photons. To quantify neutron and photon regions, two-Gaussian fits were made to pulse shape projections generated for 50 keVee-wide pulse-height bins, yielding peak positions and widths for each distribution. Intervals of around the peak positions defined the neutron or photon region limits at a given pulse height and straight-line fits to these limits defined the boundaries of the neutron/photon regions of the pulse shape plot. Neutron events below the dashed line of Fig. 4 have some photon contamination at pulse heights below MeVee.

3.3 The neutron pulse-height response function

The non-linear scintillation response to recoil protons is vital input to a neutron efficiency simulation and must be measured to avoid large systematic errors close to detection threshold. Using TOF information, neutron events were divided into 625 keV-wide kinetic-energy bins in the range MeV. The resulting pulse-height spectra for each detector were summed to produce the overall response of the array. For each value of the maximum proton recoil energy was determined from the half-height position (), corrected by a multiplicative factor to account for multiple neutron interactions in the scintillators.
Numerical values for were derived from the MC simulation (Sec. 4.1), which mimics the 625 keV neutron energy bins used in the data analysis. A pulse-height distribution for 5 MeV neutrons is shown in Fig. 5. The half-height position at 1.85 MeVee underestimates the expected light output of 2.03 MeVee for maximum-energy recoil protons, calculated from the scintillator response function. This leads to a correction factor at 5 MeV, while for 2 MeV neutrons . A 2nd-order polynomial fit to the MC calculations in the range MeV yielded:
| (2) |
The proton response functions obtained with (filled circles) and without (empty circles) the correction factors are shown in Fig. 6. The symbol size is equivalent to the 50 keVee uncertainty of the half-height position , estimated from variations in the spline functions which fitted the edge regions of the pulse-height spectra. The response function of Ref. [19] (dashed line) describes the energy dependence of the data quite well, after multiplication by a factor of 0.9 (full line) which was determined from a least-squares fit. Note that the first data point at 1.25 MeV is too high because the hardware threshold of 0.25 MeVee cuts into the recoil proton edge distribution (Sec. 5.1). The response of individual detectors showed no significant deviations and a common light output function for the Nordball array was implemented in the MC simulation.

4 The GEANT-3 based Monte Carlo simulation
Measurements of low energy neutron photoproduction require correction for sizable systematic effects on the neutron acceptance, which has led to the development of a GEANT-3 [5] based MC simulation, into which neutron tracking methods from the STANTON code [20, 19] have been incorporated. This coupled approach allows the use of the GEANT-3 neutron cross section data base (package GCALOR [21] based on ENDF/B-6 [22]) at 20 MeV and STANTON procedures for MeV, where the latter provides a more detailed and accurate representation of neutron interactions compared to standard GEANT-3.
The flexible geometry framework of the MC simulation allowed comparison of predictions with a broad range of published neutron response measurements.
4.1 The modified STANTON code
A modified version of STANTON, augmented in the following ways, was used to model the Nordball response in the 252Cf measurement:
-
1.
The hexagonal Nordball geometry was added. Pentagonal elements were treated as hexagonal, but scaled down in cross-sectional area to give the correct pentagonal-element volume
-
2.
Isotropic neutron emission was added to the existing event generator for the 252Cf source.
-
3.
The pulse-height resolution function of Sec. 3.1 was incorporated.
-
4.
The scintillator response to proton interactions, as described in Sec. 3.3, was incorporated.
-
5.
Results were stored as CERN HBOOK ntuples for later analysis.
The core of the simulation, including the neutron tracking routines of Ref. [19], remained unchanged. After benchmark comparisons which reproduced a variety of published neutron efficiency measurements [23, 24, 25], the MC code was applied to Nordball (Sec. 5.1,5.2).
4.2 The coupled GEANT3-STANTON code
The geometry and materials of a particular experiment (Fig. 1) can be described in fine detail using GEANT-3 but, designed primarily for high energy physics, this fails to model low energy neutron interactions accurately. However, with the addition of the GCALOR package the GEANT-3 description of MeV neutron interactions is quite accurate due to the use of recent Evaluated Nuclear Data Files. These files contain neutron partial cross sections, angular distributions and secondary energy distributions evaluated on a grid of discrete energy and angle points, for elements over the full range of the periodic table. This is necessary as few-MeV neutron cross sections are large and strongly dependent on energy and target mass. Any realistic model requires consideration not only of neutron interactions within the detector volume, but also of attenuation and multiple scattering effects in all bulk materials in the locality of the detector. At higher energy such effects become less important, but none the less it remains important to model interactions in the detector volume as accurately as possible.
The present implementation of GEANT-3 incorporates STANTON methods as a subroutine which tracks neutrons inside the organic-scintillator detector volumes, while GCALOR is used for interactions outside the detector volume. The geometry of all components considered in the simulation, and hence calculation of volume boundaries, is controlled entirely by the GEANT-3 tracking system. Original STANTON geometry functions were replaced by the GEANT-3 subroutine gmedia, which may be tailored to handle pentagonal and hexagonal shaped detectors in a straightforward way.
A test of the simulation is described in Sec. 5.3, where it has been used to calculate systematic corrections to a measurement of the well known, two-body deuteron photodisintegration cross section.
5 The detection efficiency from the 252Cf measurement
5.1 Differential detection efficiency
Normalised pulse-height spectra were sorted into incident neutron energy bins of 0.5 MeV width and compared to the MC predictions. A PSD cut was applied to select neutrons and events with unreasonably large recoil proton pulse height, compared to that expected from the incident neutron energy and measured proton response, were rejected.
The resulting TOF spectrum for a hardware threshold of MeVee, shown in Fig. 7, is virtually free of random coincidences which would fill in the 20-30 ns TOF region between the photon peak (some photons beat the PSD cut) and the neutron distribution. A low energy tail due to neutrons that scattered en route to the detectors (and hence had a longer flight path) is present at flight times of 100 ns and longer. These events were suppressed when the detection threshold was raised, and above 0.7 MeVee they were virtually eliminated as discussed in Sec. 3.2.

Assuming isotropic fission neutron emission and neglecting absorption effects in air and detector canisters, which were estimated to be below 3%, the differential efficiency is given by:
| (3) |
where is the pulse-height spectrum for a neutron energy bin of width centered at , (5.4%) is the average number of prompt neutrons per fission event, is the number of fission fragments counted, (3.5%) is the energy distribution of prompt neutrons and (0.4%) is the solid angle subtended by a detector. Relative uncertainties are given in the brackets. The main sources of uncertainty result from distortions of and due to not recording the full fission-fragment, pulse-height spectrum (Sec. 2.2) and the uncertainty contains a further factor due to the uncertainty in .
The agreement between data and simulation is generally good, as shown in Fig. 8. Since the statistical uncertainty increases rapidly as neutron energy increases, the spectra were binned a factor of 2 more coarsely above 5 MeV. The hardware threshold cuts noticeably into the pulse-height distribution for values below 0.3 MeVee. This (voltage) threshold is not sharp due to pulse shape dependence and hence difficult to model accurately. Thus 0.3 MeVee represented a minimum software threshold which could be used for quantitative analysis. At low incident energies multiple scattering leads to a more peak-like shape of the spectrum which flattens out as the incident neutron energy increases. Above 6 MeV competing carbon cross sections lead to an enhancement of pulse heights below MeVee.

5.2 Integral detection efficiency
The neutron yield was obtained for detection thresholds of 0.3, 0.5, 0.7, and 1.0 MeVee from the TOF distribution (Fig. 7), converted to assuming a path length of 1.5 m. Only events with 1 MeV (TOF below 110 ns) where a software pulse-height threshold could be set above the uncertain hardware threshold range were analysed. Substituting for in Eq.3 delivered the absolute detection efficiency, but the efficiency could have been calculated alternatively by integration of the pulse-height spectra.
The average efficiencies, excluding the bottom detectors of the array, are presented in Fig. 9 and compared to the MC predictions. At neutron energies very close to threshold the simulation under predicts the data, especially for the distributions at 0.3 and 0.5 MeVee threshold. The sharp rise in the efficiency just above threshold is well described by the MC simulation, although here the data fall slightly below the model. Generally, the agreement is best in the region between 5–7 MeV where the efficiency function flattens out and here the relative difference, defined as , is within 5%. At higher energies the statistical precision of the data deteriorates due to the rapid fall in fission yield.

5.3 The deuteron photodisintegration measurement
As a test of the ability of the MC model to correct for systematic scattering and absorption effects in neutron photoproduction, the cross section was measured with tagged photons using a target. The 9 cm long, cylindrical target had a diameter of 6.6 cm and a significant fraction of the produced neutrons interacted in the target volume. The Nordball detectors were positioned as in the 252Cf efficiency measurement (Fig. 1) with the target centered at the position previously occupied by the fission source. A 18 mm thick plastic scintillator placed between target and detectors aided identification of charged particles, mainly generated by Compton scattering and pair production in the target. Monoenergetic photons in the range MeV were produced by the tagged bremsstrahlung technique using the MAX-lab tagging spectrometer [2]. The width of a tagged-photon energy bin was 340 keV and the rate in each plastic-scintillator element of the focal plane was kHz.
The 6–8 MeV neutrons produced by two-body photodisintegration interacted in the detectors and bulk materials in the target-detector locality. These interactions were evaluated with the coupled GEANT3-STANTON simulation, described in Sec. 4.2, to provide correction factors for the measured neutron yields.
Fig. 10 shows the comparison between the present data, a high precision measurement at proton [26], and a fit to available low energy data [27]. This fit gives a very good account of the low energy data set and agrees well with a subsequent low energy evaluation [28]. The standard representation of two-body deuteron photodisintegration is with respect to the proton CM angle. The good agreement between data and evaluation supports the ability of the simulation to take scattering and absorption effects into account, bearing in mind that % of the neutrons interacted in the target volume and also a significant fraction in the plastic-scintillator sheet. Note that the simple analytical approach to estimate neutron absorption in each material, on the basis of the reaction cross section and an exponential attenuation function, underestimates neutron losses by more than 30%. This approach fails to account for elastic scattering effects which are important at low neutron energies.
The average cross section measured at the 5 angles was and the parameterisation of [27] gives a value of where the uncertainty is due to the uncertainties in the coefficients of the Legendre expansion of the angular distribution. For the present data, the sources of systematic uncertainty were detector solid angle (0.7%), neutron scattering and absorption (3.2%), detection efficiency (5%), and random-background subtraction (7.6%). The uncertainty for scattering and absorption was estimated by comparing neutron attenuation coefficients from other experiments (Sec. 5.3.1) with the predictions of the present MC simulation.

5.3.1 Application to other detector systems
The present simulation gives an excellent account of the tagged (by the pion capture reaction n) neutron measurement of Ref. [29]. This reported not only the absolute efficiency of a 16 (4x4) cell array of liquid scintillators (of somewhat smaller volume than the Nordball elements), but also the magnitude of “cross-talk” effects where neutrons scatter from one cell to another. The pion capture reaction produced mono-energetic neutrons of 8.9 MeV kinetic energy which were tagged by detection of the 129 MeV photon in a large NaI detector. With two-body kinematics the angular range of the tagged neutron beam was determined by that of the NaI detector, chosen such that the neutron beam directly illuminated the four central neutron cells only. The measured detection efficiency was 21.30.1(stat)0.6(sys)% for the full array while the simulated efficiency with the present code was 21.60.1(stat)%. Magnitudes and shapes of the pulse-height distributions for cross-talk events were also well reproduced. Further comparisons of simulation predictions with neutron measurements [30, 31] also show good agreement.
6 Conclusions
The scintillation response and detection efficiency of the Nordball liquid scintillator array for neutrons was measured using the well known fission, fast-neutron yield from a 252Cf source. Using the measured recoil proton pulse-height response as input to a MC computer model of Nordball, good agreement between simulated and measured detection efficiencies was achieved for neutron energies up to 8 MeV. Above this the fission yield is too low for statistically significant calibrations.
The MC simulation is intended to provide systematic correction factors for neutron photoproduction cross sections and this was checked by measuring the well known 2H cross section in the energy range MeV. Comparison with parameterisations of the differential cross section and previous data suggest that the uncertainty of the MC calculation is within 5%.
In the future we plan to convert of the present GEANT-3 based code to the more modern object-oriented GEANT-4 framework. This is now used extensively to model ionising-radiation interactions in matter at all energies and has branched into many applications including medical physics.
Acknowledgments
The authors wish to thank the staff of MAX-lab for their excellent provision of the electron beam and general laboratory infrastructure. We thank the following for their financial support: the UK Engineering and Physical Sciences Research Council, the Swedish Natural Sciences Research Council and the Italian Instituto Nazionale di Fisica Nucleare. One of the authors (A.R.) expresses thanks to Deutscher Akademischer Austausch Dienst (DAAD) for their support.
References
- [1] I. Akkurt et al., Phys. Med. Biol. 48 (2003) 3345.
- [2] J.-O. Adler et al., Nucl. Instr. and Meth. A 388 (1997) 17.
- [3] A. Zanini, et al., Phys. Med. Biol. 49 (2004) 571.
- [4] S. E. Arnell, Nucl. Instr. and Meth. A 300 (1991) 303.
- [5] R. Brun et al., Detector Description and Simulation Tool, CERN Program Library Long Writeup W5013, March 1994. http://wwwasd.web.cern.ch/wwwasd/geant/
- [6] H. R. Bowman et al., Phys. Rev. 126 (1962) 2120.
- [7] W. Mannhart, IAEA-TECDOC-410, IAEA Vienna 1987, 158–170.
- [8] J. Cub et al., Nucl. Instr. and Meth. A 274 (1989) 217.
- [9] N. N. Ajitanand et al., Nucl. Instr. and Meth. 133 (1976) 71.
- [10] M. Karlsson, M.Sc. Thesis, Dept. of Nuclear Physics, Lund University, 1997. http://www.maxlab.lu.se/kfoto/publications/karlsson_xjobb.pdf
- [11] J. R. M. Annand et al., Nucl. Instr. and Meth. A 368 (1996) 385.
- [12] J. R. M. Annand, Nucl. Instr. and Meth. A 262 (1987) 371.
- [13] H. H. Knox and T. G. Miller, Nucl. Instr. and Meth. 101 (1971) 519.
- [14] G. Dietze and H. Klein, Nucl. Instr. and Meth. 193 (1982) 549.
- [15] H. Schölermann and H. Klein, Nucl. Instr. and Meth. 169 (1980) 25.
- [16] V. V. Filchenkov et al., Nucl. Instr. and Meth. A 294 (1990) 504.
- [17] L. Büermann et al., Nucl. Instr. and Meth. A 332 (1993) 483.
- [18] A. A. Naqvi, H. Al-Juwair and K. Gul, Nucl. Instr. and Meth. A 306 (1991) 267.
- [19] R. A. Cecil et al., Nucl. Instr. and Meth. 161 (1979) 439.
- [20] N. R. Stanton, A Monte Carlo Program for Calculation of Neutron Detection Efficiencies in Plastic Scintillators, US Atomic Energy Commission Chicago Operations Office Report C00-1545-92 (1971).
- [21] C. Zeitnitz and T. A. Gabriel, Nucl. Instr. and Meth. A 349 (1994) 106.
- [22] H. Herman et al., ENDF-102, ENDF-6 Data Formats and Procedures for the Evaluated Nuclear Data File ENDF-VII, BNL-NCS-44945-01/04-Rev., Revised June 2005.
- [23] M. Drosg et al., Nucl. Instr. and Meth. 105 (1992) 573.
- [24] S. T. Thornton et al., Nucl. Instr. and Meth. 96 (1971) 551.
- [25] M. A. Al-Ohali et al., Nucl. Instr. and Meth. A 396 (1997) 388.
- [26] A. DeGraeve et al., Nucl. Phys. A530 (1991) 420. A. DeGraeve et al, Phys. Rev. C45 (1992) 860.
- [27] M. P. DePascale et al., Phys. Lett. 119B (1982) 30.
- [28] A. E. Thorlacius and H. W. Fearing, Phys. Rev. C33 (1986) 1830.
- [29] B. Sawatzky, Calibration of a BC-505 Segmented Neutron Detector over the Energy Range 0–15 MeV, SAL Report No. 60, University of Saskatchewan, 1999. E. Korkmaz et al., Nucl. Instr. and Meth. A 431 (1999) 446.
- [30] P. Désesquelles et al., Nucl. Instr. and Meth. A 307 (1991) 366.
- [31] G. von Edel et al., Nucl. Instr. and Meth. A 332 (1993) 224.