An accurate optical lattice clock with 87Sr atoms
Abstract
We report a frequency measurement of the transition of 87Sr atoms in an optical lattice clock. The frequency is determined to be Hz with a fractional uncertainty that is comparable to state-of-the-art optical clocks with neutral atoms in free fall. Two previous measurements of this transition were found to disagree by about , i.e. almost four times the combined error bar, instilling doubt on the potential of optical lattice clocks to perform at a high accuracy level. In perfect agreement with one of these two values, our measurement essentially dissipates this doubt.
pacs:
06.30.Ft,32.80.-t,42.50.Hz,42.62.FiRecent advances in the field of optical frequency metrology make measurements with a fractional accuracy of or better a realistic short term goal Hollberg05 . Among other possible applications (e.g. a redefinition of the S.I. second, optical very long baseline interferometry in space, direct mapping of the earth gravitational using the Einstein effect,…), a very interesting prospect with measurements at that level is a reproducible test of Einstein Equivalence Principle by the repeated determination of the frequency ratio of different atomic and molecular transitions Uzan03 ; Marion03 ; Bize03 ; Fischer04 ; Peik04 ; Srianand04 . The topicality of such a test has recently been renewed by measurements at the cosmological scale which seem to indicate a slow variation of the electron to proton mass ratio Reinhold06 . The richness of the test directly depends on the performance of the clocks that are used but also on the variety of clock transitions and atomic species on which high accuracy frequency standards are based.
In that context, optical lattice clocks are expected to play a central role in the future of this field. They use a large number of atoms confined in the Lamb-Dicke regime by an optical lattice in which the first order perturbation of the clock transition cancels KatoPal03 . Due to the lattice confinement motional effects, which set a severe limitation to standards with neutral atoms in free fall Li04 ; Sterr04 , essentially vanish Lemonde05 . This gives hope for a ultimate fractional accuracy better than . On the other hand, the large number of atoms in an optical lattice clock in principle opens the way to a short term fractional frequency stability significantly better than with the averaging time in seconds. In this regime the coherence time of the laser frequency locked to the clock transition would be several seconds, possibly tens of seconds 111This implies that the time constant of this servo-loop be shorter than the coherence time of the free-running probe laser.. Such a long coherence time could for instance be used to reduce the width of the optical resonances in single ion clocks down to or below the 0.1 Hz range opening new prospects for these devices also. Finally, the optical lattice clock scheme is in principle applicable to a large number of atomic species (Sr, Yb, Hg, Ca, Mg,…) which is a key feature for the fundamental test discussed above. It is then particularly problematic that the frequency delivered by the first two evaluated optical lattice clocks, which both use 87Sr, disagree by about Takamoto05 ; Ludlow06 , i.e. times the combined error bar of the measurements.
We report here a third independent measurement of the transition of 87Sr in an optical lattice clock. Our measurement turns out to be in excellent agreement with the one of Ref. Ludlow06 . This rules out the explanation of the previous disagreement by an unexpected large frequency shift which would arise in this new type of clock. This conclusion is further strengthened by the significantly larger trapping potential used here as compared to that of both previous experiments. We operate the optical lattice clock with trapping depths ranging from to , where is the recoil energy associated to the absorption or emission of a lattice photon (kHz). We demonstrate that at such high lattice depths, the residual light shift of the clock transition is controlled at the Hz level, i.e. in the range of a few of the individual light shift of both involved atomic states. Including the evaluation of the other systematic effects, the fractional accuracy of the clock is , comparable to state-of-the-art optical frequency standards using neutral atoms in free fall Sterr04 ; Fischer04 .
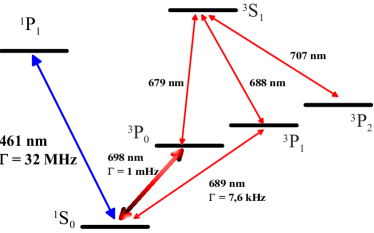
The Sr optical lattice clock has been described in Ref. Brusch06 and we only briefly recall the main features of its operation time sequence. We first load atoms in the vertical 1-D optical lattice operated at its maximum depth, presently K. The lattice beam is focused to a 90 m waist and goes through a cloud of cold atoms at 2 mK that is produced by a MOT based on the transition (see the relevant energy levels in Fig. 1). Atoms at the center of the lattice beam are drained to the and metastable states by a two-photon optical pumping scheme using the transitions at 688 nm and 689 nm. This leads to a continuous loading of the lattice at a rate of a few atoms/s. After typically 500 ms of loading time, the MOT and drain lasers are switched off. Atoms are repumped back to the ground state, and cooled down to about 10 K in 60 ms using the narrow intercombination transition at 689 nm. Next, the lattice depth is ramped down in 1 ms and the clock transition is probed by a beam at 698 nm from an interference-filter stabilized extended cavity diode laser Baillard06 . Its emission spectrum is narrowed by Pound-Drever-Hall locking to an ultrastable cavity Drever83 ; Quessada03 . The probe beam is overlapped with the dipole trap and has a waist radius of 210 m. The transition probability to is finally measured by detecting successively the populations of both and states.
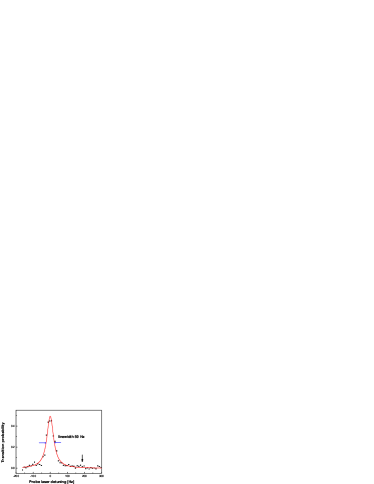
The excitation spectrum at 698 nm consists in a narrow carrier at the clock transition frequency that is surrounded by motional sidebands detuned by the lattice oscillation frequencies. The carrier is displayed in Fig. 2. It has a width of 50 Hz, for a probe time of 15 ms and a laser power of 3 W. The corresponding line Q-factor is about . We observed no dependence of the linewidth on the depth of the trapping potential (the resonance of Fig. 2 was for ). Depending on the depth of the lattice during the probe pulse the longitudinal oscillation frequency ranges from 70 kHz to 210 kHz, three orders of magnitude largeur than the width of the resonance. In addition the corresponding sidebands are reduced by a factor Leibfried03 , with the Lamb-Dicke parameter ranging from 0.1 to 0.03 here. The frequency pulling of the carrier by the longitudinal sidebands is therefore totally negligible. The transverse confinement of the atoms is much weaker than the longitudinal one and leads to an oscillation frequency between 140 Hz and 410 Hz. Excitation of the transverse sidebands is possible due to the non-zero transverse content of the probe wave-vector distribution. This transverse content results from diffraction (the divergence of the probe beam is 1 mrad), the imperfection of the probe/lattice alignement and wavefront aberrations. However, as can be seen in Fig. 2, transverse sidebands do not emerge from the noise in the experimental spectrum and are at least 20 times smaller than the carrier. The corresponding line frequency pulling is less than 1 Hz.
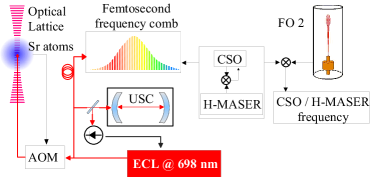
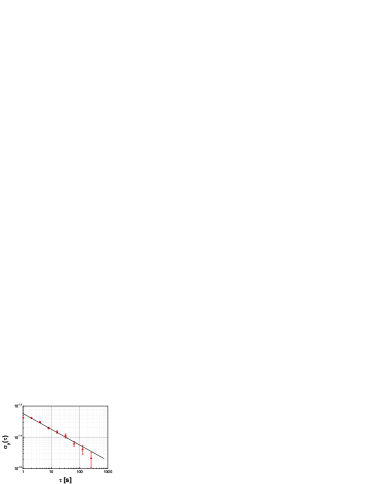
The frequency measurement chain is depicted in Fig. 3. The probe beam frequency is locked to the atomic transition by alternately probing both sides of the carrier resonance. The difference between two successive measurements of the transition probability gives the error signal that is digitally integrated to servo control the frequency of an acousto-optic modulator (AOM) used to bridge the detuning between the atomic transition and the ultra-stable cavity. The cavity frequency is continuously measured by means of a femtosecond frequency comb relative to a 1 GHz signal Holzwarth00 ; Jones00 . The latter is provided by an cryogenic sapphire oscillator Chambon05 that is locked to a H-maser and referenced to the SI second by the Cesium fountain clock FO2 with a relative uncertainty in the range Bize04 . The fractional Allan standard deviation of the measurement is and is displayed on Fig. 4. The frequency resolution is therefore 1 Hz (or in fractional units) after about 10 minutes of integration time. The main contributors to the measurement noise are the femtosecond frequency comb and the strontium clock with roughly equal weights 222The femtosecond frequency comb measurements average down as due to a 200 ms deadtime between two successive measurements..
The residual first order Zeeman effect is the main source of uncertainty in our measurement. Both clock levels of total internal angular momentum have different Landé factors which correspond to a frequency shift of -0.18 Hz/mG/ and -0.08 Hz/mG/ for and respectively, with the magnetic number. The measurements are performed at zero magnetic field. Three pairs of Helmholtz coils surround the vacuum chamber and are used to compensate for the environmental field by minimizing the width of the atomic carrier resonance. The cancellation is performed to within 10 mG, limited by environmental fluctuations. The residual field may result in a systematic frequency shift if there is an unbalance between the Zeeman sublevels populations or an asymmetry of the probe laser polarization with respect to the direction of that field. The population asymmetry is evaluated by measuring the clock frequency as a function of the depth of the servo-loop frequency modulation. The results of this test are shown in Fig. 5.(a) for various values of the angle formed by the probe laser and the lattice beam polarizations showing no clear dependence of the clock frequency on these parameters. We conservatively assign an uncertainty of 5 Hz to the first order Zeeman effect. This present limitation to our accuracy budget is purely technical and can certainly be improved by orders of magnitude by resolving the Zeeman structure and using spin-polarized atoms.
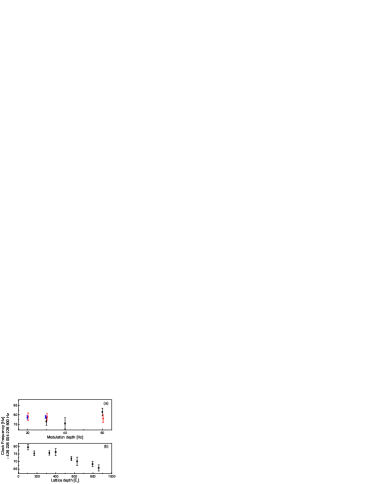
The lattice wavelength control is presently performed with a commercial wavemeter which exhibits long term fluctuations of the order of nm at 813 nm. Tuning of the lattice to the exact point where the first order light shift cancels is therefore limited to that level and all measurements are performed by interleaving sequences with different lattice depths Brusch06 . In Fig. 5.(b) is shown the clock frequency as a function of the lattice depth. The detuning with respect to the magic wavelength deduced from this particular measurement is nm. At the average lattice depth , the differential light shift is Hz with an uncertainty which corresponds to of the individual shift of both clock states. Note that this evaluation takes into account all contributors to the atomic dynamic polarizability including the higher order multipolar terms and the residual vector and tensor terms in the actual polarization and magnetic state configuration Ovsiannikov06 . The frequency shift due to the atomic hyperpolarizability is evaluated by combining the present measurements with those of Ref. Brusch06 . This leads to a correction of the measurements by 0.6 Hz at with an uncertainty equal to the correction.
Finally, we have measured the clock frequency as a function of the atomic density to check for a possible frequency shift due to cold collisions in our unpolarized fermionic sample. This leads to a correction of the clock frequency of Hz at the average atomic density of about at/cm3.
| Systematic effects | Correction | Uncertainty |
| First order Zeeman shift | 0 | 5 |
| Lattice AC Stark shift | 4.5 | 0.9 |
| Lattice 2nd order Stark shift 333These numbers result from the data of Ref. Brusch06 combined with new measurements. | 0.6 | 0.6 |
| Line pulling by motional sidebands | 0 | |
| Cold collisions | 1 | 1 |
| Probe AC Stark shift | 0 | |
| Blackbody radiation shift | 2 | |
| FO2 fountain accuracy | 0 | |
| Total | 8 | 5.3 |
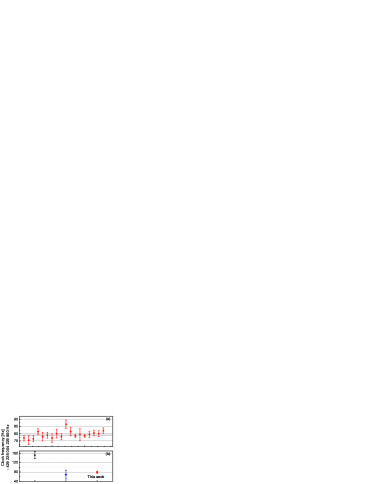
The accuracy budget of the Sr optical clock is summarized in table 1 and gives a total systematic uncertainty of 5 Hz. The weighted average of our measurements which are plotted in Fig. 6.(a) is Hz with a statistical uncertainty of 0.5 Hz. In Fig. 6.(b) are shown the result of this new measurement together with the two previously published values of Ref. Takamoto05 and Ref. Ludlow06 . Our measurement is in excellent agreement with the one of Ref. Ludlow06 . This agreement is a confirmation that optical lattice clocks can indeed operate at a high level of accuracy.
Today this level is comparable to state-of-the-art optical clocks with neutral atoms in free fall Sterr04 ; Fischer04 with obviously large room for improvement. By polarizing the atoms and using a small bias magnetic field, we hope to be able to decrease by orders of magnitude the uncertainty due to the linear Zeeman effect which is presently the main contributor to the measurement uncertainty. The evaluation of the other effects will take advantage of the unprecedented versatility of this new type of clock. A large number of operation parameters can be varied such as the trapping depth and configuration (polarization of the trapping laser, 1D or 3D lattice), the probe polarization, the atom number, the interrogation scheme (Rabi or Ramsey) and duration, etc… This will be of great value for untangling the various physical effects that contribute to the uncertainty budget.
We thank A. Clairon and S. Bize for useful comments on the manuscript and together with G. Santarelli, F. Chapelet and M. Tobar for their work on the FO2 fountain and cryogenic oscillator. SYRTE is Unité Associée au CNRS (UMR 8630) and a member of IFRAF (Institut Francilien de Recherche sur les Atomes Froids). This work is supported by CNES and DGA.
References
- (1) L. Hollberg et al., J. Phys. B: At. Mol. Opt. Phys. 38, S469 (2005).
- (2) J.-P. Uzan, Rev. Mod. Phys. 75, 403 (2003).
- (3) H. Marion et al., Phys. Rev. Lett. 90, 150801 (2003).
- (4) S. Bize et al., Phys. Rev. Lett. 90, 150802 (2003).
- (5) E. Peik et al., Phys. Rev. Lett. 93, 170801 (2004).
- (6) M. Fischer et al., Phys. Rev. Lett. 92, 230802 (2004).
- (7) R. Srianand, H. Chand, P. Petitjean, and B. Aracil, Phys. Rev. Lett. 92, 121302 (2004).
- (8) E. Reinhold et al., Phys. Rev. Lett. 96, 151101 (2006).
- (9) H. Katori, M. Takamoto, V. G. Pal’chikov, and V. D. Ovsiannikov, Phys. Rev. Lett. 91, 173005 (2003).
- (10) R. Li and K. Gibble, Metrologia 41, 376 (2004).
- (11) U. Sterr et al., C. R. Physique 5, 845 (2004).
- (12) P. Lemonde and P. Wolf, Phys. Rev. A 72, 033409 (2005).
- (13) M. Takamoto, F.-L. Hong, R. Higashi, and H. Katori, Nature 435, 321 (2005).
- (14) A. D. Ludlow et al., Phys. Rev. Lett. 96, 033003 (2006).
- (15) A. Brusch et al., Phys. Rev. Lett. 96, 103003 (2006).
- (16) X. Baillard et al., arXiv:physics/0605046 (2006).
- (17) R. W. P. Drever et al., App. Phys. B 31, 97 (1983).
- (18) A. Quessada et al., J. Opt. B : Quantum Semiclassical Opt. 5, S150 (2003).
- (19) D. Leibfried, R. Blatt, C. Monroe, and D. Wineland, Rev. Mod. Phys. 75, 281 (2003).
- (20) R. Holzwarth et al., Phys. Rev. Lett. 85, 2264 (2000).
- (21) D. J. Jones et al., Science 288, 635 (2000).
- (22) D. Chambon et al., Rev. Sci. Instrum. 76, 094704 (2005).
- (23) S. Bize et al., C. R. Physique 5, 829 (2004).
- (24) V. Ovsiannikov, V. Pal’chikov, H. Katori, and M. Takamoto, Quantum Electron. 36, 3 (2006).