New parametrization for differences between plasma kinetic codes
Abstract
Validation and verification of plasma kinetics codes requires the development of quantitative methods and techniques for code comparisons. We describe two parameters that can be used for characterization of differences between such codes. It is shown that these parameters, which are determined from the most general results of kinetic codes, can provide important information on the differences between the basic rate coefficients employed. Application of this method is illustrated by comparisons of some results from the 3rd NLTE Code Comparison Workshop for carbon, germanium, and gold plasmas.
and ††thanks: Permanent address: Soreq Nuclear Research Center, Yavne, Israel 81800. ††thanks: Corresponding author. Email: yuri.ralchenko@nist.gov.
1 Introduction
Spectroscopy of plasmas has a wide range of applications book ; Griem , including the study of astrophysical objects, diagnostics of laser produced plasmas, and analysis of radiation emission from plumes of rockets. In spite of the importance of this subject and the substantial efforts made by numerous groups, there persist significant discrepancies in results of the plasma kinetic codes used to analyze plasma emission spectra under non-local-thermodynamic-equilibrium (NLTE) conditions. For examples of the level of disagreement see, e.g., the reports from the NLTE Code Comparison Workshops NLTE1 ; NLTE2 ; NLTE3 .
Given the plasma particle temperature and density, the first task of kinetic codes is the computation of the charge state and excitation state distributions book ; Griem . These are typically determined from the set of rate equations:
| (1) | |||||
where is the density of ions having charge ( with being the nuclear charge) excited to state (ordered according to their ascending energy, corresponds to the ion’s ground state), is the electron density, and denotes the rate coefficient (r-c) for the transition of an ion from state to state due to some atomic process. In Eq. (1), represents the number of electrons taking part in any given process, thus, for spontaneous decay and autoionization, for the electron impact processes (e.g., excitation and photorecombination), and for the three-body recombination. In large-size plasmas, where linear dimension is larger than the photon mean free path, photon induced processes must also be included in (1). In a steady state plasma, , and Eq. (1) reduces to:
| (2) |
This is a finite set of non-linear coupled equations for ’s. If one is interested only in the density of the charge states, regardless of the ionic excitations, Eq. (2) can be further simplified, and the result is a set of recursive equations:
| (3) |
Here is the density of the charge state, and , and are the total rate coefficients for ionization, two-body (radiative+dielectronic) recombination, and three-body recombination, respectively. For quasineutral plasmas, solutions of Eq.(3) have to satisfy two complementary conditions, namely,
| (4) |
Here is the total ion density, and is the average charge of the ions. In the following we assume that is the fractional abundance of charge state , which is equivalent to the assumption that = 1.
The disagreement between the results of the kinetic codes developed by various researchers may originate from several factors. One of the most important is the approximate character of the r-c’s. In the literature one can find several recommended formulas for the relevant r-c’s. Some may be more accurate than others, but none was shown to have high accuracy. For higher accuracy, the r-c’s can be directly calculated for each transition between atomic states, using advanced quantum-mechanical methods. The necessity to generate a large number of r-c’s for kinetic calculations, however, impedes the application of these techniques, thereby forcing a compromise between computational speed and accuracy. The solutions of (3) obviously depend on the methods chosen for the determination of the r-c’s in the right-hand side of (3).
Another source of disagreement is the criterion used for the continuum or ionization potential lowering in plasmas. This is particularly important in high-density plasmas where the plasma potential moves the upper ionic bound states into the continuum, leaving the ion only with a finite number of discrete states. Moreover, due to the fluctuations of the local microfield around each ion, even the ”tightly bound states” may change into instantaneous quasi-molecular states whose treatment is, as yet, not clear.
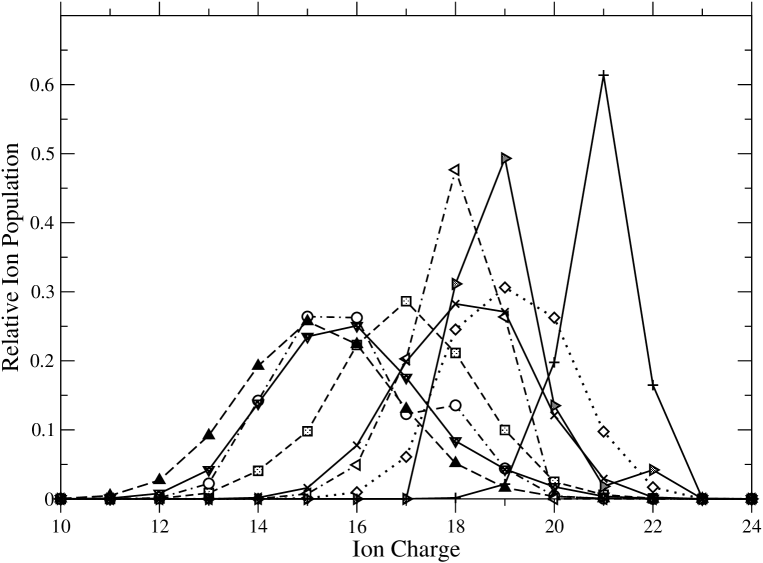
Comparison of the results of NLTE kinetic codes was a subject of several workshops NLTE1 ; NLTE2 ; NLTE3 . The participants were asked to submit large sets of various physical quantities to be compared, and in numerous cases very significant differences were found. This situation is well exemplified in Fig. 1, where the various calculations of the relative ion populations for a germanium plasma are presented for a specific case from the NLTE-3 Workshop NLTE3 . One can clearly notice a significant spread both for the mean ion charges and for the distribution widths calculated with different kinetic codes. Although a variety of physical parameters investigated at the Workshop was mostly sufficient to draw conclusions about sources of discrepancies, introduction of simple and clearly defined new parameters that would pinpoint some fundamental underlying differences would greatly facilitate such comparisons.
In Ref. PRA one of the authors developed a method that allows determination of variations in an ionization state distribution due to small changes in the rates of basic atomic processes. The purpose of the present paper is the opposite, that is, to introduce new parameters that quantify differences in the input atomic rates in kinetic codes using the results of calculations. Such approach is similar to solution of the inverse problem in physics.
Below we address a simple but critical question, namely: “How different are two population kinetic codes?” It is obvious that the most comprehensive answer can be obtained provided all input and output parameters as well as the complete description of the approximations used are available. Unfortunately, this is not always the case. Here we introduce parameters that are straightforward to calculate and can provide an answer in a clear manner. An important feature of the proposed method is that only the most general kinetic characteristics, such as the mean ion charge and central momenta, are required to determine these new parameters.
The paper is organized as follows. In the next section we define these parameters and explain their meanings. In Section 3 we apply the method to characterize the differences between code results for three representative cases from the NLTE-3 Workshop NLTE3 . Finally, in Section 4, a short summary and conclusions are presented.
2 Quantitative characterization of kinetic codes
We introduce the notation for the r.h.s. of Eq. (3):
| (5) |
and denote by the overall difference in this quantity for a given code relative to the reference. Using this definition, Eq.(3) is rewritten as:
| (6) |
It was shown in Ref. PRA , that the relative difference in the final results, , caused by the relative differences used in the input data, , is given by
| (7) |
where
| (8) |
In particular, if the relative differences are all equal, then
| (9) |
| (10) |
In Ref. PRA a full discussion is presented about the meaning of Eq. (10), as well as how and when this difference influences the results of kinetic codes. Even if is not constant, one can define their average value, , over the relevant ion charge states.
The above formulas were derived assuming small differences between code results. In a general case, however, the deviations are not small, and one has to symmetrize the relevant parameters with respect to both compared codes, i.e.:
| (11) |
and so on, which is assumed in what follows.
Multiplying both sides of Eq.(10) by and summing over all charge states, one arrives at:
| (12) |
where is the variance, or second central moment, which is related to the ionization distribution width. Remarkably, this equation links the average difference in the ratios of effective atomic rates to the most general plasma parameters, namely, mean ion charges and variances.
However, if two compared codes have the same but different variances, the parameter defined by Eq. (12) is zero. This simply means that the approximation (9) is insensitive to differences in ionization distribution widths. To take this dependence into account, one can add the next term in the expansion with respect to :
| (14) |
To derive equations relating two parameters, and , we multiply Eq. (14) by and and then sum both sides over ion charges. The two ensuing equations are sufficient to obtain the following expressions:
| (15) |
where is the th central moment.
Equation (15) is the main result of the present paper. We propose to use the parameters and for characterization of differences between plasma kinetic codes. Using Eq. (15), which depends only on the most general kinetic parameters, namely, mean ion charges and central momenta, one can directly evaluate the average differences between the effective rates implemented in various kinetic codes.
3 Comparison of kinetic codes
The above described method is applied here to the computational results from the 3rd NLTE Workshop NLTE3 that can be accessed in the NIST SAHA database SAHA . This database contains various parameters, including mean ion charges, central momenta, and ion populations, which may be used to determine the quantities and defined in Eqs. (12) and (15). The SAHA database also provides other valuable parameters, such as effective rates and partition functions, so that a user can obtain a deep insight into differences between kinetic codes. In accordance with the policy accepted by the Workshop participants, the results will be presented without direct attribution, although a list of participating codes will be given for each case. Note also that not all codes provide a complete set of central momenta up to .
The first step of the comparison procedure consists in selection of a reference against which the other codes are to be compared. In the following comparisons the reference code is chosen arbitrarily, as generally there are no a priori physical grounds to prefer a particular code. Obviously, the average values of and would change when selecting another code as a reference. However, the standard deviations of the corresponding distributions of and that reflect the average spread within a group of codes should not change and therefore are reported below as well. In what follows, the parameters and determined from Eqs. (12) and (15) are referred to as “calculated”, while those determined by fitting the ratios (Eqs. 9 and 13) are referred to as “fit”. As the fitting procedure has to include only the physically significant cases, ion states with were excluded from the comparison. Also, in order to emphasize the contribution from the most populated states, the fitting was performed with the weights , where and are the ion populations of the reference and compared codes.
Among numerous cases available in the SAHA database we selected three cases for germanium, carbon, and gold. These elements cover a wide range of ion charges and their ions represent atomic systems with different level of complexity.
3.1 Ge
For germanium, we selected a relatively simple case of Te = 600 eV and Ne = cm-3, where almost all codes have a mean ion charge corresponding to a closed-shell Ne-like Ge. This case will be discussed in more detail than the C and Au cases.
Table 1 presents calculated and fit (superscript “”) values of parameters and . The values of determined from the single-parameter formula (12) or fit using Eq. (9) have subscript “0”. One can immediately notice a generally good agreement between the calculated and fit values of for all but one code. Table 1 clearly demonstrates that code 7 is an outlier, which is also emphasized by its very different value of the mean ion charge . Moreover, the two-parameter fit was not performed for code 7, as for only one ion stage both code 7 and the reference code have populations larger than .
| Code No. | ||||||
|---|---|---|---|---|---|---|
| 1 | -0.566 | -0.708 | -0.509 | -0.249 | -0.510 | -0.308 |
| 2 | -0.400 | -0.247 | -0.379 | -0.044 | -0.309 | 0.124 |
| 3 | -0.507 | -0.417 | -0.571 | 0.130 | -0.594 | 0.288 |
| 4 | 0.223 | 0.222 | 0.159 | 0.150 | 0.140 | 0.256 |
| 5 | -0.203 | -0.140 | -0.210 | 0.033 | -0.206 | 0.113 |
| 6 | -0.764 | -0.942 | -0.760 | -0.130 | -0.760 | -0.260 |
| 7 | -4.266 | -1.298 | -3.800 | -1.389 | —– | —– |
| 8 | -0.592 | -0.122 | -0.334 | -0.175 | -0.018 | 0.413 |
| 0.301 | 0.362 | 0.272 | 0.142 | 0.298 | 0.255 |
Another interesting feature is a very small difference between the “simple” of Eq. (9) and calculated and fit values of determined from the two-parameter formulas. While agreement between differently calculated parameters is generally very good, the calculated and fit values of show worse level of correspondence. This is not surprising since is a high-order parameter which may be more sensitive to small variations in data.
As already mentioned, a standard deviation would unambiguously represent the spread of parameters and within a particular group of codes. The last row in Table 1 show ’s calculated for each column (the outlier code 7 was not included in the determination of ). Remarkably, ’s for calculated and two-parameter calculated and fit ’s agree within only 6 %, and even deviates by less than 25 %. The value of 0.3 means that in this group of codes the average deviation of effective ionization and recombination rates is about 30 %.
Finally, consider the dependence of on electron temperature . The SAHA database contains data for = 150 eV, 250 eV, 450 eV, and 600 eV at = cm-3. The calculated ’s for , , and are presented in Fig. 2 for the four temperatures. At low , the mostly populated ions are those with open shells, and since these cases are most difficult to calculate, the difference between codes is the largest. With the increase of electron temperature, the ionization stage approaches the closed-shell Ne-like ion, and therefore agreement improves dramatically. Note also that is smaller than , and therefore in many cases a simple one-parameter formula for would be sufficient for estimates of the difference between codes.

3.2 C
Carbon cases in the SAHA database were calculated at a single electron density of Ne = cm-3. At Te = 20 eV, which is the selected case here, the mean ion charge varies between 1.8 to 3.3 for different codes. There are no obvious outliers in this case, and therefore two-parameter fits were successful for all codes (Table 2). Similar to the Ge case, the correlation between calculated and fit values is generally good, although one-parameter ’s for codes 8 and 9 show larger discrepancies. The standard deviations for the different parameters in Table 2 agree even better than for the Ge case, however, they are about a factor of 2 larger and reach 60 %. This would seem to be unexpected as carbon simulations could include only seven ionization stages at most and are thus supposed to be simpler. The reason for the larger ’s is that the effects of ionization potential lowering are much more important here due to the significantly higher density, and different treatments of the continuum lowering noticeably contribute to the increased spread of the and, to a lesser extent, values.
| Code No. | ||||||
|---|---|---|---|---|---|---|
| 1 | -0.795 | -1.003 | -1.182 | 0.411 | -1.440 | 0.693 |
| 2 | 1.043 | 0.537 | 0.755 | 0.515 | 0.635 | 0.605 |
| 3 | 0.629 | 0.434 | 0.443 | 0.295 | 0.435 | 0.361 |
| 4 | -1.015 | -0.991 | -1.245 | 0.154 | -1.046 | 0.135 |
| 5 | -0.770 | -0.899 | -1.064 | 0.291 | -1.001 | 0.305 |
| 6 | -0.345 | -0.337 | -0.393 | 0.042 | -0.340 | 0.009 |
| 7 | -0.209 | -0.395 | -0.467 | 0.331 | -0.471 | 0.374 |
| 8 | 0.020 | -0.158 | -0.221 | 0.322 | -0.218 | 0.403 |
| 9 | 0.257 | -0.374 | -0.132 | 0.547 | -0.362 | 0.851 |
| 0.651 | 0.535 | 0.660 | 0.151 | 0.638 | 0.250 |
3.3 Au
The gold cases available in the SAHA database show very significant differences, and for the selected case of Ne = cm-3 and Te = 750 eV, the mean ion charge varies between 31 (code 7) and 44 (code 4). Moreover, ionization distributions for codes 1 and 2 show double peak structure unlike other, smoother bell-like distributions. It is therefore not surprising that the absolute values of , which are the main indicators of code disagreements, are much larger than for the Ge and C cases discussed above. As a consequence, the standard deviations for the differently determined and values do not show the same level of agreement as previously. This situation simply reflects very significant differences between code results submitted to the 3rd NLTE Code Comparison Workshop.
| Code No. | ||||||
|---|---|---|---|---|---|---|
| 1 | 2.293 | 1.376 | 1.118 | -0.454 | 1.297 | 0.042 |
| 2 | -0.534 | -0.410 | 0.418 | -0.085 | -0.434 | -0.025 |
| 3 | -1.151 | -1.061 | -0.393 | 0.050 | -1.067 | 0.050 |
| 4 | -1.338 | -1.178 | -0.497 | 0.061 | -1.189 | 0.052 |
| 5 | 1.638 | 1.387 | 0.384 | -0.101 | 1.419 | -0.039 |
| 6 | -1.086 | -1.042 | -0.422 | 0.070 | -1.052 | 0.069 |
| 7 | 3.393 | -0.970 | 0.678 | -0.129 | -0.979 | -0.056 |
| 8 | -1.162 | -0.302 | -0.302 | -0.028 | -0.218 | 0.403 |
| 1.763 | 1.001 | 0.568 | 0.160 | 0.996 | 0.136 |
4 Conclusions
As the complexity of plasma kinetic codes rapidly increases, their verification and validation is becoming mandatory for establishing credibility of computational results. To this end, a development of new techniques for code comparisons is an urgent and important task. In the present paper we introduced two new parameters for the characterization of discrepancies between plasma kinetic codes. These parameters describe differences between effective ionization and recombination rates used in the codes. Importantly, the only physical quantities required for their calculation are the mean ion charges and central momenta that are the most widely reported characteristics of plasma kinetic calculations. Since the final formulas include only the simplest algebra, this method provides very fast estimates of code differences in the input atomic rates. The new parametrization was applied to the data from the 3rd NLTE Code Comparison Workshop and the presented results clearly prove simplicity and reliability of the method used. We plan to implement this method to the analysis of the data from future NLTE workshops.
Acknowledgments
This work was carried out while one of us (D.S.) spent a two-month working visit at the Atomic Physics Division of the National Institute of Standards and Technology. He would like to express his thanks for the cooperative atmosphere and generous hospitality. Authors would also like to thank H. R. Griem and R. W. Lee for reading the manuscript and valuable comments. This research was supported in part by the Office of Fusion Energy Sciences of the US Department of Energy.
References
- (1) D. Salzmann, Atomic Physics in Hot Plasmas, Oxford University Press, 1998.
- (2) H. R. Griem, Principles of Plasma Spectroscopy, Cambridge University Press, 1997.
- (3) R. W. Lee, J. K. Nash, and Yu. Ralchenko, J. Quant. Spectrosc. Radiat. Transfer 58, 737 (1997).
- (4) C. Bowen, A. Decoster, C. J. Fontes, K. B. Fournier, O. Peyrusse and Yu. V. Ralchenko, J. Quant. Spectr. Rad. Transfer 81, 71 (2003).
- (5) Yu. Ralchenko, R. W. Lee, and C. Bowen, in: 14th APS Topical Conference on Atomic Processes in Plasmas, AIP Conference Proceedings 730, 151 (2004); C. Bowen, R. W. Lee, and Yu. Ralchenko, J. Quant. Spectr. Rad. Transfer 99, 102 (2006).
- (6) Yu. Ralchenko (2006). NIST SAHA Plasma Kinetics Database (version 1.0 beta), [Online]. Available: http://nlte.nist.gov/SAHA [2006, March 12]. National Institute of Standards and Technology, Gaithersburg, MD.
- (7) D. Salzmann, Phys. Rev. A22, 2245 (1980).