Visual Saliency and Attention as Random Walks on Complex Networks
Abstract
The current article shows how concepts from the areas of random walks, Markov chains, complex networks and image analysis can be naturally combined in order to provide a unified and biologically plausible model relating saliency and visual attention. Two types of models are proposed: (i) images are converted into complex networks by considering pixels as nodes while connections are established in terms of fields of influence defined by visual features such as tangent fields induced by gray-level contrasts and distance; and (ii) image pixels exhibiting particularly distinctive values of visual properties such as gray-level intensity, contrast, size of objects, orientation and texture are mapped into nodes and the weights of links are defined in order to favor transitions between regions with similar or different visual features, also taking the distance between the nodes into account. Preferential random walks are performed on such networks in order to emulate attentional shifts and eye movements, and the saliency of each region is obtained in terms of the frequency of visits to each node at equilibrium. In the case of the first model, there is a definite tendency to emphasize not only high curvature points but also convergences of the tangent field. The frequency of visits is found to be strongly correlated with the node degrees (strengths) for this model. Different results have been obtained for the second model as a consequence of the directed and asymmetric nature of the respectively obtained networks.
pacs:
87.19.Dd, 87.57.Ce, 89/75.HcThe ability to focus attention on important things is a defining characteristic of intelligence. (R. J. Shiller)
I Introduction
Vision Marr (1982) is the ability, given a specific scene, to recognize the existing objects and their respective properties (e.g. position, rotation, size, etc). Although vision is natural to animals, achieving maximum flexibility in primates, all attempts by science and technology to emulate this ability have to a large extent failed — full fledged vision is simply too complex. Artifacts (e.g. shadows and occlusion), 2D projections, and noise always present in images imply a degenerated mapping from real scenes to the biological visual representation, so that the effective recognition of objects ultimately demands high levels of intelligence and comprehensive models of the visual features of our world. Actually, even the natural solutions to vision have been achieved at great cost and difficulty. Though nearly 50% of the human cortex is dedicated at varying degrees to visual analysis and integration, only a very small region of the visual space, the area falling onto the fovea, can be carefully analyzed at higher resolution by such a formidable parallel computing system at any time. Even so, the remaining several limitations of vision are attested by a myriad of optical illusions.
The serious limitations of the cortical hardware in processing vision ultimately implied the retina to perform effective pre-processing in order to filter out redundancies (luminance correlations) before forwarding the visual information to the brain, via the lateral geniculate nucleus Tovée (1996). This is to a great extent achieved through detection of the borders of the objects in images, which tend to be associated to luminance contrasts. Because only the fovea, an area of the retina accountable for about just one degree of the visual field, is engaged in high resolution image analysis, it is important to have effective means for moving this small window along time and space, performed through saccadic eye movements Tovée (1996), so as to integrate along time and space the most important portions (saliencies) of the image into a sensible whole. Extensive experimental investigations have shown that points exhibiting high contrast (e.g. Parkhurst et al. (2002); Krieger et al. (2000)) and/or curvature (e.g. Attneave (1954)) tend to play a decisive role in saliency definition and detection. Other important experimental evidences include the presence in the primary visual cortex of many neurons which are orientation sensitive, exhibiting the so-called simple and complex receptive fields, in the sense of being capable of estimating the tangent field along the retinotopic representation of the scene Tovée (1996). Because of the decreasing resolution along the retina as one moves from its center to the periphery, it is reasonable to assume the saliency of local portions of the image to be inversely related to the distance from those portions to the center of the fovea (or attention). In addition to gaze shift driven by saliencies, more subtle visual mechanisms are performed on the peripheral visual field in order to decide where to look next. The shifts of attention and their relation to saliencie saliencies involving or not eye movements are the main subject of this article.
In spite of the intense and extensive experimental and theoretical research in visual perception, relatively few physics-based approaches have been proposed relating saliency detection and selective attention. In addition to the now classical work of Brockmann and Geisel Brockmann and Geisel (2000), who modeled human scanpaths in terms of stochastic jumps in random quenched salience fields, a more recent model of gaze shift has been reported by Boccignone and Ferraro Boccignone and Ferraro (2004), who used non-local transition probabilities over a previously estimated saliency field upon which a constrained random walk was performed. This work considered transitions between the pre-assigned saliencies at any uniformly random chosen orientation around each node. The present work combines recent results from the areas of complex networks (e.g. Albert and Barabási (2002); Newman (2003); Boccaletti et al. (2006)), Markov models (e.g. Brémaud (2001)), random walks (e.g. Tadic (2001); da F. Costa and Sporns (2006)), and artificial image analysis (e.g. da F. Costa and Jr (2001); da F. Costa (2004)) in order to develop a simple and yet unified and biologically plausible model naturally integrating gaze shift and salience detection. One of the main theses supported in the current work is that
i.e., saliencies and selective attention would be inherently intertwined in the mammals visual system (and possibly also in artificial vision). The two types of models suggested in the current article involve representing the image as a complex network such that each part of the image (or object) is mapped as a node and connections between these nodes are established in terms of specific visual features such as the tangent field induced by the image contrasts, distance between points/objects and size of objects, as well as differences between the visual properties around each node. The image under analysis is henceforth represented in terms of the matrix , whose elements ( and ) are called pixels (picture elements) and the gray-level value is proportional to the image luminance (only black and white and gray-level images are considered here).
First, we address the case of selective attention driven by tangent fields defined by the image gray-level variations. Images can have their borders detected (a procedure similar to that performed by the retina) and a random walk performed along the herein defined tangent field. The steady state of the visits to nodes is conveniently calculated from the eigenequation involving the stochastic (transition) matrix associated to the respectively driven Markov chain. Interestingly, the saliencies of the image are naturally revealed as a consequence of the most frequently visited nodes, at the same time as these points act as beacons for the random walk, therefore naturally integrating selective attention/gaze shift and saliency manifestation. The effects of having the connections in the complex network representation of the image to be unit or inversely proportional to the distance between pairs of points, as well as random walks characterized by uniformly random choice of next moves or preferential to the degree of the target nodes, are considered and discussed. Another interesting finding is the strong correlation identified between the frequency of visits to nodes and the respective degrees/strengths. A second type of model for selective attention/saliency is also presented in this work where the nodes are pre-defined in terms of some specific visual property related to the contrast, curvature, size and orientation of objects, as well as the distance between the latter. The transition probabilities between nodes are defined in order to promote movements towards nodes exhibiting similar or different visual attributes while being inversely proportional to the distance between nodes (all considered networks are geographical).
II First Model: Orientation Field Networks
The first step in this type of model involves transforming the image into a complex network . As in the retina, special attention is given to the pixels defining high gray-level contrasts typically found at the borders of objects. These pixels can be conveniently detected by using the Sobel or Laplacian of Gaussian filters (e.g. Marr (1982); da F. Costa and Jr (2001)) for gradient estimation. The orientations defined by such edges (parallel to them) can be estimated directly from the Sobel operator or by the spectral method for tangent and curvature field estimation da F. Costa and Jr (2001). As the current article is restricted to binary images, the latter method for tangent field estimation has been applied. The orientation of the edge at position is henceforth represented as .
The connections of the complex network representing the image are established as follows: each detected edge element is representedas a node and connected through unit and symmetric weights with all other edge elements lying on the straight line passing by with inclination . An alternative connectivity scheme also considered in this work involves assigning weights which are symmetric but instead of being unitary, are set as being inversely proportional to the distance between the pixels and . Note that the network connections therefore correspond to visual associations induced by strong contrasts in the image, accounting for the tendency of human vision to follow straight lines. Actually, this representation of an image in terms of a complex network can be understood as a particular case of the methodology suggested in da F. Costa (2004), where pixels are connected while taking into account the similarity between their properties (in the case of the current work, their tangent field).
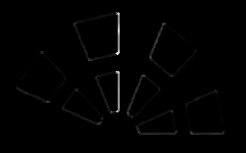
Figure 1 illustrates an image (a) as well as the weight matrix (b) of the respectively associated complex network considering unit weights. The weight matrix considering strengths inversely proportional to the distance between pairs of edge elements would be visualized as a nearly diagonal matrix, so it is not shown.

(a)
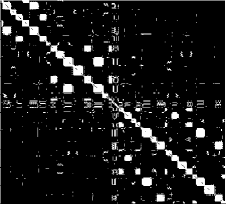
(b)
Observe that, at this point, we have neither salience detection nor attention dynamics implemented yet in our model yet. In order to try to obtain both these important concepts in a simple and integrated way, traditional 111Namely random walks in which the next edge to be trailed is chosen with uniform probability among the edges connected to the current node. and preferential random walks are performed on the complex network. The stochastic matrix associated to traditional random walks can be inferred from the respective weight matrix of the complex network as
| (1) | |||
| (2) |
where stands for the outdegree (our outstrength) of node . Preferential walks are alternatively performed so as to randomly choose the next edge (among those emanating from the current node) with probability directly proportional to the degree (or strength) of the respective target nodes. In this case, the respective stochastic matrix becomes:
| (3) | |||
| (4) |
The outdegree (or outstrength, a term often applicable to weighted networks) of a node therefore corresponds to the sum of all weights of outbound edges along the column of the stochastic matrix. Both the above matrices necessarily follow the particular eigenvalue equation , so that the frequency of visits to nodes in the steady state is immediately given by the respective values of the eigenvector associated to the unit eigenvalue, normalized so that .
While the random walks provide the means to mimic the tangent field driven attention shift, the saliencies can be defined as the most frequently visited nodes during a long walk, i.e. as a consequence of the random walk dynamics. Figure 2 shows the obtained saliency field for the image in Figure 1(a), assuming ‘traditional’ random walks. Higher activities are denoted by clearer gray levels. Interestingly, the saliencies not only tended to correspond to high curvature points (vertices along the outlines of the objects) but also resulted particularly marked at the convergence of the tangents (i.e. into the circular shape at the bottom of the figure). The dominance of such a point of convergence ultimately implied the remainder of the image to become darker, because of the normalization of the normalization of gray-level variation adopted for the sake of better visualization. Also interesting is the fact that longer lines, or sets of aligned lines, tend to be characterized by higher frequency of visits to all involved nodes, suggesting another dimension of the salience in visual structures, namely as being proportional to the lenght of the aligned structures. Another important point to be born in mind is that the anysotropies of the representation of objects into a orthogonal (e.g. Klette and Rosenfeld (2004); da F. Costa and Jr (2001)) lattice imply the lines to result with a degree of jaggedness which is dependent of the respective line orientation, with the highest quality lines verified for the horizontal and vertical orientations. The frequency of visits obtained by considering weights inversely proportional to the distance between connected nodes are given in Figures 2(b). Although the vertices have again resulted as being particularly salient, the convergence at the circular shape is much weaker than for the ‘traditional walks’, as a consequence of the fading effect of the edges along distance.
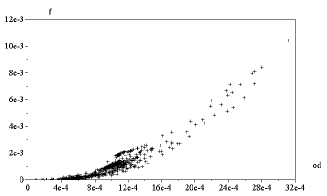
The results obtained for inversely proportional weights and random walks with preferential choice of movements (favoring destination nodes which have higher outstrength) are shown in Figure 2(c). The interesting effect of this alternative dynamics implied some elements of the image to become significantly more salient, as is the case with the circular shape. Figure 2(d) shows the saliency field obtained while disconsidering the circular shape. The most salient figure now corresponds to the vertical line. It is particularly remarkable that this line, and not the horizontal line (both of which presenting null jaggedness), have been highlighted. This is explained because the vertical line is the subject of more crossings with other lines than the horizontal one, therefore attracting more converging movements emanating from the other parts of the image. Figure 3 shows the correlation between the frequency of visits and the outdegree observed for the case shown in Figure 2(d). It is clear from this result that pixels which are topological hubs tend to be activity hubs also, in a superlinear way, accounting for the enhancement of saliency implied by the preferential random walks. A strong linear correlation has been observed for the traditional random walks, suggesting the use of pixels outdegree as predictors of dynamical activity and saliency.
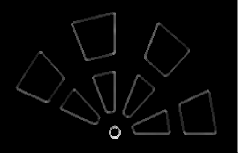
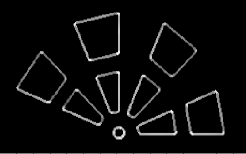
(a) (b)
(c) (d)
III Second Model: The Effect of Visual Properties on Saliency
The second modeling approach considered in this work involves a pre-selection of image regions and their mapping into respective nodes, instead of considering each pixel as a node as in the previous methodology. The regions can be selected according to several criteria. For instance, regions of particularly high gray-level values, contrast or curvature can be detected and mapped into nodes. It is also possible to define a regular sampling of the image by a lower resolution grid and consider specific features around each node, such as gray-level intensity, contrast, orientation, spatial frequency and even object size. Once such regions are chosen, it is necessary to define some means of obtaining the connectivity between them. In this work we consider the similarity between the visual features of each pairs of nodes as well as the distance between those nodes.
More specifically, we define the weights of the respectively associated weight matrix as , where is the individual visual feature (or feature vector) associated to each node and expresses the distance between the nodes and ; is a function of the visual properties of nodes and , such as the Euclidean distance between those measurements. The transition matrix underlying the preferential random walks is directly obtained from the weight matrix by a normalization procedure implying all the colums of the transition matrix to add to 1.
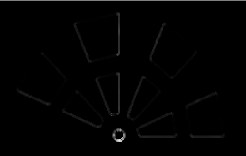
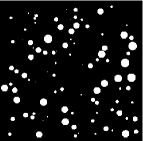
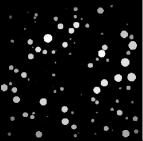
Figure 4 shows an image containing several disks (a) as well as the respective saliency field (b) obtained by considering each disk as a node and taking , where is the radius of the destination node. The resulting saliencies, corresponding to the highly visited nodes during preferential random walks, can be found to be directly related to the radius of the disks. At the same time, nodes which are surrounded by a greater number of nearby disks tend to become more salient, implying the objects at the borders to be less salient. We have found verying degrees of correlation between the resulting saliency and the in- and out-strength. Similarly varying correlations have also been observed between the resulting saliencies and the original visual features (the radius disk, in the case of this example).
(a) (b)
IV Concluding Remarks
All in all, this work has proposed two models of selective attention and salience detection founded on several concepts from the areas of complex networks, Markov models, random walks, and artificial image analysis. These models are conceptually appealing because of the natural integration of attention and salience definition, the flexibility to be used at varying spatial scales and considering different driven mechanisms, and the interesting correlations between simulated activity and network topology. The potential of the approach has been illustrated with respect to simultaneous detection of vertices and convergences as well as identifying overall salience in a field of disks with varying sizes.
Future developments could consider the respective convergence time implied by each case, as well as the number of visited nodes and edges (e.g. da F. Costa (2006)) along time. Also interesting would be the application of the proposed methodology for the analysis of images of neuronal cells, allowing the identification of branches and vertices while also enhancing the convergences of processes which is typically found in those cells. The results for the tangent driven random walks also suggest the development of a computationally effective algorithm for saliency detection where all image pixels falling under the tangent lines defined by the edges would be incremented. It would also be interesting to consider other types of random walks, including self-avoiding and self-attracting dynamics, as well as the incorporation of additional driving constraints implied by prior knowledge about the objects, memory, assigned tasks, etc. Of special importance would be the confrontation of the models with real data provided by eye-tracking systems, which would allow the identification of the most likely model parameters.
Luciano da F. Costa thanks Gustavo Vrech for the simulation of some specific configurations and is also grateful to CNPq (301303/06-1) and FAPESP (05/00587-5) for financial sponsorship.
References
- Marr (1982) D. Marr, Vision (Henry Holt and Company, 1982).
- Tovée (1996) M. J. Tovée, An introduction to the visual system (Cambridge, 1996).
- Parkhurst et al. (2002) D. Parkhurst, K. Law, and E. Niebur, Vision Res. 42, 107 (2002).
- Krieger et al. (2000) G. Krieger, I. Rentschler, G. Hauske, K. Schill, and C. Zetsche, Spat. Vis. – Special Issue ‘Object Recog.’ 13, 201 (2000).
- Attneave (1954) F. Attneave, Psych. Review 61, 183 (1954).
- Brockmann and Geisel (2000) D. Brockmann and T. Geisel, Neurocomp. 32–33, 643 (2000).
- Boccignone and Ferraro (2004) G. Boccignone and M. Ferraro, Physica A 331, 207 (2004).
- Albert and Barabási (2002) R. Albert and A. L. Barabási, Rev. Mod. Phys. 74, 47 (2002).
- Newman (2003) M. E. J. Newman, SIAM Review 45, 167 (2003), cond-mat/0303516.
- Boccaletti et al. (2006) S. Boccaletti, V. Latora, Y. Moreno, M. Chavez, and D.-U. Hwang, Physics Reports (2006), accepted.
- Brémaud (2001) P. Brémaud, Markov Chains: Gibbs Fields, Monte Carlo Simulation, and Queues (Springer Verlag, 2001).
- Tadic (2001) B. Tadic, Eur. Phys. J. B 23, 221 (2001).
- da F. Costa and Sporns (2006) L. da F. Costa and O. Sporns (2006), q-bio.NC/0602021.
- da F. Costa and Jr (2001) L. da F. Costa and R. M. C. Jr, Shape Analysis and Classification: Theory and Practice (CRC Press, 2001).
- da F. Costa (2004) L. da F. Costa (2004), cond-mat/0403346.
- Klette and Rosenfeld (2004) R. Klette and A. Rosenfeld, Digital Geometry (Morgan Kaufmann, 2004).
- da F. Costa (2006) L. da F. Costa (2006), physics/0601118.