Nonequilibrium phase transition in the coevolution of networks and opinions
Abstract
Models of the convergence of opinion in social systems have been the subject of a considerable amount of recent attention in the physics literature. These models divide into two classes, those in which individuals form their beliefs based on the opinions of their neighbors in a social network of personal acquaintances, and those in which, conversely, network connections form between individuals of similar beliefs. While both of these processes can give rise to realistic levels of agreement between acquaintances, practical experience suggests that opinion formation in the real world is not a result of one process or the other, but a combination of the two. Here we present a simple model of this combination, with a single parameter controlling the balance of the two processes. We find that the model undergoes a continuous phase transition as this parameter is varied, from a regime in which opinions are arbitrarily diverse to one in which most individuals hold the same opinion. We characterize the static and dynamic properties of this transition.
pacs:
87.23.Ge, 64.60.Ak, 89.75.Fb, 89.75.HcI Introduction
Simple mathematical models describing emergent phenomena in human populations schelling , such as voter models and market models, have a long history of study in the social sciences. It is only relatively recently, however, that physicists have noted the close conceptual and mathematical connections between these models and traditional models in statistical physics such as spin models. Building on this observation, there have been a number of important advances in the understanding of these models in the last decade or so, most notably in the study of social networks AB02 ; DM02 ; Newman03d . While the physics community has been concerned primarily with studies of network structure, there has also been a substantial line of investigation focusing on dynamical processes on networks. One example, which has a long history in sociology but is also well suited to study using physics methods, is the dynamics of opinion formation. This problem highlights one of the fundamental questions in network dynamics, namely whether dynamics controls the structure of a network or the structure controls the dynamics.
It is observed that real social networks tend to divide into groups or communities of like-minded individuals. An obvious question to ask is whether individuals become like-minded because they are connected via the network liggett:vot ; cas:vot ; sood:vot ; sznajd ; deuff:opi ; cc:axe , or whether they form network connections because they are like-minded mcp:bird . Both situations have been studied with physics-style models, the first using opinion formation models liggett:vot ; cas:vot ; sood:vot and the second using models of “assortative mixing” or “homophily” Soderberg02 ; Newman03c ; BPDA04 . Common sense, however, tells us that the distinction between the two scenarios is not clear-cut. Rather, the real world self-organizes by a combination of the two, the network changing in response to opinion and opinion changing in response to the network. In this paper we study a simple model—perhaps the simplest—that combines opinion dynamics with assortative network formation, revealing an apparent phase transition between regimes in which one process or the other dominates the dynamics.
II Model definition
Consider a network of vertices, representing individuals, joined in pairs by edges, representing acquaintance between individuals111 Although acquaintance networks are typically simple graphs, with multiedges and self-edges disallowed, we have in the interest of simplicity, allowed multiedges and self-edges in our calculation. Since these form only a small fraction of all edges, we expect that our results would change little if we were to remove them.. Each individual is assumed to hold one of possible opinions on some topic of interest. The opinion of individual is denoted . In the past, researchers have considered both cases where is a fixed small number, such as a choice between candidates in an election cas:vot ; sood:vot ; sznajd , and cases in which the number of possible opinions is essentially unlimited deuff:opi , so that can be arbitrarily large. An example of the latter might be religious belief (or lack of it)—the number of subtly different religious beliefs appears to be limited only by the number of people available to hold them.
The case of fixed small has relatively simple behavior compared to the case of arbitrarily large , and so it is on the latter that we focus here. We will assume that the number of possible opinions scales in proportion to the number of individuals, and parameterize this proportionality by the ratio . (It is possible that not all opinions will end up existing in the population. Our model allows for some opinions to become extinct as the dynamics evolves, so that the final number of distinct opinions may be less than .)
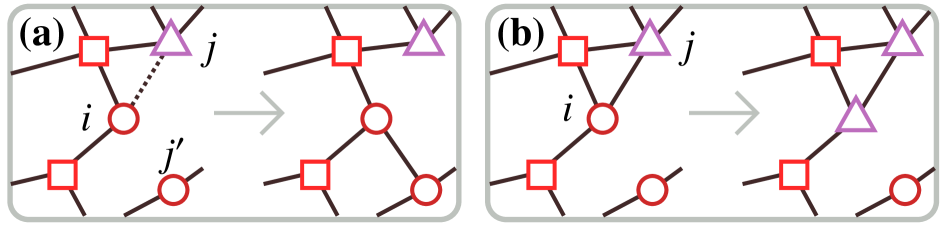
The edges of the network are initially placed uniformly at random between vertex pairs, and opinions are assigned to vertices uniformly at random. We then study by computer simulation a dynamics in which on each step of the simulation we either move an edge to lie between two individuals whose opinions agree, or we change the opinion of an individual to agree with one of their neighbors. To be specific, on each step we do the following (see Fig. 1).
-
1.
Pick a vertex at random. If the degree of that vertex is zero, do nothing. Otherwise, with probability , select at random one of the edges attached to and move the other end of that edge to a vertex chosen randomly from the set of all vertices having opinion .
-
2.
Otherwise (i.e., with probability ) pick a random neighbor of and set equal to .
Step 1 represents the formation of new acquaintances between people of similar opinions. Step 2 represents the influence of acquaintances on one another, opinions becoming similar as a result of acquaintance.
Note that both the total number of edges in our network and the total number of possible opinions are fixed. In the limit of large system size, the model thus has three parameters: the average degree , the mean number of people holding an opinion , and the parameter . In our studies, we primarily keep the first two of these parameters fixed and ask what happens as we vary the third.
III Phases and critical scaling of community sizes
The expected qualitative behavior of the model is clear. Since both of our update moves tend to decrease the number of nearest-neighbor vertex pairs with different opinions, we should ultimately reach a state in which the network is divided into a set of separate components, disconnected from one another, with all members of a component holding the same opinion. That is, the model segregates into a set of communities such that no individual has any acquaintances with whom they disagree. We call this the consensus state. Furthermore, once we reach consensus, all moves in the model involve the random rearrangement of edges within components, and hence, in the limit of long time, the components become random graphs with uniform uncorrelated arrangements of their edges.
The primary interest in our model therefore is in the number and sizes of the communities that form and in the dynamics of the model as it comes to consensus. Let us consider the distribution of the sizes of the consensus communities. In the limit , only updates that move edges are allowed and hence the consensus state is one in which the communities consist of the sets of initial holders of the individual opinions. Since the initial assignment of opinions is random, the sizes of these sets follow the multinomial distribution, or the Poisson distribution with mean in the limit of large . Conversely, in the limit , only changes of opinion are allowed and not edge moves, which means that the communities correspond to the initial components in the graph, which are simply the components of a random graph. Assuming we are in the regime in which a giant component exists in the random graph, we will then have one giant (extensive) community and an exponential distribution of small communities. Thus, in varying we go from a situation in which we have only small communities with constant average size to one in which we have a giant community plus a set of small ones.
This is the classic behavior seen in a system undergoing a continuous phase transition and it leads us to conjecture that our model displays a phase transition with decreasing at which a giant community of like-minded individuals forms. In other words, there is a transition between a regime in which the population holds a broad variety of views and one in which most people believe the same thing. We now offer a variety of further evidence to support this conjecture. (Phase transition behavior is also seen in some models of opinion formation on static networks, such as the model of Ref. cc:axe , although the mechanisms at work appear to be different from those considered here.)
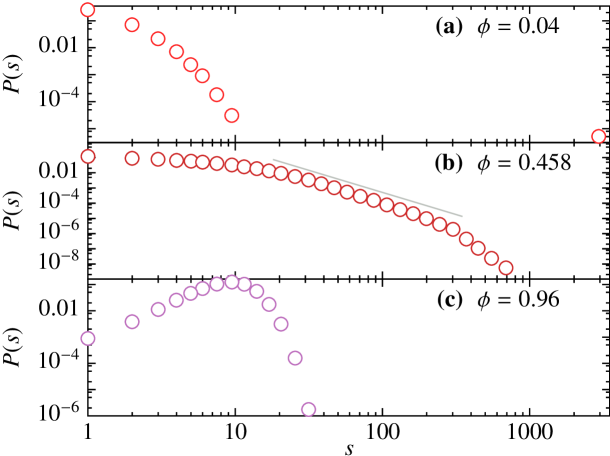
In Fig. 2 we show plots of from simulations of our model for and . As the figure shows, we do indeed see a qualitative change from a regime with no giant community to one with a giant community. At an intermediate value of around we find a distribution of community sizes that appears to follow a power law over a significant part of its range, another typical signature of criticality. The exponent of the power law is measured to be , which is incompatible with the value of the corresponding exponent for the phase transition at which a giant component forms in a random graph (a transition which belongs to the mean-field percolation universality class).
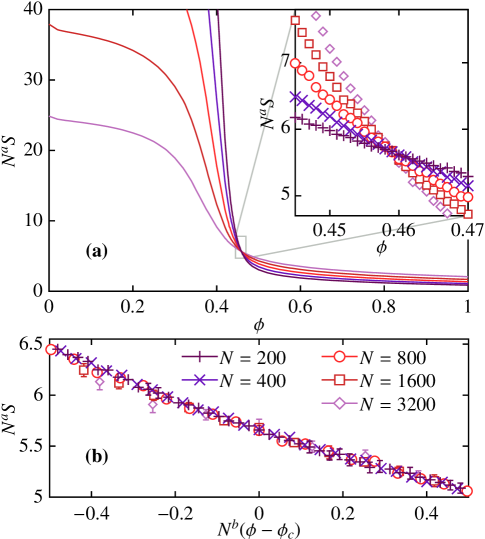
To further investigate our transition, we perform a finite size scaling analysis in the critical region. To do this, we need first to choose an order parameter for the model. The obvious choice is the size of the largest community in the consensus state as a fraction of system size. The arguments above suggest that this quantity should be of size for values of above the phase transition (and hence zero in the thermodynamic limit) and below it. We assume a scaling relation of the form
| (1) |
where is the critical value of (which is presumably a function of and ), is a universal scaling function (bounded as its argument tends to ), and and are critical exponents. To estimate we plot against and tune such that the results for simulations at different but fixed and cross at a single point, which is the critical point. Such a plot for and is shown in Fig. 3(a). With we obtain a unique crossing point at , which agrees well with the previous rough estimate of from Fig. 2.
Using this value we can now determine the exponent by plotting against . Since is a universal function, we should, for the correct choice of , find a data collapse in the critical region. In Fig. 3(b) we show that such a data collapse does indeed occur for .
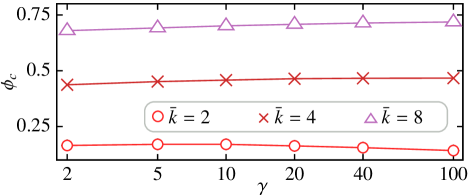
We have performed similar finite size scaling analyses for a variety of other points in the parameter space and, as we would expect, we find that the position of the phase transition varies—see Fig. 4—but that good scaling collapses exist at all parameter values for values of the critical exponents consistent with the values and found above.
Despite the qualitative similarities between the present phase transition and the percolation transition, our exponent values for and show that the two transitions are in different universality classes: the corresponding exponents for random graph percolation are , which are incompatible with the values measured above.
IV Dynamical critical behavior
Our model differs from percolation in another important respect also: percolation is a static, geometric phase transition, whereas the present model is fundamentally dynamic, the consensus arising as the limiting fixed point of a converging non-equilibrium dynamics. It is interesting therefore to explore the way in which our model approaches consensus.
In previous studies of opinion formation models of this type on fixed networks a key quantity of interest is the average convergence time , which is the number of updates per vertex needed to reach consensus. If then is known to scale as as system size becomes large sood:vot . In the opposite limit (), opinions are fixed and convergence to consensus involves moving edges one by one to fall between like-minded pairs of individuals. This is a standard sampling-with-replacement process in which the number of unsatisfied edges is expected to decay as for large times . Thus the time to reach a configuration in which is , and the convergence time is this quantity divided by the system size . For fixed average degree , this then implies that . This result is confirmed numerically in Fig. 5(a).
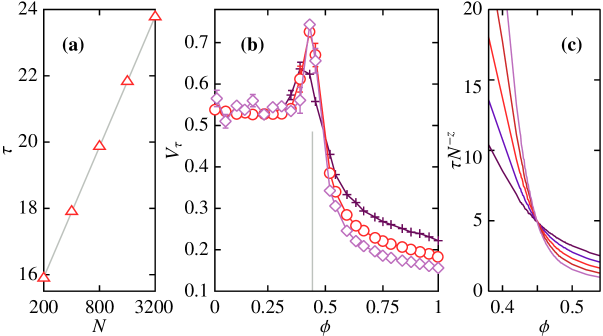
For close to , experience with other phase transitions leads us to expect critical fluctuations and critical slowing down in . Figure 5(b) shows that indeed there are large fluctuations in the convergence time in the critical region. The figure shows the value of the coefficient of variation of the consensus time (i.e., the ratio of the standard deviation of to its mean) as a function of and a clear peak is visible around . To characterize the critical slowing down we assume that takes the traditional scaling form at the critical point, where is a dynamical exponent katya:swxy . Figure 5(c) shows a plot of as a function of . If the system follows the expected scaling at then the resulting curves should cross at the critical point. Although good numerical results are considerably harder to obtain in this case than for the community sizes presented earlier, we find that the curves cross at a single point if and , the latter being consistent with our previous value of for the position of the phase transition.
V Summary and conclusions
To summarize, we have proposed a simple model for the simultaneous formation of opinions and social networks in a situation in which both adapt to the other. Our model contrasts with earlier models of opinion formation in which social structure is regarded as static and opinions are an outcome of that pre-existing structure cc:axe ; bik:fads ; arthur:contagion ; watts:fad ; our:fad2 . Our model is a dynamic, non-equilibrium model that reaches a consensus state in finite time on a finite network. The structure of the consensus state displays clear signatures of a continuous phase transition as the balance between the two processes of opinion change and network rewiring is varied. We have demonstrated a finite size scaling data collapse in the critical region around this phase transition, characterized by universal critical exponents independent of model parameters. The approach to the consensus state displays critical fluctuations in the time to reach consensus and critical slowing down associated with an additional dynamical exponent. The phase transition in the model is of particular interest in that it provides an example of a simple process in which a fundamental change in the social structure of the community can be produced by only a small change in the parameters of the system.
Finally, we note that for the specific example of opinion formation mentioned in the introduction—that of choice of religion—it is known that the sizes of the communities of adherents of religious sects are in fact distributed, roughly speaking, according to a power law ZM01 . This may be a signature of critical behavior in opinion formation, as displayed by the model described here, although other explanations, such as the Yule process Yule25 ; Simon55 , are also possible.
Acknowledgements.
The authors thank Paul Krapivsky and Claudio Castellano for helpful suggestions and comments. This work was supported in part by the Wenner-Gren Foundations (PH) and the National Science Foundation under grant number DMS–0234188 (MEJN).References
- (1) R. Albert and A.-L. Barabási. Statistical mechanics of complex networks. Rev. Mod. Phys, 74:47–98, 2002.
- (2) W. B. Arthur and D. A. Lane. Information contagion. Structural Change and Economic Dynamics, 4:81–104, 1993.
- (3) S. Bikhchandani, D. Hirshleifer, and I. Welch. A theory of fads, fashion, custom, and cultural change as information cascades. Journal of Political Economy, 100:992–1026, 1992.
- (4) M. Boguñá, R. Pastor-Satorras, A. Díaz-Guilera, and A. Arenas. Models of social networks based on social distance attachment. Phys. Rev. E, 70:056122, 2004.
- (5) C. Castellano, D. Vilone, and A. Vespignani. Incomplete ordering of the voter model on small-world networks. Europhys. Lett., 63:153–158, 2003.
- (6) G. Deffuant, F. Amblard, G. Weisbuch, and T. Faure. How can extremism prevail? A study based on the relative agreement interaction model. Journal of Artificial Societies and Social Simulation, 5:1, 2002.
- (7) S. N. Dorogovtsev and J. F. F. Mendes. Evolution of Networks: From Biological Nets to the Internet and WWW. Oxford University Press, Oxford, 2003.
- (8) A. Grönlund and P. Holme. A network based threshold model for the spreading of fads in society and markets. Advances in Complex Systems, 8:261–273, 2005.
- (9) T. M. Liggett. Interacting Particle Systems. Springer, New York, 1985.
- (10) C. Castellano, M. Marsili, and A. Vespignani, Nonequilibrium phase transition in a model for social influence. Phys. Rev. Lett., 85:3536–3539, 2000.
- (11) J. M. McPherson, L. Smith-Lovin, and J. Cook. Birds of a feather: Homophily in social networks. Ann. Rev. Sociol., 27:415–444, 2001.
- (12) K. Medvedyeva, P. Holme, P. Minnhagen, and B. J. Kim. Dynamic critical behavior of the XY model in small-world networks. Phys. Rev. E, 67:036118, 2003.
- (13) M. E. J. Newman. Mixing patterns in networks. Phys. Rev. E, 67:026126, 2003.
- (14) M. E. J. Newman. The structure and function of complex networks. SIAM Review, 45:167–256, 2003.
- (15) T. C. Schelling. Micromotives and Macrobehavior. W. W. Norton & Company, New York, 1978.
- (16) H. A. Simon. On a class of skewed distribution functions. Biometrika, 42:425–440, 1955.
- (17) B. Söderberg. General formalism for inhomogeneous random graphs. Phys. Rev. E, 66:066121, 2002.
- (18) V. Sood and S. Redner. Voter model on heterogeneous graphs. Phys. Rev. Lett., 94:178701, 2005.
- (19) K. Sznajd-Weron and J. Sznajd. Opinion evolution in closed community. Int. J. Mod. Phys. C, 11:1157–1165, 2000.
- (20) D. J. Watts. A simple model of global cascades on random networks. Proc. Natl. Acad. Sci. USA, 99:5766–5771, 2002.
- (21) G. U. Yule. A mathematical theory of evolution based on the conclusions of Dr. J. C. Willis. Trans. R. Soc. London B, 213:21–87, 1925.
- (22) D. H. Zanette and S. C. Manrubia. Vertical transmission of culture and the distribution of family names. Physica A, 295:1–8, 2001.