Hysteresis phenomenon in turbulent convection
Abstract
Coherent large-scale circulations of turbulent thermal convection in air have been studied experimentally in a rectangular box heated from below and cooled from above using Particle Image Velocimetry. The hysteresis phenomenon in turbulent convection was found by varying the temperature difference between the bottom and the top walls of the chamber (the Rayleigh number was changed within the range of ). The hysteresis loop comprises the one-cell and two-cells flow patterns while the aspect ratio is kept constant (). We found that the change of the sign of the degree of the anisotropy of turbulence was accompanied by the change of the flow pattern. The developed theory of coherent structures in turbulent convection (Elperin et al. 2002; 2005) is in agreement with the experimental observations. The observed coherent structures are superimposed on a small-scale turbulent convection. The redistribution of the turbulent heat flux plays a crucial role in the formation of coherent large-scale circulations in turbulent convection.
I Introduction
Coherent structures in turbulent convection are observed in the atmospheric convective boundary layers (see, e.g., Etling and Brown 1993; Atkinson and Wu Zhang 1996; Brümmer 1999) and in laboratory experiments (see, e.g., Krishnamurti and Howard 1981; Siggia 1994; Kadanoff 2001). In the atmospheric shear-free convection, the coherent structures represent large-scale three-dimensional long-lived Bénard-type cells (cloud cells) composed of narrow uprising plumes and wide downdraughts. They usually embrace the entire convective boundary layer (of the order of 1-3 km in height) and include pronounced convergence flow patterns close to the surface. In the sheared convective flows, the coherent structures represent convective boundary layer scale rolls (cloud streets) stretched along the mean wind (see, e.g., Etling and Brown 1993; Atkinson and Wu Zhang 1996; Brümmer 1999).
Buoyancy-driven structures, such as plumes, jets, and large-scale circulation patterns were observed in numerous laboratory experiments. The large-scale circulation caused by convection in the Rayleigh-Bénard apparatus is often called the ”mean wind” (see, e.g., Krishnamurti and Howard 1981; Zocchi et al. 1990; Ciliberto et al. 1996; Niemela et al. 2001; Sreenivasan et al. 2002; Niemela and Sreenivasan 2003; Burr et al. 2003; Shang et al. 2004; Xi et al. 2004; Tsuji et al. 2005; Brown et al. 2005, and references therein). There are several open questions concerning these flows, e.g., how do they arise, and what are their characteristics and dynamics.
The life-times of coherent structures are very long compared to the largest turbulent time-scales. Their spectral properties differ from those of small-scale turbulence. They are characterized by narrow spectra and do not exhibit the direct energy-cascade behavior (from larger to smaller scales). As a result the turbulence and the coherent structures interact in practically the same way as the turbulence and the mean flow. These structures show more similarity in their behavior with regular flows than with turbulence. They can be identified as the motions, whose spatial and temporal scales are much larger than the characteristic turbulent scales.
In spite of a number of theoretical and numerical studies (see, e.g., Busse and Whitehead 1971; 1974; Busse 1983; Lenschow and Stephens 1980; Hunt 1984; Hunt et al. 1988; Schmidt and Schumann 1989; Zilitinkevich 1991; Williams and Hacker 1992; 1993; Zilitinkevich et al. 1998; Young et al. 2002; Parodi et al. 2004, and references therein), the nature of large-scale coherent structures in turbulent convection is a subject of discussions. Hartlep et al. (2003) noted that there are two points of view on the origin of large-scale circulation in turbulent convection. ”According to one point of view, the rolls which develop at low Rayleigh numbers, , near the onset of convection continually increase their size as is increased and continue to exist in an average sense at even the highest Rayleigh numbers reached in the experiments (see, e.g., Fitzjarrald 1976). Another hypothesis holds that the large-scale circulation is a genuine high Rayleigh number effect (see, e.g., Krishnamurti and Howard 1981).”
The new mechanism of formation of the large-scale coherent structures in turbulent convection was proposed recently by Elperin et al. (2002; 2005). It was suggested that the redistribution of the turbulent heat flux plays a crucial role in the formation of the large-scale circulations in turbulent convection. In particular, two competitive effects, namely redistribution of the vertical turbulent heat flux due to convergence or divergence of the horizontal mean flows, and production of the horizontal component of the turbulent heat flux due to the interaction of the mean vorticity with the vertical component of the turbulent heat flux, cause the large-scale instability and formation of the large-scale coherent structures in turbulent convection (Elperin et al. 2002; 2005).
The main goal of this paper is to describe the experimental study of large-scale circulations of turbulent thermal convection in air flow (the aspect ratios ). In order to study large-scale circulations we used Particle Image Velocimetry to determine the turbulent and mean velocity fields, and a specially designed temperature probe with twelve sensitive thermocouples was employed to measure the temperature field. We found the hysteresis phenomenon in turbulent convection by varying the temperature difference between the bottom and the top walls of the chamber (the Rayleigh number was changed within the range of ). The hysteresis loop comprises the one-cell and two-cell flow patterns. We found that the change of the sign of the degree of the anisotropy of turbulence was accompanied by the change of the pattern of the mean wind. The developed theory of coherent structures in turbulent convection (Elperin et al. 2002; 2005) is in a good agreement with the experimental observations.
The hysteresis phenomenon in laminar convection was found by Busse (1967) who defined it as follows: ”The fact that the convection at a certain Rayleigh number depends on the way in which the Rayleigh number has been reached is called the hysteresis effect in laminar convection”. In the laminar convection the hexagon flow structures transform into rolls structures by increasing the Rayleigh number. On the other hand, decreasing the Rayleigh number causes the transition from the rolls structure to the hexagons. Similar phenomena were observed in numerical simulations and laboratory experiments (see, e.g., Busse 1978; Braunsfurth et al. 1996; Gelfgat et al. 1999, and references therein).
In the experiments by Willis et al. (1972) performed in air, water and a silicon oil for the Rayleigh numbers and large aspect ratios (for air ), it was demonstrated that the average dimensionless roll diameter, , increases as is increased. This observation was less pronounced for large Rayleigh number flows (for water and silicon oil). The hysteresis phenomenon was found in dependence for large Prandtl number flows (for water and silicon oil), but this phenomenon was not observed in the air flow (Willis et al. 1972). For considerably larger values of the Rayleigh numbers the convection patterns become very complicated (Willis et al. 1972) and turbulent convection arises. In the experiments by Fitzjarrald (1976) in air flow it was shown that in convection with large aspect ratios the predominant horizontal scale of the regular structures increased from at to at (where is the vertical distance between plates). In the range this scale did not change (Fitzjarrald 1976). Notably, the hysteresis phenomenon was not observed by Fitzjarrald (1976).
In the direct numerical simulations of convection by Hartlep et al. (2003) for the Rayleigh numbers , the Prandtl number and large aspect ratio () it was found that ”the typical size of the large-scale structures does not always vary monotonically as a function of , but broadly increases with increasing . It cannot be decided from these simulations whether the large-scale structures will eventually disappear at yet higher Rayleigh numbers.” Notably, the hysteresis phenomenon was not observed by Hartlep et al. (2003).
The paper is organized as follows. Section 2 discusses the physics of formation of the large-scale coherent structures, and Section 3 describes the experimental set-up for a laboratory study of this effect. The experimental results and their detailed analysis are presented in Section 4. Finally, conclusions are drawn in Section 5.
II Turbulent heat flux and coherent structures
Traditional theoretical models of the boundary-layer turbulence, such as the Kolmogorov-type local closures, imply the following assumptions. Fluid flows are decomposed into two components of principally different nature, organized mean flow and turbulent flow. Turbulent fluxes are proportional to the local mean gradients, whereas the proportionality coefficients (eddy viscosity, turbulent diffusivity) are uniquely determined by local turbulent parameters. For example, a widely used traditional approximation for the turbulent heat flux reads (see, e.g., Monin & Yaglom 1975), where is the turbulent thermal conductivity, is the mean entropy, and are fluctuations of the velocity and entropy, respectively.
The traditional form for the turbulent heat flux does not include the contribution from anisotropic velocity fluctuations. Actually the mean velocity gradients can directly affect the turbulent heat flux. The reason is that additional essentially anisotropic velocity fluctuations are generated by tangling the mean-velocity gradients with the Kolmogorov-type turbulence due to the influence of the inertial forces during the life time of large turbulent eddies. Therefore, the Kolmogorov turbulence supplies energy to the anisotropic (tangling) turbulence. In its turn the anisotropic turbulence causes formation of coherent structures due to the excitation of a large-scale instability (Elperin et al. 2002; 2005). Anisotropic velocity fluctuations were studied for the first time by Lumley (1967). He had shown that the velocity field in the presence of mean shear is strongly anisotropic and is characterized by a steeper spectrum than the Kolmogorov turbulence (see also Wyngaard and Cote 1972; Saddoughi et al. 1994; Ishihara et al. 2002; Yoshida et al. 2003, among others).
In order to parameterize the anisotropic turbulence, a spectral closure model was developed by Elperin et al. (2002; 2005). The derivation of the anisotropic turbulence model includes the following steps: applying the spectral closure, solving the equations for the second moments in the space, and returning to the physical space to obtain formulas for the Reynolds stresses and the turbulent heat flux. The derivation are based on the Navier-Stokes equation and the entropy evolution equation formulated in the Boussinesq approximation. This derivation yields the following expression for the turbulent flux of entropy :
| (1) |
(for details, see Elperin et al. 2002; 2005), where is the correlation time of the Kolmogorov turbulence corresponding to the maximum scale of turbulent motions, is the mean vorticity, is the mean velocity with the horizontal and vertical components, is the degree of thermal anisotropy, is the background turbulent heat flux,
| (2) |
is a generalized anisotropic turbulent heat conductivity tensor, is the ratio of specific heats and is the vertical unit vector. The equation for the tensor was derived in Appendix A in Elperin et al. (2002) using the budget equations for the turbulent kinetic energy, fluctuations of the entropy and the turbulent heat flux. The anisotropic part of the tensor (the second term in the square brackets) is caused by a modification of the turbulent heat flux by the buoyancy effects. The parameter is given by
| (3) |
where and are the horizontal and vertical scales in which the background turbulent heat flux tends to zero. The parameter describes the degree of thermal anisotropy. In particular, when the parameter and . For the parameter and . The maximum value of the parameter is given by for . The upper limit for the parameter arises because the function has a global maximum at . Thus, for the thermal structures have the form of columns or thermal jets , and for there exist the ‘’pancake” thermal structures in the background turbulent convection (i.e., a turbulent convection with a zero gradients of the mean velocity).
The terms in the square brackets in the right hand side of Eq. (1) are caused by the anisotropic turbulence and depend on the ”mean” (including coherent) velocity gradients. These terms lead to the excitation of large-scale instability and formation of coherent structures. In Eq. (1) the terms with zero divergence are omitted, because only contributes to the mean-field dynamics. Neglecting the anisotropic turbulence term this equation reduces to the traditional equation. The physical meaning of Eq. (1) is the following. The second term in Eq. (1) describes the redistribution of the vertical background turbulent heat flux by convergent (or divergent) horizontal mean flows. This redistribution of the vertical turbulent heat flux occurs during the life-time of turbulent eddies. The last term in Eq. (1) determines the formation of the horizontal turbulent heat flux due to ”rotation” of the vertical background turbulent heat flux by the perturbations of the horizontal mean vorticity. The emergence of the horizontal turbulent heat flux is caused by the action of the local inertial forces in inhomogeneous mean flows.
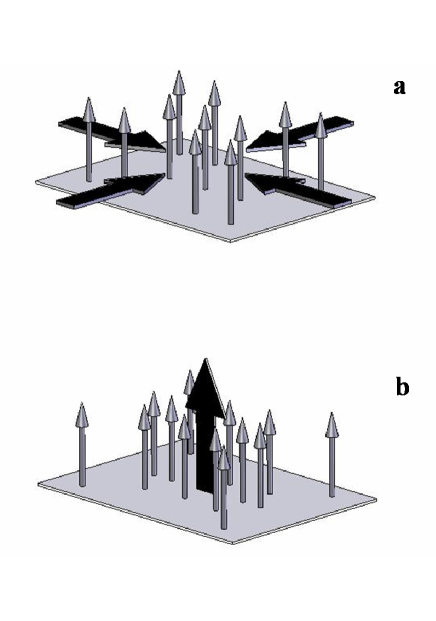
In the shear-free regime, the large-scale instability is related to the first term in square brackets in Eq. (1) for the turbulent flux of entropy. When , perturbations of the vertical velocity cause negative divergence of the horizontal velocity, (provided that This strengthens the local vertical turbulent flux of entropy and causes increase of the local ”mean” entropy and buoyancy (see Fig. 1). The latter enhances the local ”mean” vertical velocity . Thus a large-scale instability is excited. Similar reasoning is valid when , whereas . Then a negative perturbation of the vertical flux of entropy leads to a decrease of the ”mean” entropy and buoyancy, that enhances the downward flow and once again excites the instability. Therefore, nonzero causes redistribution of the vertical turbulent flux of entropy and formation of regions with large values of this flux. These regions (where ) alternate with the low-flux regions (where ). By this means large-scale coherent structures are formed.
The role of the second term in square brackets in Eq. (1) is to decrease the growth rate of the large-scale instability for . Indeed, the interaction of the ”mean” vorticity with the vertical flux of entropy produces the horizontal turbulent heat flux. The latter decreases (increases) the ”mean” entropy in the regions with upward (downward) local flows, thus diminishing the buoyancy forces and reducing the ”mean” vertical velocity and the ”mean” vorticity . This mechanism dampens the large-scale instability.
The above two competitive effects determine the growth rate of the large-scale instability. Perturbation analysis of the mean-field equations in the shear-free convection regime results in the following expression for the growth rate of long-wave perturbations:
| (4) |
(Elperin et al. 2002; 2005), where the parameter , is the maximum scale of turbulent motions, is the angle between the vertical unit vector and the wave vector of small perturbations, is acceleration of gravity. Equation (4) was derived for the case , where is the Brunt-Väisälä frequency. The large-scale instability occurs when This yields two ranges for the instability:
| (5) | |||
| (6) |
where we took into account that the parameter varies in the interval . The first range for the large-scale instability in Eq. (5) is for the angles (the ratio and the second range for the large-scale instability (see Eq. (6)) corresponds to the angles (the ratio where and is the horizontal component of the wave vector. The maximum growth rate of the large-scale instability is achieved at the scale of perturbations , where . The characteristic time of excitation of the large-scale instability is of the order of . Therefore, the typical length and time scales of these structures are much larger than the turbulence scales. This justifies the separation of scales assumption required for treating coherent structures as albeit complex but ”mean” flow. The growth rate of the large-scale instability depends also on the degree of anisotropy of turbulent velocity field. The detailed analysis of this facet is performed in Section 4 in order to explain the obtained experimental results.
III Experimental set-up
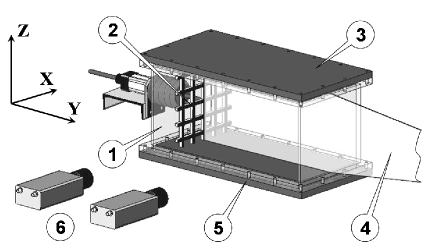
Now we describe the experimental study of large-scale circulations formed in turbulent convection. The experiments were conducted in a rectangular chamber with dimensions cm in air flow (see Fig. 2). The side walls of the chamber are made of transparent Perspex with the thickness of mm. A number of experiments were also conducted with different additional thermal insulation of the side walls of the chamber in order to study whether a heat flux through the side walls affects the turbulent convective pattern. First, the side walls of the chamber were insulated with Styrofoam plates with low thermal conductivity ( W/(m K)) and with the thickness of 30 mm. Two of the side plates were removed for a short time when the images of the flow were recorded. In the next series of experiments we installed additional Perspex plates with a thickness of 6 mm and with an air gap of 2 mm between these plates and the outside walls of the chamber. Finally, we performed experiments where these two types of thermal insulation were used simultaneously.
One vertically oriented stationary grid (with mm mesh and mm bars where bars are arranged in a square array) was attached to the left horizontal rod. This grid was positioned at a distance of one mesh size from the left wall of the chamber parallel to it. Hereafter, we use the following system of coordinates: is the vertical axis, the -axis is perpendicular to the grid and the -plane is parallel to the grid plane.
A vertical mean temperature gradient in the turbulent flow was formed by attaching two aluminium heat exchangers to the bottom and top walls of the test section (a heated bottom and a cooled top wall of the chamber). The thickness of the aluminium plates is 2.5 cm. The top plate is a bottom wall of the tank with cooling water. Temperature of water circulating through the tank and the chiller is kept constant within K. Cold water is pumped into the tank through two inlets and flows out through two outlets located at the side wall of the chamber. The bottom plate is attached to the electrical heater that provides constant and uniform heating. The voltage of a stable power supply applied to the heater varies in the range from 35 V to 200 V. The power of the heater varies in the range from 10 W to 300 W. The temperatures of the conducting plates were measured with two thermocouples attached at the surface of each plate. The temperature difference between the top and bottom plates, , varies in the range from 5 K to 80 K depending on the power of the heater (i.e., the Rayleigh number was changed within the range of ). The temperature in the probed region was measured with a specially designed temperature probe with twelve sensitive thermocouples. The temperature measurements showed that the thermal structure inside the large-scale circulation is inhomogeneous and anisotropic. The hot thermal plumes accumulate at one side of the large-scale circulation, and cold plumes concentrate at the opposite side of the large-scale circulation.
The velocity field was measured using a Particle Image Velocimetry (PIV), see Raffel et al. (1998). A digital PIV system with LaVision Flow Master III was used. A double-pulsed light sheet was provided by a Nd-YAG laser (Continuum Surelite mJ). The light sheet optics includes spherical and cylindrical Galilei telescopes with tuneable divergence and adjustable focus length. We used two progressive-scan 12 bit digital CCD cameras (with pixel size m m and pixels) with a dual-frame-technique for cross-correlation processing of captured images. A programmable Timing Unit (PC interface card) generated sequences of pulses to control the laser, camera and data acquisition rate. The software package LaVision DaVis 7 was applied to control all hardware components and for 32 bit image acquisition and visualization. This software package comprises PIV software for calculating the flow fields using cross-correlation analysis.
An incense smoke with sub-micron particles as a tracer was used for the PIV measurements. Smoke was produced by high temperature sublimation of solid incense particles. Analysis of smoke particles using a microscope (Nikon, Epiphot with an amplification of 560) and a PM-300 portable laser particulate analyzer showed that these particles have an approximately spherical shape and that their mean diameter is of the order of m. The probability density function of the particle size measured with the PM300 particulate analyzer was independent of the location in the flow for incense particle size of m.
Series of 130 pairs of images acquired with a frequency of 4 Hz were stored for calculating the velocity maps and for ensemble and spatial averaging of turbulence characteristics. The center of the probed flow region coincides with the center of the chamber. We measured the velocity field in the flow areas mm2 with a spatial resolution of m / pixel. These regions were analyzed with interrogation windows of pixels. A velocity vector was determined in every interrogation window, allowing us to construct a velocity map comprising vectors.
Mean and r.m.s. velocities, two-point correlation functions and an integral scale of turbulence were determined from the measured velocity fields. The mean and r.m.s. velocities for each point of the velocity map (1024 points) were determined by averaging over 130 independent maps. The two-point correlation functions of the velocity field were determined for each point of the central part of the velocity map ( vectors) by averaging over 130 independent velocity maps. An integral scale of turbulence was determined from the two-point correlation functions of the velocity field. These measurements were repeated for various temperature differences between the bottom and the top walls of the chamber. The size of the probed region did not affect our results. Similar experimental set-up and data processing procedure were used in experimental study by Eidelman et al. (2002; 2004) and Buchholz et al. (2004) of a new phenomenon of turbulent thermal diffusion (see Elperin et al. 1996; 1997; 2001).
The maximum tracer particle displacement in the experiment was of the order of pixels, i.e., of the interrogation window. The average displacement of tracer particles was of the order of pixels. Therefore, the average accuracy of the velocity measurements was of the order of for the accuracy of the correlation peak detection in the interrogation window of the order of pixels (see, e.g., Adrian 1991; Westerweel 1997; 2000).
IV Hysteresis phenomenon
In this Section we discuss the hysteresis phenomenon which was found in the turbulent convection by varying the temperature difference between the bottom and the top walls of the chamber within a range of to K (the Rayleigh number was changed within the range of ). The hysteresis loop comprises the two-cell and one-cell flow patterns while the aspect ratio of the chamber is kept constant. In particular, increasing the temperature difference from to K we observed first two-cell flow pattern with the downward motions in the central region of the chamber between two cells (Fig. 3a), then one-cell flow pattern within a range of the temperature difference of to K with the counterclockwise mean flow (Fig. 3b). Further increase of the temperature difference from to K results in two-cell flow pattern with the upward mean flow in the central region of the chamber between the two cells (Fig. 3c). Decreasing the temperature difference we observed two-cell flow pattern within a range from to K with the upward flow in the region between two cells (Fig. 4a), then one-cell flow pattern with clockwise mean flow within a range of the temperature difference of to K (Fig. 4b). Further decrease of the temperature difference from to K results in two-cell flow pattern with the downward mean flow in the central region of the chamber between the two cells (Fig. 4c).
During the transition from the two-cell to one-cell flow patterns, the direction of the mean flow in the one-cell pattern coincided with that of the right cell in the two-cell flow pattern. The latter may be caused by an asymmetry of the chamber due to the presence of the grid near the left wall. This grid introduces an additional anisotropy in the small-scale turbulent convection. In all experiments the transition from the two-cell to one-cell flow patterns was found to be accompanied by the change of the sign of the degree of anisotropy of turbulent velocity field, which is defined as
| (7) |
In particular, the dependence of the degree of anisotropy of turbulent velocity field on the Rayleigh number obtained in the experiment is shown in Fig. 5. The parameter was negative for the two-cell flow pattern and was positive for the one-cell flow pattern.
These experimental observations can be explained by invoking the theory of formation of coherent structures developed by Elperin et al. (2002; 2005). In particular, Fig. 6 shows the theoretical dependence of the growth rate of the large-scale instability versus the parameter for the one-cell and two-cell flow patterns. Note that the aspect ratio of the large-scale cell in the two-cell flow pattern observed in the experiment was approximately (see Figs. 3a; 3c; 4a; 4c), while in the one-cell flow pattern it was approximately (see Figs. 3b; 4b). The growth rate of the large-scale instability for the two-cell mode, , is larger than that for the one-cell mode, , for negative values of the degree of anisotropy of turbulent velocity field, and for positive values of the parameter . Figure 6 is plotted for the degree of thermal anisotropy .
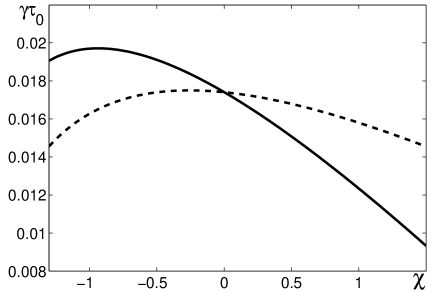
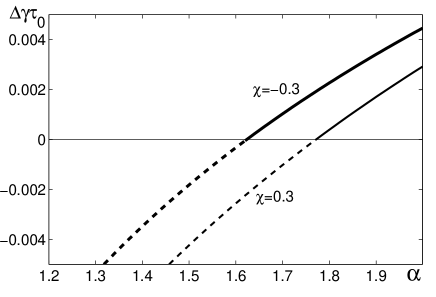
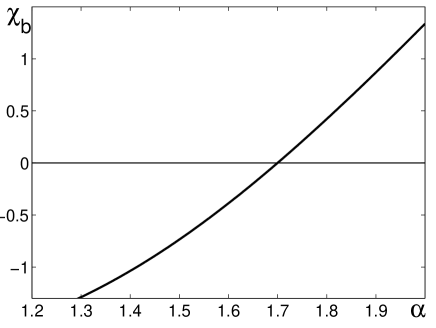
The difference of the growth rates of the large-scale instability for the two-cell and one-cell flow patterns versus the degree of thermal anisotropy is shown in Fig. 7. The range of parameters where , corresponds to the two-cell flow pattern, since in this range the growth rate of the excitation of the two-cell mode is larger than that of the one-cell mode. Accordingly, the range of parameters where , corresponds to the one-cell flow pattern, because in this range the growth rate of the excitation of the two-cell mode is smaller than that of the one-cell mode. Let us define the point for a given parameter where . The dependence of the bifurcation point versus the degree of thermal anisotropy is shown in Fig. 8. The value increases with the increase of the parameter .
Note that the range of the degree of thermal anisotropy when two kinds of flow patterns (the two-cell and one-cell flow patterns) can exist in the system is very narrow. For instance, when the parameter changes within the range between and (see Fig. 7). The latter theoretical prediction is in an agreement with the experimental observations. In particular, our preliminary measurements show that the degree of thermal anisotropy in the chamber in the experiments was of the order of . Therefore, the above discussion shows that the obtained experimental results are in a good agreement with the predictions of the theory of formation of coherent structures in turbulent convection (see Elperin et al. 2002; 2005).
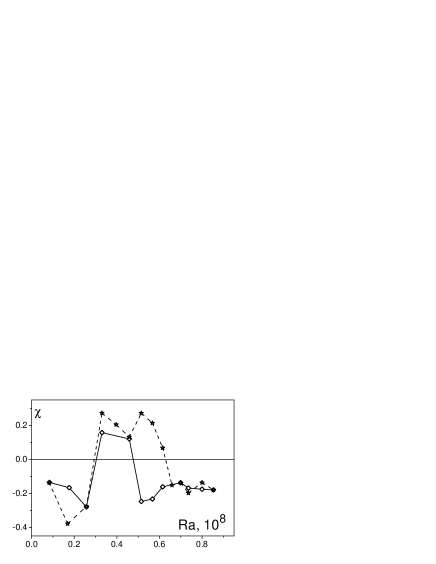
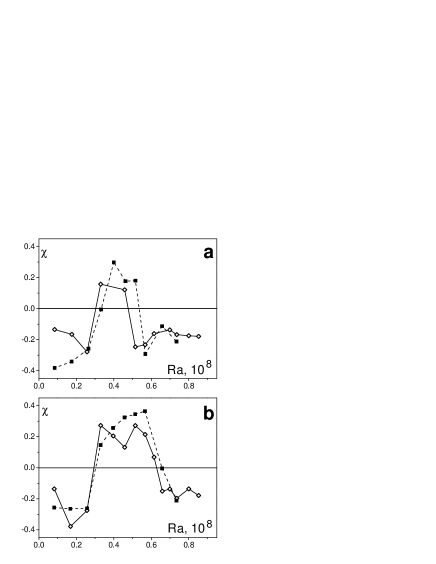
A number of experiments were also conducted with different additional thermal insulation of the side walls of the chamber in order to study whether a heat flux through the side walls affects the turbulent convective pattern. In particular, we plotted in Fig. 9 the degree of anisotropy of turbulent velocity field versus the Rayleigh number for the chamber with additional thermal insolation with Perspex plates (dashed line) and for the experiments without the additional thermal insolation (solid line) in the case of increase of the Rayleigh number (Fig. 9a) and during decrease of (Fig. 9b). The difference in the dependence was not essential, and the hysteresis phenomenon was observed in these experiments as well.
Notably, the vertical grid (see Fig. 2) which has been placed asymmetrically, introduces additional anisotropy in turbulent fluid flow in a chamber. Without this vertical grid the dynamics of flow patterns becomes more complicated. In particular, after a two-cell flow pattern at higher values of the Rayleigh number we often observed an additional transition to the one-cell flow pattern. However, we did observe the hysteresis phenomenon in this case. When we also changed the aspect ratio from to , the hysteresis phenomenon was observed as well.
V Conclusions
In the present study we demonstrated that the anisotropy of turbulent velocity field plays a crucial role in the hysteresis phenomenon that was found in our experiments in turbulent convection. The hysteresis loop comprises the two-cell and one-cell flow patterns while the aspect ratio of the chamber is kept constant. The observed transition from the two-cell to one-cell flow patterns causes a drastic change of the degree of anisotropy of the turbulent velocity field from negative to positive values. This finding is in a good agreement with the theoretical predictions. In particular, we found that there is a critical value of the degree of anisotropy of turbulent velocity field when the growth rate of the large-scale instability for the one-cell flow pattern is larger than that for the two-cell flow pattern. This critical value depends on the degree of thermal anisotropy. Transition through this critical value results in a bifurcation, i.e., it causes the transition from the two-cell to one-cell flow patterns. Then further increase of the temperature difference between the bottom and the top walls of the chamber decreases the degree of anisotropy , and the system passes again through the bifurcation from one-cell to two-cell flow patterns. Decreasing the temperature difference causes these bifurcations but for different values of the temperature difference. Therefore, we observed the hysteresis phenomenon in turbulent convection. The developed theory of coherent large-scale circulations in turbulent convection (Elperin et al. 2002; 2005) is in a good agreement with the experimental observations.
Note that the nonlinear dynamics may play a very essential role in the observed transitions between one-cell flow pattern to the two-cell flow pattern (and vice versa) when we change the values of the Rayleigh numbers. After parametrization of the turbulence the nonlinear mean-field equations determine the dynamics of modes (flow patterns). In our experiments with we have a two-mode system (one-cell and two-cell modes), and nonlinear interactions between the modes play a very essential role. Experiments and numerical simulations with large aspect ratios (Willis et al. 1972; Fitzjarrald 1976; Hartlep et al. 2003) can be regarded as a multi-mode system, which may be strongly different from the two-mode system.
The obtained results might be important in atmospheric turbulent convection (see, e.g., Zilitinkevich 1991; Etling and Brown 1993; Atkinson and Wu Zhang 1996; Brümmer 1999) and industrial turbulent flows (see, e.g., Kakac et al. 1987; Incropera and DeWitt 2002).
Acknowledgements.
The authors benefited from stimulating discussions with F. Busse, S. Grossmann, S. Morris, A. Tsinober, X.Q. Xia and V. Yakhot. We thank A. Krein for his assistance in construction of the experimental set-up and performing the experiments. We also thank I. Golubev for his assistance in processing the experimental data. This work was partially supported by the German-Israeli Project Cooperation (DIP) administrated by the Federal Ministry for Education and Research (BMBF) and by the Israel Science Foundation governed by the Israeli Academy of Science.References
- (1) Adrian RJ (1991) Particle imaging techniques for experimental fluid mechanics. Ann Rev Fluid Mech 23: 261-304
- (2) Atkinson BW; Wu Zhang J (1996) Mesoscale shallow convection in the atmosphere. Rev Geophys 34: 403-431
- (3) Braunsfurth MG; Mullin T (1996) An experimental study of oscillatory convection in liquid gallium. J Fluid Mech 327: 199-219
- (4) Brown E; Nikolaenko A; Ahlers G (2005) Orientation changes of the large-scale circulation in turbulent Rayleigh-Bénard convection, Phys Rev Lett 95: 084503 (1-4)
- (5) Brümmer B (1999) Roll and cell convection in winter-time arctic cold-air outbreaks. J Atmosph Sci 56: 2613-2636
- (6) Buchholz J; Eidelman A; Elperin T; Grünefeld G; Kleeorin N; Krein A; Rogachevskii I (2004) Experimental study of turbulent thermal diffusion in oscillating grids turbulence. Exp Fluids 36: 879-887
- (7) Burr U; Kinzelbach W; Tsinober A (2003) Is the turbulent wind in convective flows driven by fluctuations? Phys Fluids 15: 2313-2320
- (8) Busse FH (1967) The stability of finite amplitude cellular convection and its relation to an extremum principle. J Fluid Mech 30: 625-649
- (9) Busse FH (1978) Non-linear properties of thermal convection. Rep Prog Phys 41: 1929-1967
- (10) Busse FH and Whitehead JA (1971) Instabilities of convective rolls in a high Prandtl number fluid. J Fluid Mech 47: 305-320
- (11) Busse FH and Whitehead JA (1974) Oscillatory and collective instabilities rolls in large Reynolds number convection. J Fluid Mech 66: 67-79
- (12) Busse FH (1983) Generation of mean flows by thermal convection. Physica D 9: 287-299
- (13) Ciliberto S; Cioni S; Laroche C (1996) Large-scale flow properties of turbulent thermal convection. Phys Rev E 54: R5901-R5904
- (14) Eidelman A; Elperin T; Kapusta A; Kleeorin N; Krein A; Rogachevskii I (2002) Oscillating grids turbulence generator for turbulent transport studies. Nonlinear Proc Geoph 9: 201-205
- (15) Eidelman A; Elperin T; Kleeorin N; Krein A; Rogachevskii I; Buchholz J; Grünefeld G (2004) Turbulent thermal diffusion of aerosols in geophysics and in laboratory experiments. Nonlinear Proc Geoph 11: 343-350
- (16) Elperin T; Kleeorin N; Rogachevskii I (1996) Turbulent thermal diffision of small inertial particles. Phys Rev Lett 76: 224-228
- (17) Elperin T; Kleeorin N; Rogachevskii I (1997) Turbulent barodiffusion, turbulent thermal diffusion and large-scale instability in gases. Phys Rev E 55: 2713-2721
- (18) Elperin T; Kleeorin N; Rogachevskii I; Sokoloff D (2001) Mean-field theory for a passive scalar advected by a turbulent velocity field with a random renewal time. Phys Rev E 64: 026304 (1-9)
- (19) Elperin T; Kleeorin N; Rogachevskii I; Zilitinkevich S (2002) Formation of large-scale semiorganized structures in turbulent convection. Phys Rev E 66: 066305 (1-15)
- (20) Elperin T; Kleeorin N; Rogachevskii I; Zilitinkevich S (2005) Tangling turbulence and semi-organized structures in convective boundary layers. Boundary-Layer Meteorol, accepted
- (21) Etling D; Brown RA (1993) Roll vortices in the planetary boundary layer: a review. Boundary-Layer Meteorol 65: 215-248
- (22) Fitzjarrald DE (1976) An experimental study of turbulent convection in air. J Fluid Mech 73: 693-719
- (23) Gelfgat AYu; Bar-Yoseph PZ; Yarin AL (1999) Stability of multiple steady states of convection in laterally heated cavities. J Fluid Mech 388: 315-334
- (24) Hartlep T; Tilgner A; and Busse FH (2003) Large-scale structures in Rayleigh-Benard convection at high Rayleigh numbers. Phys Rev Lett 91: 064501 (1-4)
- (25) Hunt JCR (1984) Turbulence structure in thermal convection and shear-free boundary layers. J Fluid Mech 138: 161-184
- (26) Hunt JCR; Kaimal JC; Gaynor JI (1988) Eddy structure in the convective boundary layer - new measurements and new concepts. Quart J Roy Meteorol Soc 114: 837-858
- (27) Incropera FP; DeWitt DP (2002) Fundamentals of Heat and Mass Transfer. New York
- (28) Ishihara T; Yoshida K; Kaneda Y (2002) Anisotropic velocity correlation spectrum at small scales in a homogeneous turbulent shear flow. Phys. Rev. Lett. 88: 154501 (1-4)
- (29) Kadanoff LP (2001) Turbulent heat flow: structures and scaling. Phys. Today 54: 34-38
- (30) Kakac S; Ramesh SK; Aung W (1987) Handbook of Single-Phase Convective Heat Transfer. New York
- (31) Krishnamurti R; Howard LN (1981) Large-scale flow generation in turbulent convection. Proc Natl Acad Sci USA 78: 1981-1985
- (32) Lenschow DH; Stephens PL (1980) The role of thermals in the convective boundary layer. Boundary-Layer Meteorol. 19: 509-532
- (33) Lumley JL (1967) Rational approach to relations between motions of different scales in turbulent flows. Phys Fluids 10: 1405-1408
- (34) Monin AS; Yaglom AM (1975) Statistical Fluid Mechanics. Cambridge, Massachusetts, MIT Press. Vol. 2
- (35) Niemela JJ; Skrbek L; Sreenivasan KR; Donnelly RJ (2001) The wind in confined thermal convection. J Fluid Mech 449: 169-178
- (36) Niemela JJ; Sreenivasan KR (2003) Rayleigh-number evolution of large-scale coherent motion in turbulent convection. Europhys Lett 62: 829-833
- (37) Parodi A; von Hardenberg J; Passoni G; Provenzale A; Spiegel EA (2004) Clustering of plumes in turbulent convection. Phys Rev Lett 92: 194503 (1-4)
- (38) Raffel M; Willert C; Kompenhans J (1998) Particle Image Velocimetry. Springer
- (39) Saddoughi SG; Veeravalli SV (1994) Local isotropy in turbulent boundary layers at high Reynolds number. J Fluid Mech 268: 333-347
- (40) Schmidt H; Schumann U (1989) Coherent structure in the convective boundary layer derived from large-eddy simulations. J Fluid Mech 200: 511-562
- (41) Siggia ED (1994) High Rayleigh number convection. Annu Rev Fluid Mech 26: 137-168
- (42) Shang XD; Qiu XL; Tong P; Xia XQ (2004) Measurements of the local convective heat flux in turbulent Rayleigh-Benard convection. Phys Rev E 70: 026308 (1-13)
- (43) Sreenivasan KR; Bershadskii A; Niemela JJ (2002) Mean wind and its reversal in thermal convection. Phys Rev E 65: 056306 (1-11)
- (44) Tsuji Y; Mizuno T; Mashiko T; Sano M (2005) Mean wind in convective turbulence of Mercury. Phys Rev Lett 94: 034501 (1-4)
- (45) Westerweel J (1997) Fundamentals of digital particle image velocimetry. Measurem Sci Technology 8: 1379-1392
- (46) Westerweel J (2000) Theoretical analysis of the measurement precision of particle image velocimetry. Exp Fluids Suppl 29: S3-S12
- (47) Williams AG; Hacker JM (1992) The composite shape and structure of coherent eddies in the convective boundary layer. Boundary-Layer Meteorol 61: 213-245
- (48) Williams AG; Hacker JM (1993) Interaction between coherent eddies in the lower convective boundary layer. Boundary-Layer Meteorol 64: 55-74
- (49) Willis GE; Deardorff JW; Somerville RCJ (1972) Roll-diameter dependence in Rayleigh convection and its effect upon the heat flux. J Fluid Mech 54: 351-367
- (50) Wyngaard JC; Cote OR (1972) Cospectral similarity in the atmospheric surface layer. Quart J Royal Meteorol Soc 98: 590-602
- (51) Xi HD; Lam S; Xia XQ (2004) From laminar plumes to organized flows: the onset of large-scale circulation in turbulent thermal convection. J Fluid Mech 503: 47-56
- (52) Young GS; Kristovich DAR; Hjelmfelt MR; Foster RC (2002) Rolls, streets, waves and more. Bull Amer Meteorol Soc 83: 997-1001
- (53) Yoshida K; Ishihara T; Kaneda Y (2003) Anisotropic spectrum of homogeneous turbulent shear flow in a Lagrangian renormalized approximation. Phys Fluids 15: 2385-2397
- (54) Zilitinkevich SS (1991) Turbulent Penetrative Convection, Avebury Technical, Aldershot
- (55) Zilitinkevich SS; Grachev A; Hunt JCR (1998) Surface frictional processes and non-local heat/mass transfer in the shear-free convective boundary layer. In Plate et al. (eds.), Buoyant convection in geophysical flows. Kluwer Academic Publications, Dordrecht, The Netherlands, 83-113
- (56) Zocchi G; Moses E; Libchaber A (1990) Coherent structures in turbulent convection. Physica A 166: 387-407