Interplay between HIV/AIDS Epidemics and Demographic Structures Based on Sexual Contact Networks
Abstract
In this article, we propose a network spread model for HIV epidemics, wherein each individual is represented by a node of the transmission network and the edges are the connections between individuals along which the infection may spread. The sexual activity of each individual, measured by its degree, is not homogeneous but obeys a power-law distribution. Due to the heterogeneity of activity, the infection can persistently exist at a very low prevalence, which has been observed in real data but can not be illuminated by previous models with homogeneous mixing hypothesis. Furthermore, the model displays a clear picture of hierarchical spread: In the early stage the infection is adhered to these high-risk persons, and then, diffuses toward low-risk population. The prediction results show that the development of epidemics can be roughly categorized into three patterns for different countries, and the pattern of a given country is mainly determined by the average sex-activity and transmission probability per sexual partner. In most cases, the effect of HIV epidemics on demographic structure is very small. However, for some extremely countries, like Botswana, the number of sex-active people can be depressed to nearly a half by AIDS.
keywords:
HIV/AIDS epidemics, Scale-free networks, Mathematical modeling, Demography.PACS:
89.75.-k, 87.23.Ge, 05.70.Ln1 Introduction
AIDS (Acquired Immure Deficiency Syndrome), as one of the most dangerous diseases over human history, has been continuously spreading at an enormous speed with an extremely high rate of death (from the moment when the first infection case was confirmed). Now it has already spread to all the regions of the world and been a great threat not only to the human health but also to the human society due to its own epidemiologic characters which make the objection to AIDS an extremely complex and difficult task to address.
A high infection rate of population will cause catastrophe to the development of national economy for two reasons. On one hand, most infected people are in a group aged from 24 to 45 who do the main contributions to the country’s productivity, thus the AIDS will cause a great decline of the social wealth. On the other hand, to carry out a widely covered treatment program on treating the HIV infected people will be a heavy burden for the government finance due to the great cost on expensive medicine as well as regularly and continuously implemented therapy. Therefore, to investigate the edpidemic behaviors of HIV/AIDS appears not only of great theoretical interest in understanding the underlying spreading mechanism, but also necessary and urgent in practice.
The extensively investigated models for epidemics, such as the standard susceptible-infected-removed (SIR) and susceptible-infected-susceptible (SIS) models, often involve two hypotheses [1, 2, 3, 4]. First, the population is assumed closed, that is, the population size is fixed. However, recent researches on the spread of HIV (especially in Africa and other worst-afflicted areas) indicate the existence of strongly interplay between HIV epidemics and age structures, thus the demographic impact can not be neglected (see the review papers [5, 6] and the references therein). Secondly, the epidemiological models are often established based on perfect and homogeneous mixing, that is to say, all individuals are able to infect all others and the infectivity of each individual is almost the same. To replace the perfect mixing assumption, one can introduce the epidemic contact network, wherein the nodes denote individuals and edges represent the connections between individuals along which the infection may spread (see the review papers [7, 8] about network epidemics and the references therein). The infected individual can infect a susceptible one only if they are neighboring in the network. The homogeneous mixing assumption can be implemented by using epidemic contact networks with homogeneous degree distributions [9], such as regular lattices, random networks [10], and so on. However, recent empirical data exhibit us that the real-world sexual contact patterns are far different from the homogeneous ones [11, 12, 13]. The corresponding networks, similar to many other real-life networks, display the so-called scale-free property [14, 15], that is, they are of power-law degree distributions. This power-law distribution falls off much more gradually than an exponential one, allowing a few nodes of very large degree to exist. These high-degree nodes are called hub nodes in network science [15, 16, 17, 18] and superspreaders in epidemiological literatures [19, 20]. Recent theoretical researches on epidemics show that the topology of epidemic contact networks will highly affect the dynamical behaviors [21, 22], and it is also demonstrated that the effect of the superspreaders on HIV epidemics can not be ignored [23, 24]. Therefore, the structural effect should be taken into account when modeling HIV/AIDS epidemics. In addition, the introduction of Antiretroviral (ARV) drug therapy is also one of the important result-dependent factors [25, 26]. No treatment is more efficient for HIV-infected individuals than the medicine, which combines two or three antiretroviral drugs in ”cocktail” regimens. These regimens, known as highly active ARV therapy, have resulted in the reduction of HIV levels in the blood, often to undetectable levels, and have markedly improved immune function of HIV-infected individuals. The advent and widespread application of ARV has dramatically changed the typical course of HIV infection and AIDS, especially in high-income countries [27]. On the other hand, however, in the low-income countries, the overwhelming proportion of HIV-infected persons has no access to ARV. In sub-Saharan Africa, for example, this lack of treatment access has transformed into rapidly escalating death rates. Although the usage of ARV appears effective in bating HIV, it will bring too heavy pressure in economy for poor countries. Therefore, the better understanding of the effect of ARV treatment may enlighten readers in allocating the financial resources.
Although the demographic structure [28, 29] and sexual contact pattern [30, 31], respectively, has been taken into account in the previous HIV/AIDS epidemic models, there are few works simultaneously consider these two ingredients. In the present model, both the demographic impact and heterogeneity mixing effect are considered. And many important features of real-life HIV epidemics can be naturally generated by combining these two ingredients. This article is organized as follows: In section 2, the model is presented in details. In section 3, the main properties of this model are shown. Then, in section 4, we will try to predict the HIV/AIDS epidemics by this model. Finally, we sum up this article and discuss the relevance of this model to the real world in section 5.
2 Model
2.1 Construction of Epidemic Contact Networks
The HIV is transmitted by body fluid through several main routes including sexual contacts, sharing injectors among drug users, perinatal transmissions, transfusion of contaminated blood products etc., which are closely related to human beings’ social activities. In different regions the popularity of each route is variable according to the culture and social circumstance. In some areas the homosexual contacts and injecting drug use play the main role in HIV epidemics, while the main track in HIV transmission is the heterosexual contacts in the global scope [32]. Therefore, in this model, only the heterosexual relationships are taken into account, thus the corresponding epidemic contact networks are bipartite graphs [33, 34].
The epidemic contact network starts with males and females, each of which is sex-active with age between 15 and 49, and only the heterosexual contacts are permissive. Since men tend to over-report their number of partners whereas women tend to under-report, the total numbers of sexual partners of males and females are not equal in existing surveys [11, 29]. However, for simplification, we assume the degree distribution for both male and female nodes are the same. Assign each male node’s degree according to a given degree distribution with minimal degree . According to the empirical data in Sweden [11], we set . After obtaining the degree sequence of male nodes, we let the female nodes have the same degree sequence and randomly assign each female node’s degree according to this sequence. Here the degree sequence means a set of all nodes’ degrees, one can find a more detailed and strict definition in ref. [35]. The edges are generated randomly by using the mechanism of configuration model [36]. Note that, different from most previous studies about epidemics on static networks, the present network structure evolves with time according to some followed rules of HIV epidemic dynamics.
2.2 Modelling spread of HIV/AIDS in networks
We focus on the network susceptible-infected-removed (SIR) model in which individuals can be in three discrete states, susceptible, infected or removed (dead). The infected ones can be divided into two subclasses: The HIV-positive individuals and persons with AIDS. Since the median time from AIDS to death is very short (about 7 month for adults [37]) compared with the median incubation time for AIDS [38], we assume that when an HIV-positive person becomes an AIDS-patient, she or he will immediately be in death (i. e. within one year). This model is implemented by computer simulation with a time step equal to one year when mimicking the reality. The simulation processes are as follows.
(1) Set all the nodes to be susceptible except one randomly selected infected one.
(2) At each time step for each susceptible node , denote and the number of its neighboring infected nodes not in process of ARV treatment (non-ARV user) or contrary (ARV user), respectively. The probability that the node will become infected in the next time step is
| (1) |
if is male. Here is the transmission probability per sexual partner, which is considered as a more appropriate estimate than probability per sexual act [39], and the subscript represents whether the corresponding HIV-positive person has taken the ARV treatment. Since the male-to-female transmission is about twice efficient as female-to-male transmission [40], if is female, the corresponding probability is
| (2) |
where and are restricted below 0.5. It has been estimated by an analysis of longitudinal cohort data that antiretroviral therapy reduces per-partnership infectivity by as much as 60% [27], thus we set .
(3) At each time step, each infected node (except the newly infected ones) may die with probability either (for non-ARV user) or (for ARV user). According to the recent estimations [41], we set and . The dead individuals are removed from the population.
Repeat these processes for desired time. Note that, each newly infected node will be ARV user at probability , and all the existing ARV users will keep using ARV.
2.3 Demographic Impact
In this model, all the nodes (sex-active persons) are divided into 7 age-groups (labeled A1-A7): 15-19, 20-24, 25-29, 30-34, 35-39, 40-44, 45-49. At beginning, each node chooses to be in one age-group with probability according to the age structure in the year corresponding to time step zero. At each time step, each female individual may bear a child according the corresponding age-specific fertility rates. If she is infected and has not taken ARV treatment, the perinatal transmission probability is . And it reduces to if ARV treatment is taken. Based on some previous empirical studies [28, 42], we set and . The infected elder persons ( year) may die with probability or during each time step, and the corresponding probability for perinatally infected children is 0.2 [42].
At the end of each time step, 1/5 randomly selected living persons in age-group A1-A6 will reach the elder group, and 1/5 randomly selected living persons in group A7 will be removed from this system. If the time step is less than 15, we simply assume equal number (to the number of removal nodes in A1) of susceptible individuals will be added to group A1; else if , individuals will be added to group A1, where denotes the number of newborn babies without HIV at time . Here we simply assume all the infected babies will die before 15 years old since the mortality per year for them is much higher than adults. All these newly added ones will joint the epidemic contact network according to the rules of Section 2.1, that is, the female/male nodes will randomly choose sexual partners among all the young and old men/women according to their given degrees that obey the distribution .
See the Appendix A for the source of all the population and demographic data.
3 Main Properties
There are three free parameters in the present model: the average degree which determine the degree distribution when the power-law exponent is given, the transmission probability , and the ARV-receiving rate . The former two parameters are relative to the behaviors while the last one is partially dependent on financial conditions. In this section, we will show some simulation results and investigate the main properties about this model by adjusting the above parameters. Some previous works show that for most cases, the qualitative features of epidemic dynamics will not be affected by the slightly varying of population size and age-structure [5, 28, 29, 43], thus in this section, the age-specific fertility rates are kept unchanged. We use the age-density and age-specific fertility rates of China in 2005 for initialization, with the age-specific fertility rates unchanged all through. The network size is .

3.1 Effect of the Heterogeneous Degree Distribution
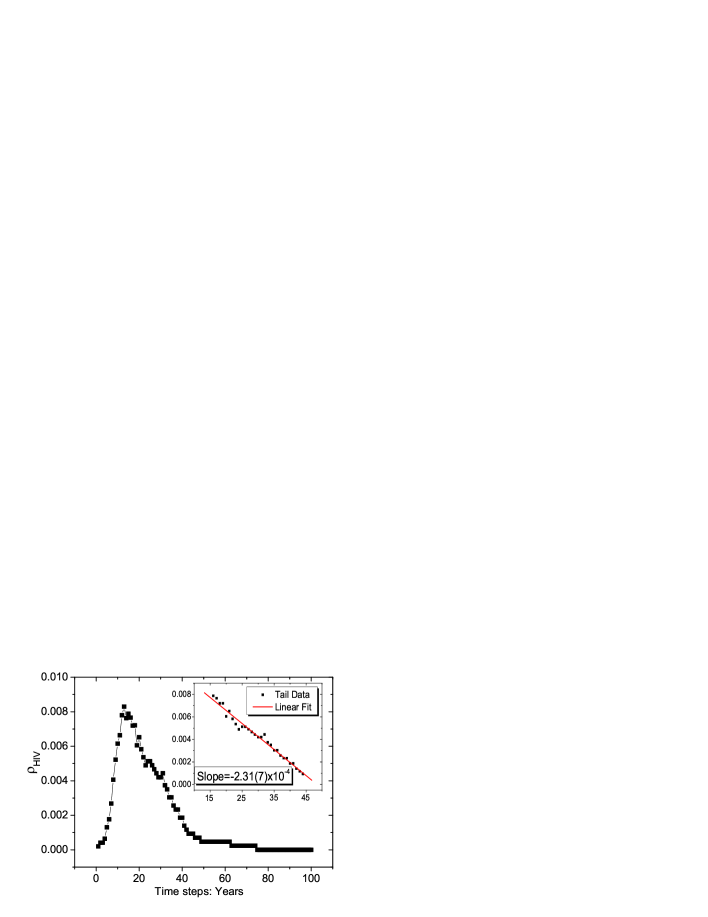
Many infections including HIV/AIDS can persistently exist in population despite of a very low prevalence. This epidemiological phenomenon can not be illuminated by previous models with homogeneous mixing hypothesis [7, 8]. By using the epidemic contact network with power-law degree distribution, the present model can reproduce the above observed phenomenon, which is in accordance with some previous theoretical studies about SIS/SIR models on scale-free networks [21, 22, 44, 45]. Note that, since there are newly added susceptible individuals at each time step, the dynamic behaviors of present model may be closer to SIS model than SIR model. Figure 1 reports a typical simulation result wherein the prevalence of HIV is only about . However, the infections can persistently exist for thousands years. For comparison, we exhibit the situation under homogeneous mixing hypothesis in figure 2, where the three parameters are the same but all the nodes have fixed degree 3. The prevalence increases in the early stage since only few HIV-positive persons die, and then dies out obeying a linear form.
In addition, this model displays oscillatory behaviors, which have been observed in real world [46, 47] and reproduced by some previous network epidemic models based on small-world networks [48, 49, 50] or scale-free networks [51]. One can see references [52, 53] for the concept of small-world networks. However, since the time from first report about HIV cases to now is relative short compared with the oscillatory period, we can not make sure if the real-life HIV epidemics showing some kinds of oscillation.
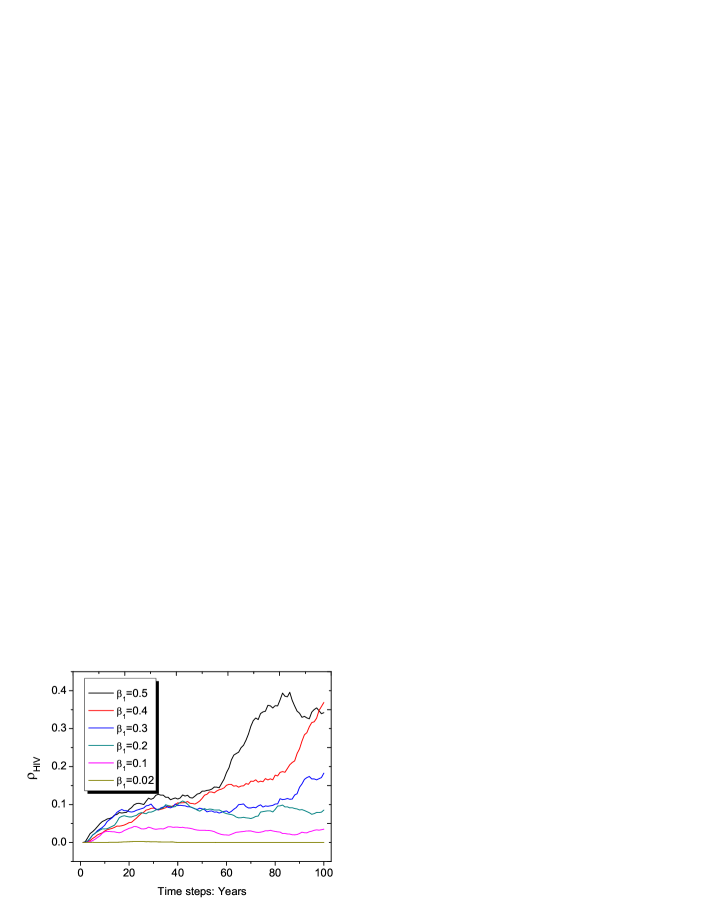
3.2 Effect of Transmission Probability
The transmission probability not only depends on the pathological characters of HIV, but only can be managed by government and other organizations. For example, the popularization of the usage of condoms will sharply reduce the transmission probability per sexual partner/act as observed in Thailand and Cambodia [54, 55]. Figure 3 exhibits the curves for different : When is large, the prevalence fleetly increase until considerable ratio of whole population gets infected, while for smaller , the infection either persistently exists in a low prevalence-level, or vanishes.
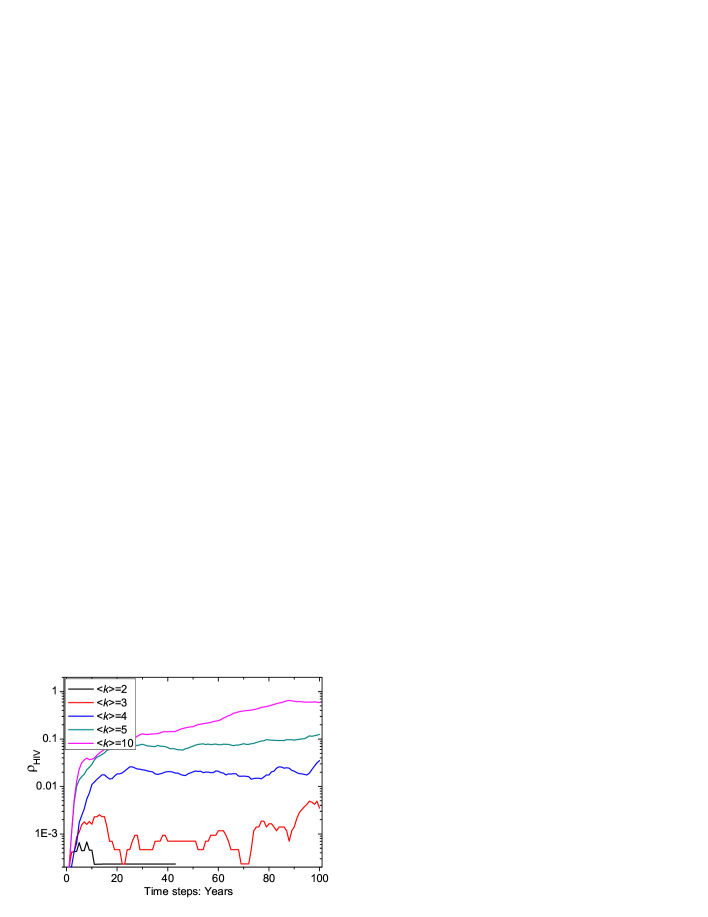
3.3 Effect of Average Degree
We have also investigated the effect of average degree on network epidemic behaviors. As shown in figure 4, the behaviors of this model are very sensitive to the mean degree. Clearly, larger mean degree will statistically enlarge the probability of coming into contact with infected individuals, thus leading to more serious situation. Combine this result and that of section 3.1, one will find that the epidemic behaviors are highly affected by the network topology.
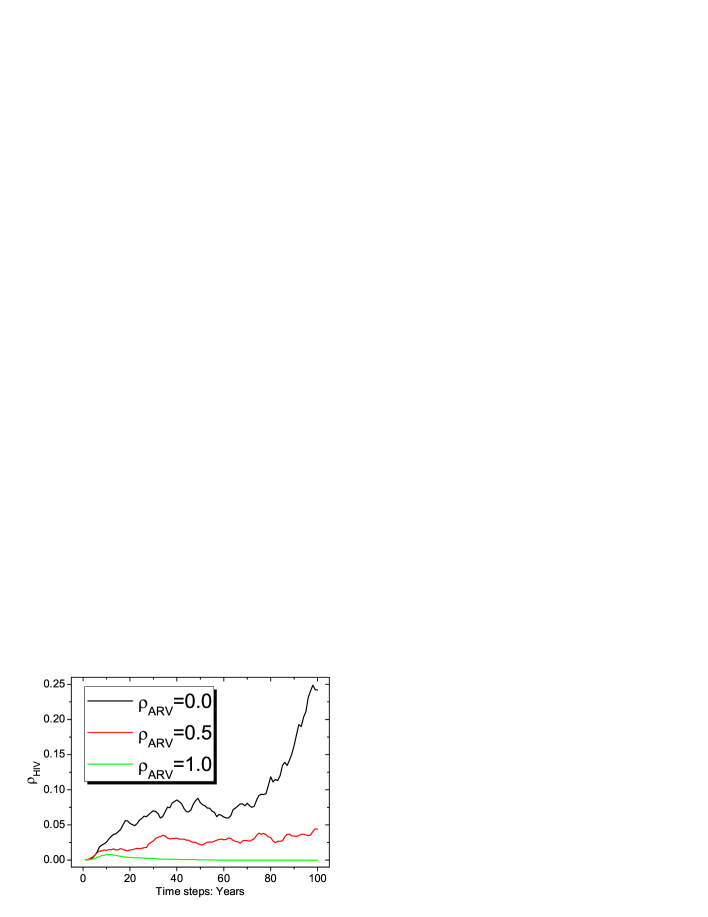
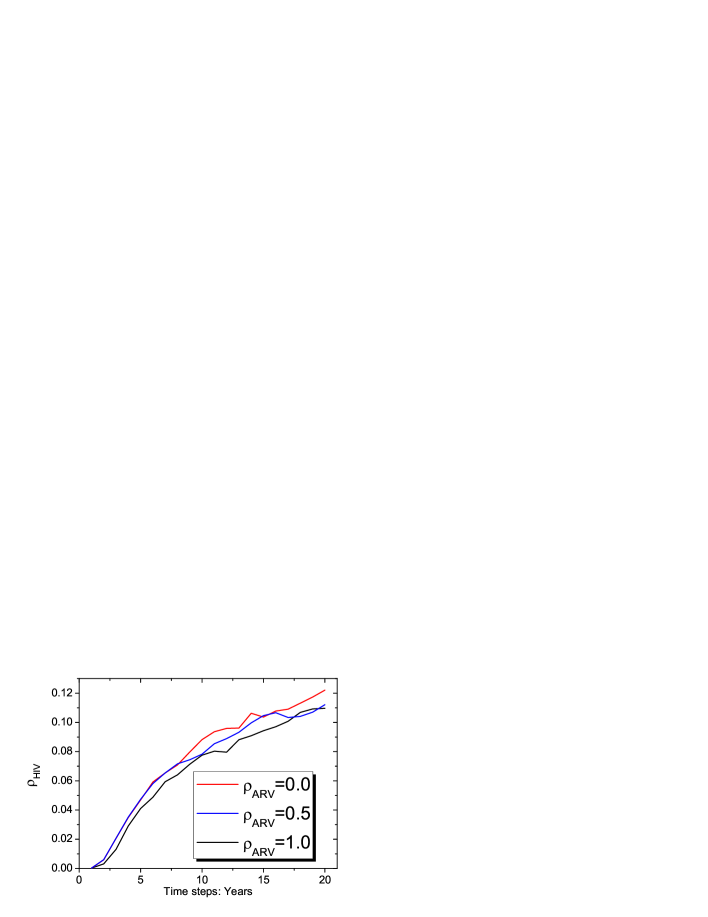
3.4 Impact of Antiretroviral Drug Therapies
The antiretroviral drug therapies have two opposite effects. On one hand, it will reduce the probabilities of both sexual transmission and perinatal transmission, thus ought to be very helpful in controlling the epidemic spreads [27, 41]. On the other hand, this treatment will increase the life expectancy for HIV-positive persons and these ARV users can infected more individuals if they do not stop their risky behaviors, thus this treatment may on the contrary increase the incidence of HIV/AIDS [25, 56]. Here, we assume the usage of ARV will not change patients’ behaviors, and in figure 5, one can find that this treatment can substantially reduce HIV epidemics, and even be possible to eradicate high prevalence HIV epidemics under certain ideal conditions. It is worthwhile to emphasize that, the simulation results in figure 5 strongly depend on the choices of some dubious and imprecise parameters [27, 41] such as the ratios , and . Therefore, the corresponding results are not confessed. Maybe further empirical and experimental studies about antiretroviral drug therapies may lead to more accurate results. In addition, the behavior parameters and are more important than , and for very large case, the impact of antiretroviral drug therapies is very weak as shown in figure 6. Hence, to reduce the risky behaviors is much more effective in the fight against HIV/AIDS rather than ARV treatment, especially for the poor countries. The cases of Thailand [54] and Eastern Zimbabwe are very good examples [58].
3.5 Hierarchical Spread of HIV Epidemic Outbreaks
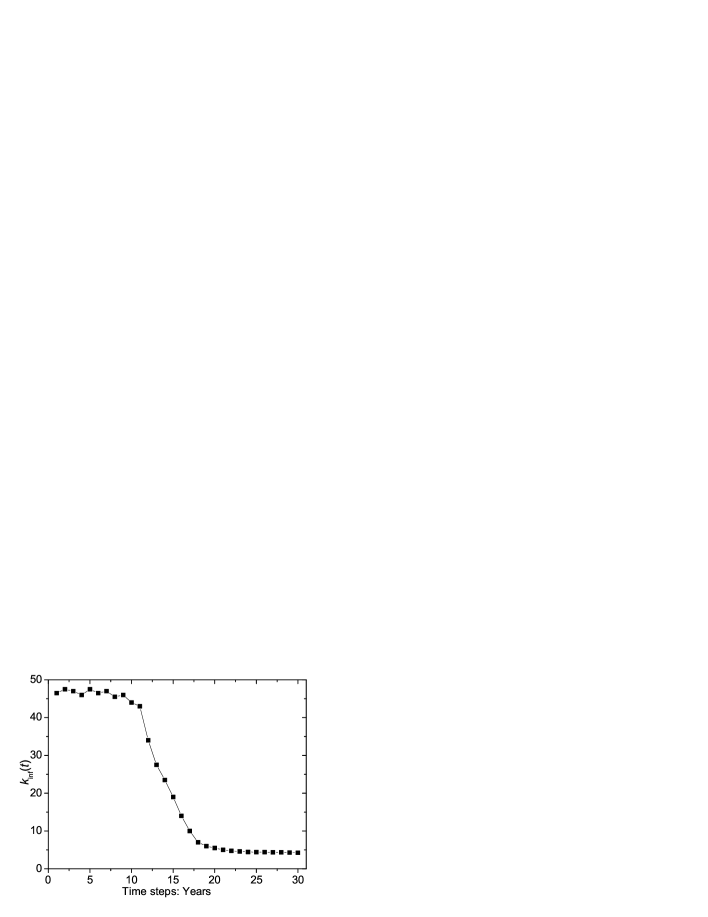
In the epidemic contact networks, the degree can reflect the susceptibility of individual to some extent, that is, the node with higher degree is easier to be infected statistically [59]. Here, we investigate the behavior of the average degree of the newly infected nodes in networks at time , denoted by . We use the average of 10 realizations to reduce the fluctuations. As shown in figure 7, the dynamical spreading process is therefore clear: After the high-risk population are infected within a short time, the spread is going towards generic population (low-risk population). This hierarchical spread, has been reported in some previous pure theoretical studies on SI model [60, 61, 62, 63], but not been emphasized in previous HIV/AIDS epidemic models. However, this phenomenon has been observed in real-life HIV epidemics: In the early stage the infection is adhered to these high-risk persons, such as sex workers, injection drug users, men who have sex with men, and so on. And then, it diffuses to generic population. As an typical example, one can see the situation in China [64].

4 Relevance to the real HIV/AIDS Epidemics
Previous studies on the prediction of the HIV/AIDS epidemics mainly concentrate on the data of the number of reported HIV-positive cases. These methods, like empirical Bayesian back-calculation method [65], can give a relatively accurate prediction in short-term. However, it can not provide useful information about the underlying dynamic mechanism. Therefore, In this section, we will try to predict HIV/AIDS epidemics by using the present model.
The lack of comprehensive and authentic data is one of the most serious problems in evaluating and predicting HIV/AIDS epidemics. For example, in the year 2004, the Chinese Minister of Health reported that the number of living HIV-positive persons is about , but in the year 2006, it says that this number is completely incorrect due to the greatly overvaluing. Actually, the veracity of the reported HIV-positive numbers is dubious. From the web site of UNAIDS [32], except the data of HIV-positive numbers, one can also obtain the data about the number of AIDS-patients from national sentinel surveillances. These data are also dubious since the monitor policies are not professional especially in developing countries and some AIDS-patients do not want to report to the sentinel surveillances. However, the data from national sentinel surveillances do not involve external estimating algorithm, thus we believe they are at least more faithworthy than the HIV-positive numbers.
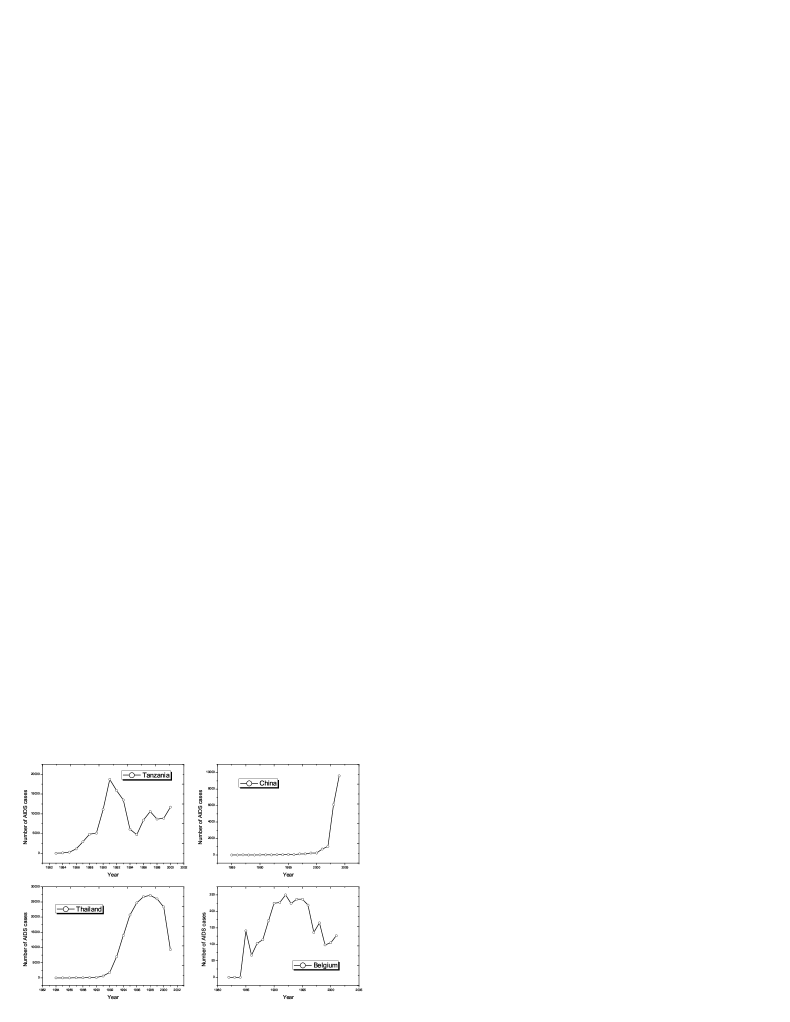
In figure 8, we show four typical forms of the time series of the number of AIDS cases. Although there may be some other forms, the present fours are representative. The most serious country is Tanzania, wherein a considerable ratio of whole population is infected. Without impelling control policies, Tanzania will be completely destroyed before long. In China, the proportion of AIDS cases seems very small but the amount of AIDS is quite large as a result of the striking huge ensemble, and its quick and monotone increasing trend brings us heavy misgivings. Thailand is a successful example of external control. Once, Thailand, especially the northern Thailand, is the most serious country in Asia due to its thriving and prosperous pornographic business. Delightfully, the government is cognizant of this problem and forces all the sex workers using condoms. This policy leads to a sharply decreasing of HIV-positive and AIDS-patient numbers. Some other countries, like Brazil, have also achieved successful policies in controlling HIV/AIDS epidemics. However, these emergent external policies bring great challenges in predicting. The most optimistic situation is that of Belgium. The HIV/AIDS persists in a very low prevalence level and no increasing trend is observed.
In our model, according the assumption in section 2.2, we consider the mortality at time as the number of newly monitored AIDS-patients. This quantity, denoted by , can be obtained from the model by combining the death rolls of children, adults and old persons. Because of the computational limit, we can at most handle the epidemic contact network with size . However, the number of people aged from 15 to 49 in some countries is much larger than . In order to compare the time series generated by our model and those of real country, all the data are normalized by the population size aged from 15 to 49. The normalized number of AIDS cases is denoted by . In addition, we assume the number of AIDS cases is proportional to the HIV-positive number at a given time . Denote the normalized data from sentinel surveillances , and the data generated from our model , the departure is defined as
| (3) |
Since the parameter is known after the country is selected (these data can also be obtained from UNAIDS), there are only two tunable parameter and . Hence this task degenerates to an optimal problem: Determine the proper value of and to minimize the departure . The optimal problem is carried out by searching all the values of in the Cartesian product of sets and , and choosing the one corresponding to minimal . The parameters will not change with time, that is to say, the present prediction is valid only for the cases with no additional interventions.
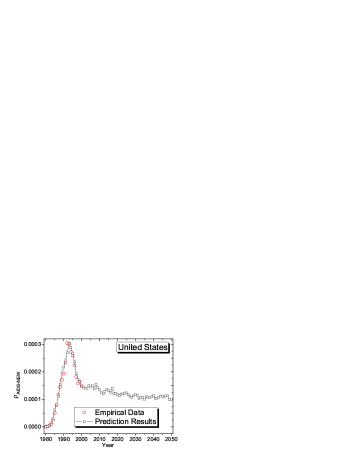
We have tried this prediction method for many representative countries, and found the cases can be roughly divided into three patterns. The typical example for the first pattern is the United States (US), wherein the curve of AIDS-patient number has an obvious peak before the year 2000, and then decreases to a relative low and stable level. The similar behaviors have also been found for many other countries, such as Mexico, Spain, Australia, Belgium, Thailand, and so on. The common feature of these countries is that their transmission probabilities are all small. This may be because of the high popularization rates of condoms and disposable injectors.
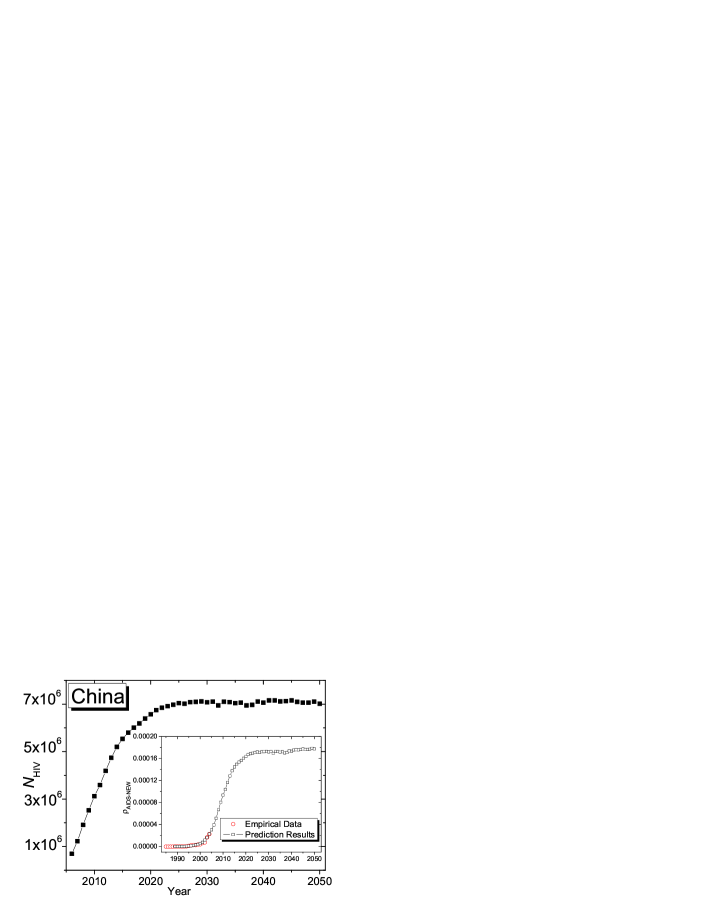
China is a particular example, although the prevalence of AIDS cases are very low, it increases exponentially fast in the early stage with exponent , that is, in the early stage. However, this velocity will be slowed down and the number of AIDS cases will get steady after the year 2025. This interesting behavior may due to the particular values of and in China. Traditionally, Chinese women are not supposed to have sex with a man other than their future spouse, thus the mean degree is very small compared to ’Western-style’ society. However, since the popularization rate of the usage of condoms in China is very low , the transmission probability in China is much higher than these developed countries. In a word, although no efficient policies in controlling HIV epidemics have been implemented in Chinese government or other organizations, the traditional moral sense may protect China from suffering AIDS.
Note that, the shapes of and are slightly different, which attributes to the fluctuation of population size. Although the numbers of HIV-positive dwellers seems high in some countries, such as US and China, their direct and indirect effects on the demographic structure of the whole population are very weak. If we fixed for US and China from 2006 to 2050, then the population size (aged from 15 to 49) without HIV/AIDS will be almost the same as the original prediction results. Since the departures can not be observed in plots, we have not shown here.
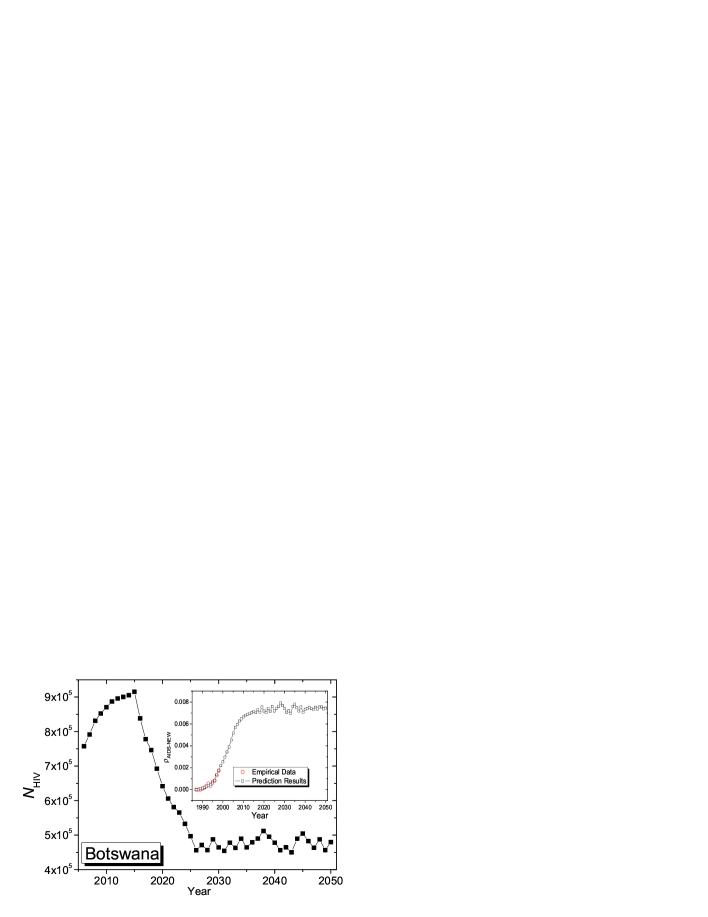
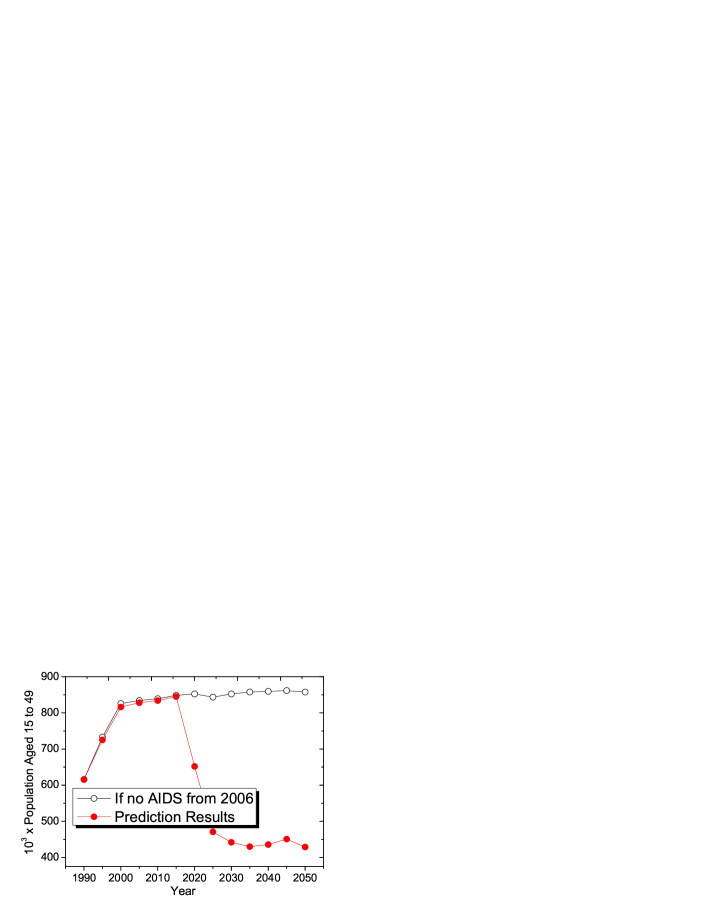
The most serious regions suffering AIDS are Africa (especially Sub-Saharan Africa) [66, 67, 68] as well as Latin America and Caribbean region [69]. An typical example is Botswana, which is a relative rich country in Africa but has the highest HIV prevalence all over the world. If no additional interventions, the infection will kill more than 50% persons in their prime of life. The ostensible stable behavior after 2020 is on account of the existence of some no-risk people: They adhere to monogamy and do not hit the pipe, thus will not be infected. In network language, these individuals belong to some isolated clusters. In network SIR model, these isolated clusters usually come into being as a result of the removal of some individuals [70]. Other than US and China, demographic impact of the HIV Epidemic in Botswana is striking. In figure 12, we compare the predicted population size (aged from 15 to 49) with the no-AIDS case where we set from 2006 to 2050. After year 2015, the population size sharply declines, which is the very reason of the decline of in figure 11. Only by ten years, the population holds down to a half level. The demographic gets stable in this new level since there are a number of no-risk people. Finally, the age distribution in Botswana becomes sandglass-like since many people in their prime of life (aged 15 to 49) will be killed by AIDS. We are afraid that some other countries in Africa, such as Malawi, Tanzania and Zambia, may face the same danger [71, 72].
5 Conclusion and Discussion
In this article, we propose a network epidemic model for HIV epidemics, wherein each individual is repreasented by a node of the transmission network and the edges are the connections between individuals along which the infection may spread. Motivated by some previous empirical studies on the pattern of sexual contact, we set the sexual activity of each individual, measured by its degree, is not homogeneous but obeys a power-law distribution.
Many infections concluding HIV/AIDS can persist in population at a very low prevalence. This epidemiological phenomenon can not be illuminated by previous models with homogeneous mixing hypothesis, while our model can reproduce this feature due to the heterogeneity of activity. In addition, the model displays a clear picture of hierarchical spread: In the early stage the infection is adhered to these high-risk persons, and then, diffuses toward low-risk population.
There are two main ingredients baffling the prediction obtained by dynamical model: The first is the lack of comprehensive and authentic data, and the second is the existence of unexpected interventions like the governmental action against HIV/AIDS epidemics. Right or wrong, we try to predict HIV epidemics by using the present model, and hope it will at least capture some qualitative features. The prediction results show that the development of epidemics can be roughly categorized into three patterns for different countries: persist in a stable and low level after a peak in the early stage (US), monotonously grow and then persist in a stable and low level (China), infect considerable ratio of population. Which class the HIV epidemic of a given country finally belongs to is mainly determined by the corresponding behavior parameters . The interplay of demographic structure and HIV epidemics is also taken into account. In most cases, the effect of HIV epidemics on demographic structure is very weak, while for some extremely countries, like Botswana, the population size can be decpressed to a half, and the age structure will become sandglass-like since many people in their prime of life (from aged 15 to 49) will be killed by AIDS.
We believe this work may have some contribution in understanding the underlying mechanism of HIV epidemic dynamics, since it can naturally reproduce some important observed characters in HIV spread that has not been emphasized in the previous models. However, is has many shortages which should be adverted to and may be considered in the future works. The first is the memory-limitation and time-complexity in simulation block the directly studies on very large systems. Therefore, we have to use the normalization method to mimic the real countries with huge population. This size effect may bring additional error in prediction. A recently proposed fast algorithm [73, 74] may improve the situation if we have successfully modified some dynamical rules and translated this model into an equal rate-equation form. Secondly, this model consider only the heterosexual contacts and perinatal transmission, however, other transmission routes, especially the homosexual contacts [75, 76] and sharing injectors among drug users [77, 78], are also significant in HIV epidemics. Finally, some details are ignored. For example, a recent study [79] indicates the existence of large fertility differentials between HIV-infected and uninfected women, and some empirical studies show that the social networks have community structure [80, 81], which will affect the epidemic dynamics [82, 83].
6 Acknowledgments
This work has been partially supported by the National Natural Science Foundation of China under Grant Nos. 70471033, 10472116, 10532060, 70571074 and 10547004, the Specialized Research Fund for the Doctoral Program of Higher Education (SRFDP No.20020358009), the Special Research Founds for Theoretical Physics Frontier Problems under Grant No. A0524701, and Specialized Program under President Funding of Chinese Academy of Science.
7 Appendix A: The Population and Demographic Data
All the population and demographic data come from the United Nations and can be obtained by decompressing the .zip file from Http://www.comap.com/ undergraduate/contests/mcm/2006/problems/2006%20ICM.zip. The explanation about some used data in this article are as following.
age_data.xls: These data give population (for both sexes, and by gender) by five-year groups, major area, region, and country, 1950-2050 (a. Estimates for 1950-2005; b. Projections for 2010-2050).
fertility_data.xls: These data give age-specific fertility rates by major area, region, and country, 1995-2050 (a. Estimates for 1995-2005; b. Projections for 2010-2050).
population_data.xls: These data give total population (both sexes combined) by major area, region, and country, annually for 1995-2050 (a. Estimates for 1950-2005; b. Projections for 2006-2050).
References
- [1] N. T. J. Bailey, The Mathematical Theory of Infectious Diseases and Its Applications, New York, Hafner Press, 1975.
- [2] R. M. Anderson, and R. M. May, Infectious Diseases of Humans, Oxford, Oxford University Press, 1992.
- [3] J. D. Murray, Mathematical Biology, Springer-Verlag, Berlin, 1993.
- [4] H. M. Hethcote, SIAM Review 42 (2000) 599.
- [5] R. M. Anderson, R. M. May, M. C. Boily, G. P. Garnett, and J. T. Rowley, Nature 352 (1991) 581.
- [6] J. T. Boerma, and S. S. Weir, Journal of Infectious Diseases 191 (Suppl. 1) (2005) S61.
- [7] R. Pastor-Satorras, and A. Vespignani, Epidemics and immunization in scale-free networks. In: Bornholdt S, and Schuster H G (eds.) Handbook of Graph and Networks, Wiley-VCH, Berlin, 2003.
- [8] T. Zhou, Z. -Q. Fu, and B. -H. Wang, arXiv: physics/0508096.
- [9] P. Grassberger, Math. Biosci. 63 (1983) 157.
- [10] B. Bollobás, Random Graphs, Academic Press Inc, 1985.
- [11] F. Liljeros, C. R. Rdling, L. A. N. Amaral, H. E. Stanley, and Y. berg, Nature 411 (2001) 907.
- [12] F. Liljeros, C. R. Rdling, and L. A. N. Amaral, Microbes and Infection 5 (2003) 189.
- [13] A. Schneeberger, C. H. Mercer, S. A. J. Gregson, N. M. Ferguson, C. A. Nyamukapa, R. M. Anderson, A. M. Johnson, and G. P. Garnett, Sexually Transmitted Diseases 31 (No.6) (2004) 380.
- [14] A. -L. Barabási, and R. Albert, Science 286 (1999) 509.
- [15] R. Albert, and A. -L. Barabási, Rev. Mod. Phys. 74 (2002) 47.
- [16] S. N. Dorogovtsev, and J. F. F. Mendes, Adv. Phys. 51 (2002) 1079.
- [17] M. E. J. Newman, SIAM Review 45 (2003) 167.
- [18] S. Boccaletti, V. Latora, Y. Moreno, M. Chavez, and D. -U. Hwang, Phys. Rep. 424 (2006) 175.
- [19] S. Bassetti, W. E. Bischoff, and R. J. Sherertz, Emerging Infectious Diseases 11 (2005) 637.
- [20] M. Small, and C. K. Tse, Physica A 351 (2005) 499.
- [21] R. Pastor-Satorras and A. Vespignani, Phys. Rev, Lett. 86 (2001) 3200.
- [22] R. M. May and A. L. Lloyd, Phys. Rev. E 64 (2001) 066112.
- [23] J. M. Hyman, J. Li, and E. A. Stanley, J. Theor. Biol. 208 (2001) 227.
- [24] J. M. Hyman, J. Li, and E. A. Stanley, Math. Biosci. 181 (2003) 17.
- [25] S. M. Blower, H. B. Gershengorn, and R. M. Grant, Science 287 (2000) 650.
- [26] S. M. Blower, E. J. Schwartz, and J. Mills, AIDS Rev. 5 (2003) 112.
- [27] T. C. Porco, J. N. Martin, K. A. Page-Shafer, A. Cheng, E. Charlebois, R. M. Grant, and D. H. Osmond, AIDS 18 (2004) 81.
- [28] R. M. Anderson, R. M. May, and A. R. McLean, Nature 332 (1988) 228.
- [29] S. Surasiengsunk, S. Kiranandana, K. Wongboonsin, G. P. Garnett, R. M. Anderson, and G. J. P. van Griensven, AIDS 12 (1998) 775.
- [30] R. B. Rothenberg, J. J. Potterat, D. E. Woodhouse, S. Q. Muth, W. W. Darrow, and A. S. Klovdahl, AIDS 12 (1998) 1529.
- [31] J. J. Potterat, R. B. Rothenberg, and S. Q. Muth, Int. J. STD AIDS 10 (1999) 182.
- [32] See the reports on the global AIDS epidemic of Joint United Nations Programme on HIV/AIDS (UNAIDS) from the web site Http://www.unaids.org.
- [33] G. Ergün, Physica A 308 (2002) 483.
- [34] P. Holme, F. Liljeros, C. R. Edling, and B. J. Kim, Phys. Rev. E 68 (2003) 056107.
- [35] F. Chung, and L. Lu, Annals of Combinatorics 6 (2002) 125.
- [36] M. E. J. Newman, S. H. Strogatz, and D. J. Watts, Phys. Rev. E 64 (2001) 026118.
- [37] D. Kitayaporn, J. Acquir. Immun. Defic. Syndr. Hun. Retrovirol. 11 (1996) 77.
- [38] A. Mun̈oz, C. A. Sabin, and A. N.Phillips, AIDS 11 (suppl A) (1997) S69.
- [39] G. P. Garnett, R. M. Anderson, IMA J. Math. Appl. Med. Biol. 11 (1994) 161.
- [40] T. D. Mastro, and I. de Vincenzi, AIDS 10 (suppl A) (1996) S75.
- [41] C. A. Sabin, T. Hill, F. Lampe, R. Matthias, S. Bhagani, R. Gilson, M. S. Youle, M. A. Johnson, M. Fisher, S. Scullard, P. Easterbrook, B. Gazzard, and A. N. Phillips, Brit. Med. J. 330 (2005) 695.
- [42] T. Chotpitayasunondh, et al., 4th International Congress on AIDS in Asia and the Pacific, Manila, October 1997.
- [43] K. E. Nelson, AIDS 12 (1998) 813.
- [44] Y. Moreno, R. Pastor-Satorras, and A. Vespignani, Eur. Phys. J. B 26 (2002) 521.
- [45] L. K. Gallos, and P. Argyrakis, Physica A 330 (2003) 117.
- [46] A. Cliff, and P. Haggett, Sci. Am. 250 (No.5) (1984) 110.
- [47] A. Tohamsen, J. Theor. Biol. 178 (1996) 45.
- [48] M. Kuperman, and G. Abramson, Phys. Rev. Lett. 86 (2001) 2909.
- [49] S. -J. Xiong, Phys. Rev. E 69 (2004) 066102.
- [50] T. Verdasca, M. M. T. da Gama, A. Nunes, N. R. Bernardino, J. M. Pacheco, and M. C. Gomes, J. Theor. Biol. 233 (2005) 553.
- [51] Y. Hayashi, M. Minoura, and J. Matsukubo, Phys. Rev. E 69 (2004) 016112.
- [52] D. J. Watts, and S. H. Strogatz, Nature 393 (1998) 440.
- [53] D. J. Watts, Small Worlds, Princeton University Press, Princeton, 1999.
- [54] J. Cohen, Science 301 (2003) 1658.
- [55] R. W. Buckingham, E. Meister, and N. Webb, Int. J. STD AIDS 15 (2004) 210.
- [56] J. X. Velasco-Hernandez, H. B. Gershengorn, and S. M. Blower, Lancet Infect. Dis. 2 (2002) 374.
- [57] T. Nagachinta, et al., AIDS 11 (1997) 1765.
- [58] S. Gregson, G. P. Garnett, C. A. Nyamukapa, T. B. Hallett, J. L. C. Lewis, P. R. Mason, S. K. Chandiwana, and R. M. Anderson, Science 311 (2006) 664.
- [59] R. M. Christley, G. L. Pinchbeck, R. G. Bowers, D. Clancy, N. P. French, R. Bennett, and J. Turner, Am. J. Epidemiol. 162 (2005) 1024.
- [60] M. Bathélemy, A. Barrat, R. Pastor-Satorras, and A. Vespignani, Phys. Rev. Lett. 92 (2004) 178701.
- [61] T. Zhou, G. Yan, and B. -H. Wang, Phys. Rev. E 71 (2005) 046141.
- [62] M. Bathélemy, A. Barrat, R. Pastor-Satorras, and A. Vespignani, J. Theor. Biol. 235 (2005) 275.
- [63] G. Yan, T. Zhou, J. Wang, Z. -Q. Fu, and B. -H. Wang, Chin. Phys. Lett. 22 (2005) 510.
- [64] Annual reports on AIDS epidemic in China, from the web site Http://www.chinaids.org.cn.
- [65] A. M. Downs, S. H. Heisterkamp, J. -B. Brunet, and F. F. Hamers, AIDS 11 (1997) 649.
- [66] K, Sinka, J. Mortimer, B. Evans, and D. Morgan, AIDS 17 (2003) 1683.
- [67] C. Lau, and A. S. Muula, Croatian Medical Journal 45 (2004) 402.
- [68] S. Hanson, Journal of Public Health 33 (2005) 233.
- [69] J. M. G. Calleja, N. Walker, P. Cuchi, S. Lazzari, P. D. Ghys, and F. Zacarias, AIDS 16 (Suppl. 3) (2002) S3.
- [70] L. M. Sander, C. P. Warren, I. M. Sokolov, C. Simon, and J. Koopman, Math. Biosci. 180 (2002) 293.
- [71] K. Fylkesnes, Z. Ndhlovu, K. Kasumba, R. Mubanga, and M. Sichone, AIDS 12 (1998) 1227.
- [72] J. R. Glynn, J. Pönnighaus, A. C. Crampin, F. Sibande, L. Sichali, P. Nkhosa, P. Broadbent, and P. E. M. Fine, AIDS 15 (2001) 2025.
- [73] Y. Moreno, J. B. Gómez, and A. F. Pacheco, Phys. Rev. E 68 (2003) 035103.
- [74] Y. Moreno, M. Nekovee, and A. Vespignani, Phys. Rev. E 69 (2004) 055101.
- [75] Y. A. Amirkhanian, J. A. Kelly, A. A. Kukharsky, O. I. Borodkina, J. V. Granskaya, R. V. Dyatlov, T. L. McAuliffe, and A. D. Kozlov, AIDS 15 (2001) 407.
- [76] A. S. Wade, C. T. Kane, P. A. N. Diallo, A. K. Diop, K. Gueye, S. Mboup, I. Ndcye, and E. Lagarde, AIDS 19 (2005) 2133.
- [77] T. X. Chu, and J. A. Levy, Cell Research 15 (2005) 865.
- [78] C. B. Mocoy, S. H. Lai, L. R. Metsch, S. E. Messiah, and E. Wei, Annals of Epidemiology 14 (2004) 535.
- [79] J. J. C. Lewis, C. Ronsmans, A. Ezeh, and S. Gregson, AIDS 18 (Suppl. 2) (2004) S35.
- [80] M. Girvan, and M. E. J. Newman, Proc. Natl. Acad. Sci. USA 99 (2002) 782.
- [81] G. Palla, I. Derényi, I. Farkas, and T. Vicsek, Nature 435 (2005) 814.
- [82] Z. -H. Liu, and B. -B. Hu, Europhys. Lett. 72 (2005) 315.
- [83] G. Yan, Z. -Q. Fu, J. Ren, and W. -X. Wang, arXiv: physics/0602137.