Second-Order Nonlinear Mixing of Two Modes in a Planar Photonic Crystal Microcavity
Abstract
Polarization-resolved second-harmonic spectra are obtained from the resonant modes of a two-dimensional planar photonic crystal microcavity patterned in a free-standing InP slab. The photonic crystal microcavity is comprised of a single missing-hole defect in a hexagonal photonic crystal host formed with elliptically-shaped holes. The cavity supports two orthogonally-polarized resonant modes split by 60 cm-1. Sum-frequency data are reported from the nonlinear interaction of the two coherently excited modes, and the polarization dependence is explained in terms of the nonlinear susceptibility tensor of the host InP.
1 Introduction
Planar photonic crystals (PPCs) are ideal platforms to host engineered optical microcavities for the study of light-matter interactions in cavity quantum electrodynamics (QED) and quantum information research. Although the Q-factors of PPC microcavities have typically been much lower than the Fabry-Perot cavities used in the pioneering cavity QED work [1, 2], in the last three years innovative momentum-space [3, 4] and double heterostructure designs have realized Q-factors as large as 600,000. Moreover, PPC microcavities have three distinct advantages over their macroscopic counterparts: they provide mode volumes which approach the fundamental limit of a cubic half-wavelength in material; they allow integration with quantum dots to control the exciton/photon coupling; and they are based on the mature fabrication technology of e-beam lithography and plasma-etching, which facilitates higher-scale integration and coupling to waveguides. In a quantum information context, PPC microcavities that incorporate artificial quantum dots can be configured in different ways to act as single photon sources [5], or “qubits”, the basic building blocks of quantum computers. For example, the two states that comprise the qubit could be two high-Q photon modes of a microcavity that are coupled through a nonlinearity [6], or two quantum dots that are coupled by a single cavity mode [7].
We recently reported a novel resonant scattering technique that probes coherently excited resonant modes of PPC microcavities efficiently and independently of the photoluminescence (PL) from embedded quantum dots [8]. The data were from single-missing hole defect cavities that supported two non-degenerate modes, each with a Q of about 500. We also reported an example of the spectra emitted from such modes at approximately twice the frequency of the broadband pulse that resonantly excited both cavity modes. Four distinct features were identified: three centered at twice the frequencies of the excitation pulse and the two cavity modes, and one centered at the sum of the two distinct cavity mode frequencies. In this paper, the polarization dependence of these harmonic features is explored and interpreted in terms of the nonlinear susceptibility tensor of the host InP. The data can be explained principally in the context of the bulk tensor, although there may be additional surface effects arising from the broken symmetry around the air holes that define the PPC microcavity. Since the sum-frequency signal can only be generated when both cavity modes are excited, this offers a means of monitoring the occupation of the cavity modes in a weakly invasive manner. These results also suggest that the inverse nonlinear process, whereby a single photon at the sum-frequency generates two photons in the microcavity modes, might allow these to act as miniature sources of correlated photon pairs.
2 Experiment
The microcavity is defined in a 2D pattern of air holes in a 223 nm free-standing layer of InP separated by 1 m from a glass substrate. A single layer of InAs quantum dots at a relatively low density of 1-2 m-2 is contained in the middle of the InP membrane. The cavity-enhanced PL from the quantum dots was reported previously [9, 8]. Further details about the sample fabrication can be found in Dalacu et al. [9]
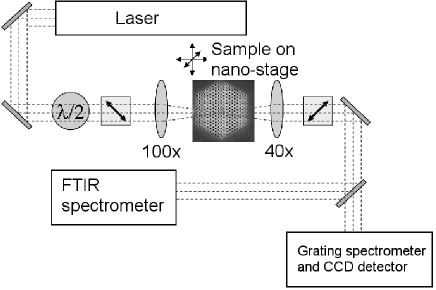
The harmonic spectroscopy is performed in tandem with resonant scattering, as shown in the experimental set-up in Figure 1. In both techniques, a Spectra-Physics optical parametric oscillator (OPO) tuned near 1580 nm is used to generate 100 fs pulses at a repetition rate of 80 MHz. The desired excitation polarization is selected using a half-wave plate and polarizer, and the light is tightly focused by a 100x microscope objective. It is collected in transmission using a 40x microscope objective (NA 0.55). With the input lens defocused, the PPC outline can be clearly imaged on a camera placed after the collection lens, and the beam focussed down to the missing-hole defect cavity. The resonant scattering signal, which has excellent signal-to-noise and is rapid to acquire with a Bomem Fourier transform infrared (FTIR) spectrometer, is used to align the cavity for the harmonic spectroscopy. By optimizing this signal, the position of the sample, which is mounted on Melles Griot nanopositioners, can be adjusted to high precision to effectively excite each mode separately, or both modes, depending on the incident polarization.
To acquire the second-harmonic data, average excitation powers of 70-110 W are used, and the signal is directed to a grating spectrometer and cooled charge-coupled device (CCD) detector by removing the final turning mirror. The only adjustment to the detection scheme is that the collection lens must be translated about 50 m towards the sample to account for the chromatic dispersion between the fundamental and second-harmonic frequencies.
3 Results and Discussion
3.1 Off-cavity harmonic spectroscopy
To interpret the microcavity results, it is first necessary to understand the “bulk” membrane response. Away from the patterned regions, the InP membrane is not free-standing, but is supported by a 1 m layer of SiO2, which is glued with optical adhesive to a thick glass substrate. The second-harmonic response of the untextured, supported membrane was probed in each of four incident polarizations: 0∘, 45∘, 90∘, and 135∘. The electronic axes of the InP are aligned with the 45∘/135∘ polarizations, respectively, as shown in Fig. 2a. The detected intensity as a function of output polarization is shown in Figure 2b. Virtually identical results were obtained from a sample of similar dimensions which did not contain a dilute layer of InAs quantum dots. The 45∘ and 135∘ data peak when the output signal is cross-polarized with respect to the input, and have a null in the parallel-polarization. In contrast, the 0∘ and 90∘ data peak in the parallel polarization, and have a non-zero offset in cross-polarization.
The bulk nonlinear susceptibility tensor for InP, a zincblende () crystal, has only three non-vanishing components: . In order to generate second-harmonic radiation from the bulk when the excitation beam is polarized parallel to either the - or -electronic axis, there must be a -component of the field, and such radiation would be cross-polarized with respect to the input, as observed in the data. The existence of longitudinal () fields is well known for tightly focussed Gaussian beams [10, 11, 12], for which the paraxial approximation breaks down. Near the beam waist, it can be shown that [10], so the longitudinal field is anti-symmetric about the y-z mirror plane. In our experiment, we estimate the beam waist radius to wavelength ratio () to be about 1, and finite-difference time-domain (FDTD) simulations (Lumerical Solutions) show that the maximum of is on the order of 6% of the transverse field magnitude in this case. Because of the odd symmetry of , the second-harmonic polarization which is generated will be of opposite sign on either side of the beam centre. Using FDTD, this situation can be modelled as two oppositely-oriented, in-plane dipoles separated by about 1.5 m. The results confirm that there is a non-trivial far-field radiation pattern generated, and that the magnitude of the radiation within the solid angle seen by the collection lens is consistent with the observed signal.
For 0∘ and 90∘ incident polarizations, both - and -polarizations are excited in the InP slab. The large signal in the parallel orientation and non-zero signal in the crossed orientation are consistent with the bulk response in which the three non-vanishing tensor elements are equal in magnitude. The second-order polarization generated with these incident polarizations can be expressed as . When the incident field is oriented at , and the in-plane component of the polarization will then be oriented parallel or anti-parallel to the incident field, depending on the orientation of . The resulting second-order field radiated by the in-plane components of the polarization will thus be oriented parallel to the incident field. There will also be a -oriented dipole that radiates with no preferred polarization, which explains the non-zero background in this polarization configuration.
In such thin membranes, it is important to consider the role of surface second-harmonic generation (SHG). This is a commonly used probe of elemental semiconductors [13], for which the bulk tensor is zero due to centrosymmetry, but has also been applied to non-centrosymmetric crystals [14, 15, 16]. For a zincblende surface, which has symmetry mm, the non-zero surface symmetry susceptibility elements are , and , where . The latter element would give rise to radiation polarized parallel to the excitation field. However, the 45∘ and 135∘ data show a nearly complete null in the parallel polarization, indicating little sensitivity to surface effects in the normal incidence geometry of this experiment.
3.2 Microcavity harmonic spectroscopy
With the laser focused on the microcavity by optimizing on the modes observed in resonant scattering, second-harmonic data were acquired at the same four input polarizations as for the unpatterned region. At the 45∘ and 135∘ polarizations, where the laser is approximately aligned with one of the cavity modes, there are two features: a broad peak which corresponds to the second-harmonic of the laser spectrum, and a sharp feature at the second-harmonic frequency of the lower energy resonant mode. The picture is more complicated when the laser is polarized at or . The spectra exhibit features due to the second-harmonic of each mode, the sum-frequency generation from the mixing of the two modes, and the broad second-harmonic of the laser spectrum. The polarization-resolved data are shown in Figure 3 (the spectra are similar).
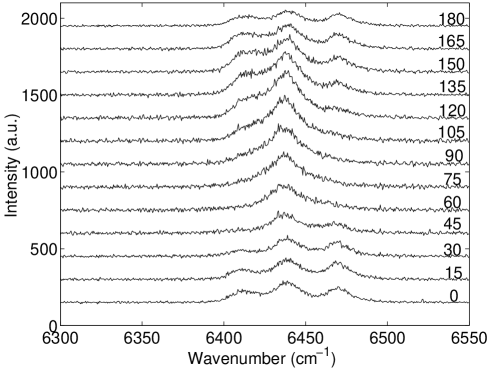
Unlike the PL spectroscopy, which imparts no coherent relation between the two modes; resonant, short-pulse excitation enforces well-defined amplitude and phase relations between the modes and the laser fields. In the linear resonant scattering experiment [8], this was shown to lead to a phase shift between the modes, as detected in the crossed polarization. In the present context, the data are therefore fit using the square of a coherent sum of three Lorentzians and a laser lineshape function.
The observation of strong SHG signals from the individual modes, polarized parallel to the mode polarization, cannot be explained using a bulk second-order polarizability. Because the modes are TE-like, they are symmetric about the mirror plane in the middle of the waveguide, and so there should be considerable cancellation (from the top and bottom halves of the slab) due to polarizations derived from the tensor elements or . Also, because the individual modes are approximately aligned along the electronic axes of the InP, their self-interaction through the tensor element should be negligible, and even if such a second-order polarization were generated, it would not be polarized parallel to the mode polarization (as in the data). The SHG signals observed from the individual modes are therefore attributed to a second-order polarization generated in the vicinity of the etched holes, where the bulk symmetry is likely not applicable.
The experiment has been modelled by an FDTD simulation for a cavity with elliptical holes oriented at an angle of 45∘, for which the semi-major axis is 40 nm longer than the semi-minor axis, which is consistent with scanning electron microscope images of the sample. The results give two dipole-like microcavity modes split by about 38 cm-1, and polarized at approximately 135∘ (mode 1) and 45∘ (mode 2). Although the experimental splitting is larger, the simulation qualitatively captures the observed mode orientation. Vector field plots for the two modes superimposed on a schematic of the cavity geometry are shown in Figure 4. From these plots it is clear that considerable field intensity is localized near the air holes, and so it is possible that new tensor components due to surface effects may be responsible for the generation of the SHG signal from the individual modes, and also for their anomalous polarization dependencies.
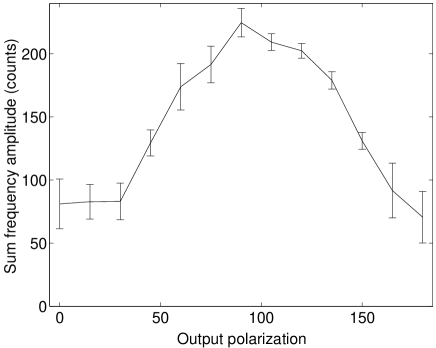
The polarization dependence of the sum-frequency signal is shown in Fig. 5, where the amplitude and standard deviations have been extracted from the nonlinear least-squares fit. We believe that the non-zero offset indicates a significant component of the radiation derives from a nonlinear electronic polarization in the InP which lies along the optic () axis. This “intrinsic” response is consistent with the orthogonally-oriented modes interacting through the component of the bulk nonlinear susceptibility to produce a -polarization in the sample. The modulation in the signal, which is also significant, is likely an “extrinsic” effect associated with fields localized near the surfaces of the etched holes, as discussed earlier.
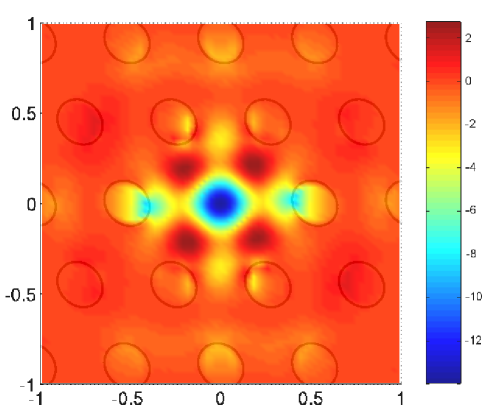
To explain why the bulk properties seem to play an important role in the sum-frequency mixing of the two modes, the spatial dependence of the sum-frequency polarization, , can be reconstructed from the FDTD simulation, as shown in Fig. 6. In the limit that the modes are spectrally well-separated and can be represented by harmonic amplitudes, the sum-frequency polarization is given by . The image in Fig. 6 shows that the sum-frequency polarization derived in this manner is localized predominantly at the center of the cavity, where the bulk nonlinear response would be expected to dominate, based on the off-pattern results discussed above.
Finally, a quantitative check on this picture is provided by simulating the radiated power from a -oriented dipole, scaled to match the strength of the polarization in the cavity, which is collected by a large NA lens oriented in the -direction, as in the experiment. The results of this simulation are consistent with the measured sum-frequency signal.
4 Conclusions
This work demonstrates that second-order nonlinear mixing of coherently-excited resonant modes in an InP-based PPC microcavity is detectable, and that the bulk nonlinear polarizability of the InP is responsible for a significant component of the measured signal. Further work is needed to determine the origin of the SHG signal from the individual cavity modes, and the source of the polarization modulation in the case of the sum-frequency signal, both of which are likely associated with surface effects at the boundaries of the etched holes used to define the microcavities.
These results motivate further studies of nonlinear interactions in multi-mode PPC microcavities. In particular, higher Q modes with frequencies less than half the bandgap of the host material may make PPC-based entangled photon sources possible. More generally, it will be interesting to quantify the ways in which resonant nonlinearities, associated with excitonic transitions in embedded quantum dots, can influence the distribution of the field between different high-Q, small volume microcavity modes.
Acknowledgements
The authors wish to acknowledge the financial support of the Natural Sciences and Engineering Research Council of Canada, the Canadian Institute for Advanced Research, the Canadian Foundation for Innovation, and the technical assistance of Lumerical Solutions Inc.
References
- [1] H. J. Kimble Phys. Scr. T76, p. 127, 1998.
- [2] H. Mabuchi, J. Ye, and H. J. Kimble Appl. Phys. B 68, p. 1095, 1999.
- [3] O. Painter and K. Srinivasan Phys. Rev. B 68, p. 035110, 2003.
- [4] D. Englund, I. Fushman, and J. Vuckovic Optics Express 13, p. 5961, 2005.
- [5] C. Santori, D. Fattal, J. Vuckovic, G. S. Solomon, and Y. Yamamoto Nature 419, p. 594, 2002.
- [6] A. Y. Smirnov, S. N. Rashkeev, and A. M. Zagoskin Appl. Phys. Lett. 80, p. 3503, 2002.
- [7] A. Imamoglu, D. D. Awschalom, G. Burkard, D. P. DiVincenzo, D. Loss, M. Sherwin, and A. Small Phys. Rev. Lett. 83, p. 4204, 1999.
- [8] M. W. McCutcheon, G. W. Rieger, I. W. Cheung, J. F. Young, D. Dalacu, S. Frédérick, P. J. Poole, G. C. Aers, and R. L. Williams Appl. Phys. Lett. 87, p. 221110, 2005.
- [9] D. Dalacu, S. Frédérick, A. Bogdanov, P. J. Poole, G. C. Aers, R. L. Williams, M. W. McCutcheon, and J. F. Young J. Appl. Phys. 98, p. 023101, 2005.
- [10] L. W. Davis Phys. Rev. A 19, p. 1177, 1979.
- [11] G. P. Agrawal and M. Lax Phys. Rev. A 27, p. 1693, 1983.
- [12] J. P. Barton and D. R. Alexander J. Appl. Phys. 66, p. 2800, 1989.
- [13] Y. R. Shen Nature 337, p. 519, 1989.
- [14] T. Stehlin, M. Feller, P. Guyot-Sionnest, and Y. R. Shen Optics Letters 13, p. 389, 1988.
- [15] C. Yamada and T. Kimura Phys. Rev. B 49, p. 14372, 1994.
- [16] R. W. J. Hollering Optics Communications 90, p. 147, 1992.