Tutorial introduction to Virtual Reality:
What possibility are offered to our field?
Abstract
The virtual reality (VR) provides us a three-dimensional, immersive, and fully interactive visualization environment. To make the best use of the VR’s potential in scientific visualization, a VR visualization software named VFIVE has been developed for the CAVE-type VR system. VFIVE enables simulation researchers to analyze three-dimensional scalar and vector fields by various visualization methods including real time volume rendering in the CAVE’s room sized booth. Some basic visualization tools of VTK have been integrated to VFIVE, too.
1 Introduction
The possibility offered by Virtual Reality (VR) to the simulation science is an innovation of the scientific visualization. VR visualization is not a theory, but rather already a practical technology that can be used in our daily research routine.
Simulation science is supported by two key technologies; computation and visualization. The technology of computation, or computer, is still keeping an exponential growth. In this sense, we are living in a golden age of simulation science. However, a high-rise building should be supported by balanced pillars. Unfortunately, the development of visualization technology does not catch up with its counterpart. It would be absurd if we had to spend a month to understand the simulation data obtained by one-hour-job on ultra super computer.
In the Stone Age of computer simulation when 1-dimensional (1-D) phenomena are mostly simulated, simple graph plot on a piece of paper would have been sufficient to understand or to visualize the data. When 2-D simulation were common, iso-line plots and contour color plots on papers or computer monitor screens would have been enough.
In the beginning of 1990’s, 3-D simulations with the grid size of was not rare. We familiarized ourselves with newly introduced visualization technology at that time; it was so called “visualization software” (such as AVS) on graphic workstations (GWS). We could instantly see an isosurface of data points through the GWS’s monitor. we could zoom, rotate, color the objects, and change the isosurface levels, via graphical user interface using the mouse. By the interactive manipulation through the GWS’s monitor, we could grasp 3-D structure of the numerical data. This visualization technology based on GWS was certainly powerful enough at that time.
Now, the complexity of target phenomena of the present high-end super computer, such as the Earth Simulator111 http://www.es.jamstec.go.jp/esc/eng/index.html , are extremely high; the typical grid size is . Even if we could make, render, and rotate an isosurface object on the grid points in real time on the GWS or PC with the advanced graphics card, the complicated shape itself of the isosurface prevents us from the intuitive and instant understanding of the 3-D structure of the scalar field.
Another limitation of the GWS-based visualization technology is the ability (or inability) of visualization of vector fields. In our research fields, fluid flows, electric fields, and magnetic fields are all 3-D vector fields. We need to grasp spatial structure of the 3-D vector fields defined on grid points in order to understand what was simulated in the simulation. This is really a challenging task and obviously beyond the outdated, GWS-based visualization technology. Simulation scientists really need an innovation in the visualization technology that suits the modern high-end super computer. And we believe that the virtual reality (VR) is the answer.
Everyone who experiences a modern VR system for the first time would be surprised by its high quality of mimicked reality. They feel like they are deeply absorbed, or really standing, in the mimicked world. In order to produce such a deep absorption into the VR world, there are three important visual factors222 Sonifications [Tamura:2001] and haptics are other important VR technology that could be applied in scientific visualization in future. ; (1) stereo view, (2) immersive view, and (3) interactive view. Among various kinds of available VR hardwares, we believe that the CAVE [Cruz-Neira:1993] system suits best to our purpose of the visualization of large scale 3-D scalar and vector fields. The CAVE is developed at Electric Visualization Laboratory (EVL), University of Illinois333 http://www.evl.uic.edu/info/index.php3. We installed our CAVE system at Earth Simulator Center, Japan Agency for Marine-Earth Science and Technology (JAMSTEC) in 2002, and named it BRAVE.
2 Hardware of VR Visualization: BRAVE

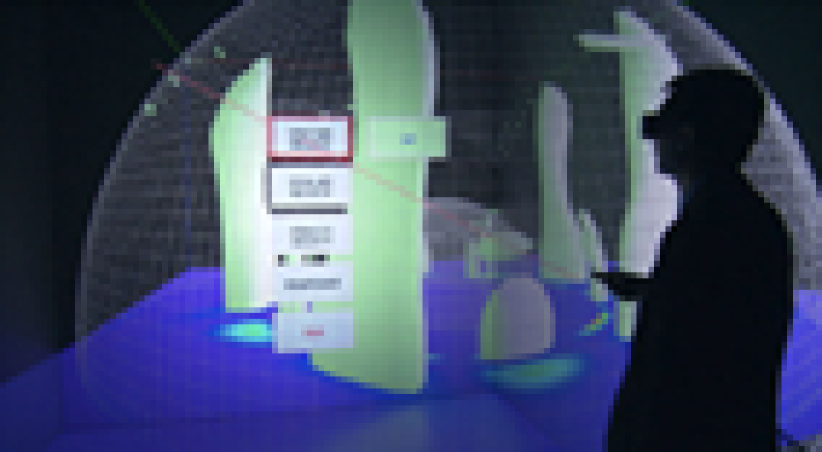
BRAVE is a cubic room with the size of . It has four stereo screens (three walls and a floor). See Fig. 1. The viewer stand in the BRAVE room on the floor screen, wearing stereo glasses, with a portable controller called wand. Stereo images are projected on the three walls and the floor by four projectors. Since the viewer inside the BRAVE room is surrounded by stereo images on the three walls and the floor, he or she can look around like a owl in the BRAVE room, keeping the wide range of stereo view angle. This strongly enhances the immersive sense of the viewer. The refresh rate of the image is 96 Hz: The right-eye image and the left-eye image are projected alternately with 48 Hz each. The image refresh is synchronized with the stereo glasses by the infrared. The images on the boundaries between the walls and the floor are smoothly connected. The viewer can easily forget the existence of the boundaries. Actually, some people had banged on the walls of the BRAVE.
BRAVE has a magnetic tracking system to detect the position and direction of the viewer’s eyes (by a sensor on the stereo glasses), and the viewer’s hand (by another sensor on the wand). All the projected images are automatically adjusted in real time following the viewer’s head motion. Therefore, everything looks natural from the viewer who can tilt, walk, sit, or even jump in the BRAVE room to observe 3-D objects in the virtual world.
The wand, which has 3 buttons and 1 joystick, is used to the interface with the virtual world (or simulation data). For example, when viewer presses a wand button, a virtual menu panel appears in front and he or she can choose a visualization method by shooting a menu box by a virtual laser beam emitting from the wand. If you presses another button, a virtual tracer particle appears at the tip of the wand, when he or she has chosen the particle tracer menu, and when the button is released, the particle “flies” under the eyes following the velocity field showing the flow structure by its trajectory. This kind of user interface of the wand is programmable with commercially available basic VR library called CAVE lib.
The OpenGL is used to model the virtual world; it is used to define the visualization objects and its illumination. A BRAVE application program, or more generally, a CAVE application program, is essentially a kind of common computer graphics (CG) software without the projection part which is automatically processed by the CAVE lib. So, if you are familiar with CG programming using OpenGL, it would be easy for you to make your own CAVE application.
3 Software of VR Visualization: VFIVE
Since most of simulation researchers are not familiar with CG programming, they feel it difficult to make their own visualization softwares for the CAVE. In order to help them, we have been developing a general purpose VR visualization software named VFIVE for the scientific VR visualization in the CAVE. The development of VFIVE started around 1999 [Kageyama:2000] and the latest stable version is v3.7. The present development version with major revise is v3.8. The very final version of VFIVE will be v5.
3.1 VFIVE v3.7
The basic design and core functions of VFIVE are almost fixed by v3.7, which are summarized in Table 1. A great emphasis was placed on fully interactive control of the visualization methods, data, and the user interface in the CAVE’s VR environment. For example, one can control the isosurface levels by vertical motion of the hand with the wand; it is also possible to change the slice position of orthoslicer by the wand’s motion. From our experience of using the CAVE as a scientific visualization tool from the end of 1990’s [Kageyama:1999], we see that a common pitfall is to use it just as a (very expensive) “3-D object viewer”. We should make the best use of CAVE’s VR features; that is stereo, immersive, and especially interactive view.
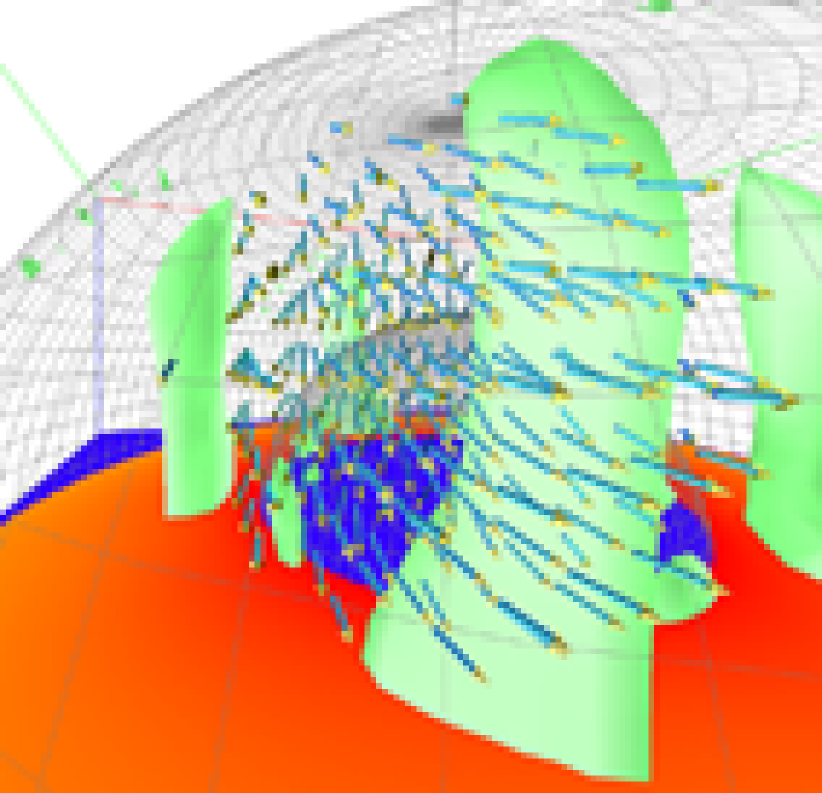
We implemented several kinds of visualization methods for vector fields. All of them make the best use the VR features of the CAVE. For example, vector arrows shows tens of small arrows around your hand, within an invisible sphere of diameter of 2 feet. The direction and length of each arrow show the vector at the point. As you move your hand, all the arrows follow your hand’s motion, changing the direction and length as the sampled point of each arrow changes in the vector field. The interpolation is automatically applied in real time.
| function | Figure | |
|---|---|---|
| user interface | virtual menu panel | fig. 2 |
| virtual laser beam | fig. 2 | |
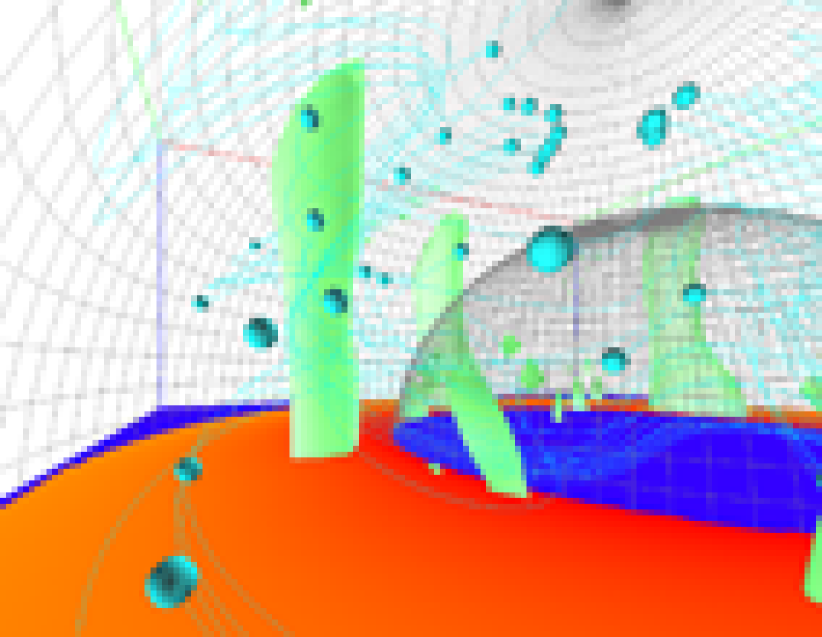
| scalar field vis. | ortho-slice planes | fig. 3 |
| local slice plane | not shown | |
| isosurface | fig 3 | |
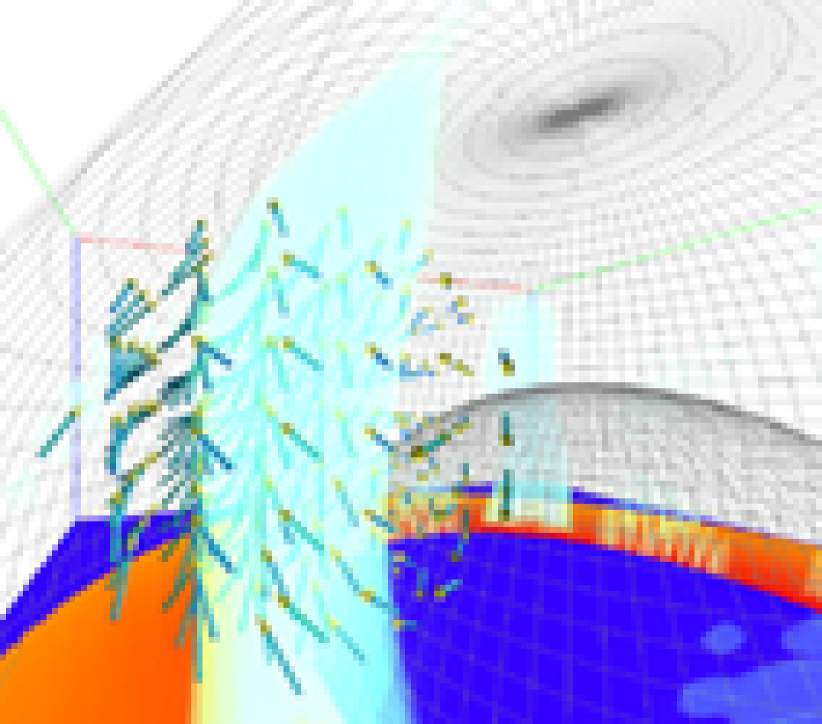
| vector field vis. | tracer particles | fig. 4 |
| field (force) lines | not shown | |
| vector arrows | fig. 5 | |
| spotlighted particles | now shown |
3.2 VFIVE v3.8
Recently, we have improved the VFIVE in two aspects: First, we included an important scalar visualization method that was missing in the previous version; volume rendering [Drebin:1988]. Another improvement is that we have integrated some basic modules of VTK444 http://public.kitware.com/VTK/ into VFIVE.
The volume rendering is a visualization method of scalar fields that is useful, for example, to show the distribution of plasma density of the 3-D global simulation of the magnetosphere. It is known that is highly localized near the Earth. The isosurface is not useful for the visualization of this kind of scalar field; you need to try nearly infinite number of different isosurface levels to grasp the overall 3-D distribution of . Similarly, the orthoslicer is not useful because one need to try a lot of slices to grasp 3-D distribution of . The volume rendering fits best to this kind of 3-D scalar field. We have developed a volume rendering module of VFIVE and slotted into v3.8.
Generally, the volume rendering is considered as a “heavy” visualization technique for the CAVE-type VR systems since it requires millions of ray cast calculation per second to realize the real time response to viewer’s eyes motion in the CAVE room. We succeeded in realizing a very fast volume rendering by the 3-D texture-map technique [Schroeder:2002]. In this technique, many semi-transparent texture mapped slices, which are orthogonal to the viewer’s line of sight, are pulled out from the a 3-D volumetric data. The 3-D volumetric data is made in advance from the scalar field (such as ) by specifying the colors and opacities of each box element (voxel). The texture slices are blended by the graphics card. Therefore, we can avoid the heavy calculations of software ray casting. This is the reason why we can carry out the fast volume rendering in the CAVE. For example, the refresh rate of the volume rendering shown in Fig. 6 (vorticity distribution of Earth’s outer core) is several frames per second, which is satisfactory for our visualization purpose.
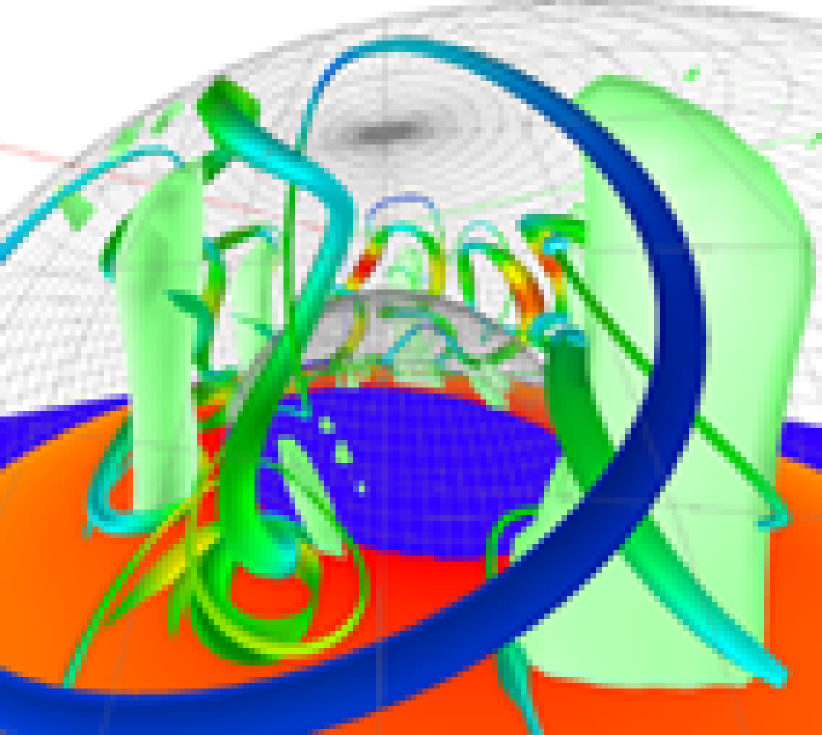
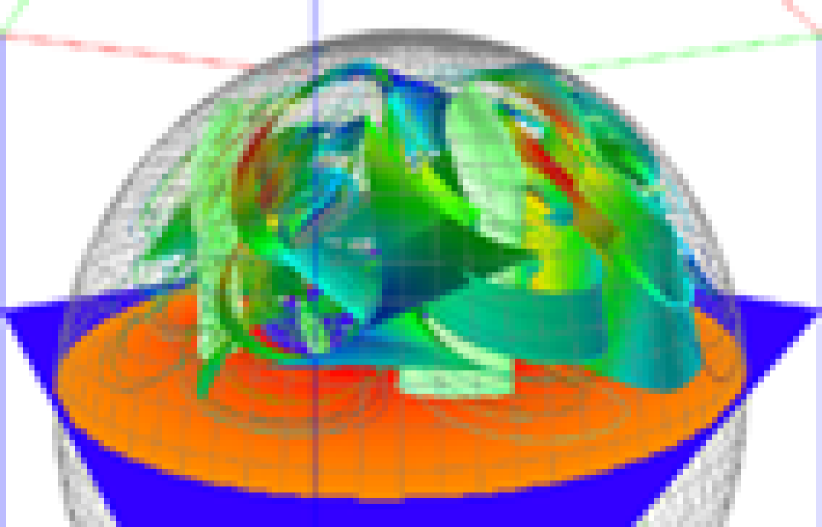
The VTK (Visualization Tool Kit) is an general visualization software that includes many visualization methods, from basic ones to sophisticated ones, with open source codes. It was an attractive idea for us to combine VFIVE’s interactive visualization environment in the CAVE with VTK’s sophisticated visualization gismos. Recently, we have succeeded to integrate some basic visualization methods of VTK into VFIVE v3.8. For instance, we can show VTK’s iso-contours, tubed flow lines (Fig. 7), stream surfaces (Fig. 8) in the BRAVE (see Table2).
| function | Figure | |
|---|---|---|
| scalar field vis. | volume rendering | fig. 6 |
| isocontours (VTK) | not shown | |
| vector field vis. | stream lines (VTK) | fig. 7 |
| stream surfaces (VTK) | fig. 8 |

4 Summary
There has been an serious imbalance between the computer technology and visualization technology. Ultra high performance of future computer would become futile existence if it were not for the symmetrical performance of the data visualization. The advanced visualization should be performed in a 3-D, interactive, and immersive environment, and it can be offered by the virtual reality (VR) technology.
We speculate that every super computer center in the world will install the CAVE-type VR facility for the VR visualization, and use the software like VFIVE for practical and productive visualization routine.
Acknowledgements.
We thank all the other members of Advanced Perception Research Group of Earth Simulator Center for their help in the development VFIVE v3.8. We also thank Prof. Tetsuya Sato, the director-general of Earth Simulator Center, for fruitful discussion and encouragement.References
- [1] Kageyama, A., Tamura, Y., and Sato, T., Scientific Visualization in Physics Research by CompleXcope CAVE System, Trans. Virtual Reality Soc. Japan, 4, 717–722, 1999.
- [2] Kageyama, A., Tamura, Y., and Sato, T., Visualization of Vector Field by Virtual Reality, Progress Theor. Phys. Suppl., 138, 665–673, 2000.
- [3] Cruz-Neira, C., Sandin, D. J., and DeFanti, T.A., Surrounded-Screen Projection-Based Virtual Reality: The Design and Implementation of the CAVE, ACM SIGGRAPH 93, 135–142, 1993
- [4] Drebin, R. A., Carpenter, L., and Hanrahan, P., Volume Rendering, Computer Graphics, 22, 65–74, 1988.
- [5] Schroeder, W., Martin, K., and Lorensen, B., section 7.5, in The Visualization Toolkit, Third Edition, 496 pp, Kitware Inc., New York, 2002.
- [6] Tamura, Y., Kageyama, A., Sato, T., Fujiwara, S., and Nakamura, H., Virtual Reality System to Visuailze and Aurolize Numerical Simulation Data, Comput. Phys. Comm., 142, 227–230, 2001.
- [7]