Analysis of airplane boarding via space-time geometry and random matrix theory
Abstract
We show that airplane boarding can be asymptotically modeled by 2-dimensional Lorentzian geometry. Boarding time is given by the maximal proper time among curves in the model. Discrepancies between the model and simulation results are closely related to random matrix theory. We then show how such models can be used to explain why some commonly practiced airline boarding policies are ineffective and even detrimental.
Airplane boarding is a process experienced daily by millions of passengers worldwide. Airlines have developed various strategies in the hope of shortening boarding time, typically leading to announcements of the form “passengers from rows 40 and above are now welcome to board the plane”, often heard around airport terminals. We will show how the airplane boarding process can be asymptotically modeled by spacetime geometry. The discrepancies between the asymptotic analysis and finite population results will be shown to be closely related to random matrix theory (RMT). Previously, airplane boarding has only been analyzed via discrete event simulations MMM ; VB ; VVH .
We model the boarding process as follows: Passengers are represented by coordinates , where is the index of the passenger along the boarding queue (1st, 2nd, 3rd and so on), and is his/her assigned row number. We rescale to . It is assumed that the main cause of delay in airplane boarding is the time it takes passengers to organize their luggage and seat themselves once they have arrived at their assigned row. The input parameters for our model are:
– Average amount of aisle length occupied by a passenger.
– Distance between successive rows.
– Number of passengers per row.
– Amount of time (delay) it takes a passenger to clear the aisle, once he has arrived at his designated row.
– The joint distribution of a passenger’s row and queue joining time. is directly affected by the airline policy and the way passengers react to the policy.
For the purposes of presentation, we shall assume that are all fixed. The airplane boarding process produces a natural partial order relation of blocking among passengers. Passenger blocks passenger if it is impossible for passenger to reach his assigned row before passenger (and others blocked by ) has sat down and cleared the aisle. Airplane boarding functions as a peeling process for the partial order defined by the blocking relation. At first, passengers who are not blocked by others sit down; these passengers are the minimal elements under the blocking relation. In the second round, passengers who are not blocked by passengers other than those of the first round are seated, and so forth. Boarding time thus coincides with the size of the longest chain in the partial order.
We assign to the boarding process with parameters a Lorentz metric defined on the unit square by
| (1) |
where and . There are two properties of the metric which relate it to the boarding process:
-
•
The volume form of the metric is proportional to the passenger density distribution .
-
•
The blocking partial order among passengers during the boarding process asymptotically coincides with the past-future causal relation induced by the metric on the passengers, viewed as events in space-time via their coordinate representation.
To establish the second property, consider passengers represented by and , . Consider the time passenger arrives at his designated row. All passengers with row numbers beyond , who are behind in the queue but in front of , will occupy aisle space behind . The number of such passengers is roughly . Each such passenger occupies units of aisle length, where we take the basic aisle length unit to be the distance between rows. The row difference between and is . We conclude that passenger is blocking passenger , via the passengers which are behind him, roughly when , a condition which coincides (together with ) with the causal relation induced by the metric. By the two main properties we may approximate asymptotically the airplane boarding process by the peeling process applied to the past-future causal relation on points in the associated spacetime, sampled with respect to the volume form. By a well-known result, 2-dimensional Lorentzian metrics are conformally flat, and hence, after an appropriate coordinate transformation, we may assume that the spacetime is given by a metric of the form
| (2) |
on some domain (not necessarily the unit square). In the new coordinates , which are lightlike coordinates, chains in the causal relation coincide with increasing (upright) subsequences, namely, sequences of points such that and for . The peeling process applied to the causal relation coincides in this case with patience sorting which is a well-known card game process, which computes the longest increasing subsequence in a permutation Ma ; AD .
Denote by the maximal proper time (integral over ) of a
timelike trajectory ending at and by the length
(integral over ) of the spacelike curve defined
by the equation .
Using the analysis of the size of maximal increasing subsequences given in VK ; DZ , the two basic properties lead
to the following modeling statements.
(A) The boarding time of passenger is approximately . In particular, the total boarding time is approximately , where is the maximal proper time of a curve in the unit square with respect to the Lorentzian metric.
(B) Let be the number of passengers with boarding time at most and . Then, .
Here the word ”approximately” is used to mean that the ratio between the two quantities tends to with probability 1 as the number of passengers tends to infinity.
We apply statement (A) to the analysis of boarding times. Consider first the case where the airline does not have a boarding policy, namely, passengers queue at uniformly random times, so that , and the corresponding metric is
| (3) |
We use this model to study the effect of airplane design parameters such as the distance between rows and the number of passengers per row on boarding time. These parameters affect boarding time through the parameter . To find the maximal proper time curve, we solve the Euler-Lagrange equation for proper time subject to the constraints of lying in the unit square. In figure 1 the maximal proper time curve is plotted for several values of the parameter . For the curve is contained in the interior of the square and is therefore a geodesic. The length of the curve is
| (4) |
For the maximal curve “crawls” at first along the -axis until reaching a point such that the geodesic between and has a vanishing derivative at . We have
| (5) |
We compared the above computations with simulations of the boarding process. In Figures 1 and 2 we show, for and , the computed maximal curve along with maximal chains obtained from simulations with , and . As can be seen from the figures, when , the longest chain clusters along the computed curves. The length of the maximal chain also matches well the estimated values derived from the spacetime model. For the length of the maximal chain in the simulation was , while the estimated value is , while for the corresponding values were and , respectively. For the more realistic values of passengers, there are substantial deviations of the maximal chain from the expected curve.
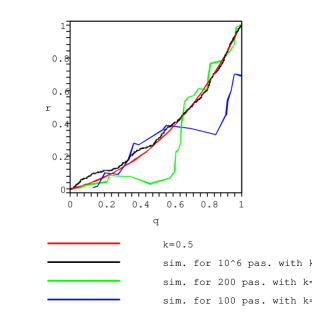
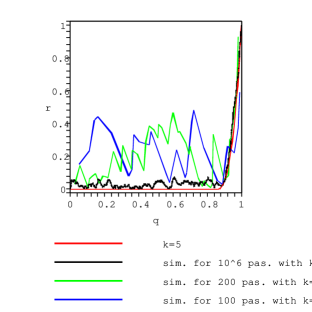
Table II presents the average boarding time results for 1000 simulations of the boarding process for several settings of and . We also provide the boarding time estimate computed via the spacetime model. Upon inspection, Table II shows that, for realistic values of , there are substantial differences in the range of 20-60 percent between the asymptotic boarding time estimates computed via Lorentzian geometry and the boarding time computed via simulations of the boarding process. These large differences correspond to the large deviations of the maximal chains from the expected curves as seen in Figures 1 and 2.
| simulation result | Space-time estimate | ||
|---|---|---|---|
| 0.5 | 100 | 18.1 | 22.8 |
| 0.5 | 200 | 26.8 | 32.2 |
| 2.0 | 100 | 23.0 | 32.5 |
| 2.0 | 200 | 34.7 | 45.8 |
| 5.0 | 100 | 29.0 | 47.5 |
| 5.0 | 200 | 44.9 | 66.9 |
We also note that in all cases the Lorentzian estimate is larger.
Let be the random variable representing the boarding time according to the boarding process model (the simulation results). We define the discrepancy random variable , which measures the difference between the boarding time and the Lorentzian estimate. The curvature of the metric given in (3) vanishes, and therefore we can apply a coordinate transformation which changes the metric to the form
| (6) |
As noted previously, in this case past-future causal chains correspond to increasing sequences of points. We also note that, since the spacetime points are sampled according to the volume form, they are uniformly distributed. The discrepancy has been studied in the context of increasing subsequences of uniformly distributed points in a rectangle with sides parallel to the coordinate axis BDJ , and for a right angle triangle with sides parallel to the coordinate axis BR . In both cases, the discrepancy has order of magnitude . In the case of the rectangle the normalized discrepancy is given asymptotically by the Tracy-Widom distribution TW , which measures the normalized discrepancy of the largest eigenvalue of an matrix in the Gaussian unitary ensemble (GUE) Mh , in comparison with . For uniformly distributed points in a right angle triangle with sides parallel to the axis, the normalized discrepancy is given asymptotically by the Tracy-Widom Distribution TW , which is the normalized discrepancy of the largest eigenvalue in the Gaussian symplectic ensemble (GSE). The averages for these distributions are and .
Let and . Let be the image under of the unit square. Let be the rectangle with sides parallel to the and axis and corners and , and denote by the above diagonal triangle in . is contained in , and when it contains the above diagonal triangle . The ratio of volumes equals for all , and thus, applying the estimates from BDJ and BR , we see that for , as becomes large we have
| (7) |
In particular, we obtain the finer estimate
| (8) |
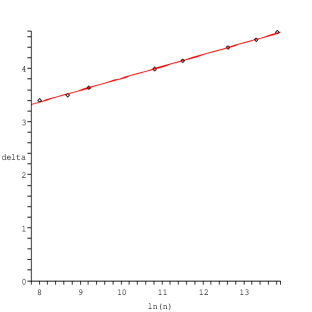
Looking at the results from Table II with , we see that the refined estimate (8) holds already for the realistic values ; indeed for and for . When the maximal curve contains a portion of the bottom edge of the unit square. Using the methods of Jo , it can be shown that in such cases . However, we do not know how to compute analytically the order of magnitude of the error. Figure 3 shows the behavior of for in Log-Log coordinates. As can be seen, the graph is essentially linear, and linear regression suggests the formula
| (9) |
The spacetime metrics given by (1) can be used for comparing different boarding policies. Boarding policies such as “passengers from row 40 and above board first, followed by the rest of the passengers” effect the passenger distribution function . We compared the results of the spacetime computations (without finer asymptotic corrections) with the results of detailed event driven simulations of boarding processes VB ; VVH , which compare different boarding policies. We computed spacetime based estimated boarding times for 25 different boarding policies with parameter . Results based on detailed trace driven simulations for the same policies are reported in VB . A comparison of the results shows that the spacetime estimates are in almost complete agreement with the trace driven simulation results regarding the ranking of the different policies. The correlation factor between the 25-dimensional boarding time vectors is . This is somewhat surprising given that the trace driven simulations in VB take into account many details of actual boarding processes which are not considered by our boarding process simulation. These include, among others, walking speed of passengers, passengers sitting at the wrong row and full overhead bins. The large discrepancies noted previously between the boarding simulation and the spacetime estimates are less of a factor, since when comparing boarding strategies only ratios of boarding times matter and these are less affected by the discrepancies. The main findings regarding actual boarding policies are:
- The commonly practiced back-to-front boarding policies, which attempt to board passengers from the back of the airplane first, are ineffective for realistic values of . The intuition behind this statement can be seen by the following simple reasoning. Assume the airline is perfectly successful in enforcing back-to-front boarding and thus passengers from the last row board first, followed by the passengers from row and so on. If , then passengers from all rows can sit concurrently without interference since they do not block each other. If then the passengers in row have to wait until at least some of the passengers from row have sat down, and similarly passengers from row have to wait for passengers from row to sit. This leads to a linear sized chain of blocking, which is much larger than the -sized chains in random boarding.
- Among row dependent policies which do not severely constrain passengers, random boarding (no policy) is almost optimal.
- One can improve any row dependent boarding policy (including random) by first allowing window seat passengers to board, followed by middle seat and finally aisle passengers. Such policies lower the delay parameter , which affects the metric via scaling.
There are other discrete random processes which can be modeled via 2-dimensional Lorentzian geometry in a similar manner. One example of interest is the Polynuclear growth (PNG) model, which is a particularly simple -dimensional growth process PS ; Me . The construction of the present paper can be considered as generalizing the mapping of Prahofer and Spohn PS of the basic PNG model to permutations. In this mapping the height of the PNG droplet corresponds to the length of the longest increasing subsequence in a random permutation. In terms of the airplane boarding process this corresponds to setting . More generally the methods of this paper provide a description of the macroscopic shape of a PNG droplet in an environment with non-uniform nucleation rates and lateral speeds.
In conclusion, we have shown that the airplane boarding process can be asymptotically modeled by a boarding parameter dependent two dimensional spacetime. The model can be used to analyze the dependence of boarding times on the various boarding parameters and boarding policies. The discrepancy between the asymptotic model and finite population results is closely related to RMT, at least for thin passengers. The analysis carries applications to the design of good airplane boarding policies.
We are grateful to Perci Deift, Ofer Zeitouni and Jinho Baik for very useful discussions.
References
- (1) S. Marelli, G. Mattocks and R. Merry, Boeing Aero Magazine 1, PAGE NUMBER (2000).
- (2) H. Van Landegham and A. Beuselinck, Euro. J. of Op. Res. 142, 294 (2002).
- (3) M. van den Briel, J. Villalobos and G. Hogg, Proc. of IERC (CD ROM only, 2003).
- (4) C.L. Mallows, Bull. Inst. Math. Appl. 9, 216 (1973).
- (5) D. Aldous and P. Diaconis, Bull. Amer. Math. Soc. 36, 413 (1999).
- (6) J.D. Deuschel and O. Zeitouni, Ann. of Prob. 23, 852 (1987).
- (7) A. Vershik and S. Kerov, Soviet Math. Dokl. 18, 527 (1977).
- (8) J. Baik, P. Deift and K. Johansson, J. Amer. Math. Soc. 12, 1119 (1999).
- (9) J. Baik and E. Rains, Duke J. of Math 109, 205 (2001).
- (10) C.A. Tracy and H. Widom, Commun. Math. Phys. 159, 151 (1994); 177, 727 (1996).
- (11) M.L. Mehta, Random Matrices, (Academic press, 2004).
- (12) K. Johansson, Commun. Math. Phys. 209, 437 (2000).
- (13) M. Prahofer and H. Spohn, Phys. Rev. Lett. 84, 4882 (2000).
- (14) P. Meakin, Fractals, Scaling and Growth Far from Equilibrium (Cambridge University Press, Cambridge, England, 1998).
- (15) M. Andrews, M. Bender and L. Zhang, Algorithmica 32, 277 (2002).
- (16) E. Bachmat, Proc. of Symp. Th. of Comp., 277 (2002).