Measurement of atomic diffraction phases induced by material gratings
Abstract
Atom-surface interactions can significantly modify the intensity and phase of atom de Broglie waves diffracted by a silicon nitride grating. This affects the operation of a material grating as a coherent beam splitter. The phase shift induced by diffraction is measured by comparing the relative phases of serveral interfering paths in a Mach-Zehnder Na atom interferometer formed by three material gratings. The values of the diffraction phases are consistent with a simple model which includes a van der Waals atom-surface interaction between the Na atoms and the silicon nitride grating bars.
pacs:
03.75.Be, 03.75.Dg, 39.20.+q, 34.20.CfA coherent beam splitter is a useful component for constructing an atom interferometer Berman (1997). The purpose of the beam splitter is to generate a quantum superposition of atom waves, propagating along two paths which can be recombined to form an interference pattern. The contrast and phase of the interference pattern can then be used to study interactions that affect the atoms differently in the two interferometer paths. However, atom beam splitters formed using laser light Weitz et al. (1994); Durr et al. (1998); Buchner et al. (2003) and material grating structures Perreault et al. (2005) can create beams with differing complex amplitudes. A familiar analogy of this in optics occurs for light beam splitters formed using glass plates, thin metal films, and multi-layer dielectric stacks which all cause a phase shift between the reflected and transmitted components Born and Wolf (1999). These complex amplitudes are an important concern when building an atom interferometer since they affect the phase and contrast of the interference pattern, and have been identified as a source of uncertainty for atom interferometer gyroscopes Gustavson et al. (2000). Here we present the first evidence of beam splitter induced phase shifts in an atom interferometer based on material gratings and a new method for measuring these phase shifts for interferometers that utilize diffraction.
The van der Waals (vdw) atom-surface interaction Milonni (1994) plays a significant role in determining the intensity and phase (diffraction phase) of atom waves split by a material grating. Several atom-optics experiments have observed how atom-surface interactions can affect the intensity of atom waves Grisenti et al. (1999); Cronin and Perreault (2004); Perreault et al. (2005). By comparison, few experiments have directly measured the diffraction phases induced by atom-surface interactions Perreault and Cronin (2005). In this Letter the first and second order diffraction phases are measured by comparing the phase difference between the various interfering paths in a three grating Mach-Zehnder atom interferometer.
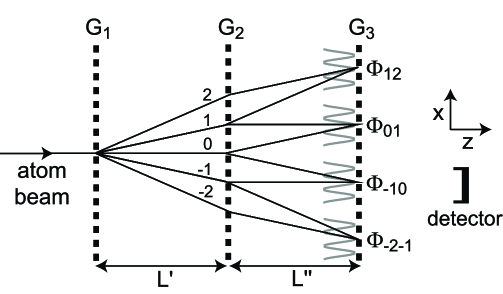
The experimental setup used to measure the atomic diffraction phases induced by a material grating is shown in Fig. 1. A Mach-Zehnder atom interferometer, similar to the one described in Keith et al. (1991), is formed using zeroth and first order diffraction from three 100 nm period silicon nitride gratings Savas et al. (1996) which are denoted ,,. These gratings are nominally separated by 1 m. A collimated supersonic Na atom beam is first diffracted by grating , inducing a phase shift which depends on the diffraction order and will be described later. Each diffracted beam then undergoes first order diffraction by and forms a spatial interference pattern just before . The atoms transmitted through are ionized by a m wide hot Re wire and counted by a channel electron multiplier. Grating is then scanned in the direction transverse to the incident atom beam (x-axis) to determine the phase of the interference pattern. While there are many paths which can interfere at the plane of only the ones which involve first order diffraction by (as indicated in Fig. 1) will lead to a significant interference signal because of velocity dispersion and the use of as a transmission mask. Since each relevant path through undergoes first order diffraction both paths acquire the same diffraction phase, which means there is no net phase shift induced by . In addition, grating acts as a transmission mask so only the diffraction phases induced by will lead to a relative phase shift between the interfering paths. In principle, the diffraction phases can then be determined by comparing the phase of the various interferometer outputs which can be measured separately by moving the detector along the x-axis.
In practice there are two types of phase shifts that need to be considered when predicting the relative phase of the various interferometer outputs. One originates from the diffraction phase induced by and the other from a distance mismatch between the gratings ,,, which is denoted by in Fig. 1. In order to report a measurement of the diffraction phases, expressions for both of these phase shifts will be put forth.
From previous work it has been shown that atomic diffraction from a material grating will create diffracted beams with complex amplitudes given by
| (1) |
where is the amplitude and is the diffraction phase for a given diffraction order as derived in Cronin and Perreault (2004); Perreault et al. (2005); Perreault and Cronin (2005). The variable is the position measured from the center of the grating window whose size is and grating period is . The expression in Eqn. 1 is valid in the far-field (Fraunhofer) diffraction regime and is appropriate for our experimental setup as described in Perreault et al. (2005). The phase represents the phase accumulated by the atom wave as it propagates through the grating window, given by the WKB approximation to leading order in as
| (2) |
where is the thickness of the grating, is Planck’s constant and is the atom beam velocity Perreault et al. (2005). The atom-surface interaction potential in Eqn. 2 is given by
| (3) |
where is coefficient describing the strength of the vdW interaction. This form of the vdW potential is valid for atom-surface distances of m for Na atoms and neglects the finite thickness of the grating bars Milonni (1994); Perreault et al. (2005). A plot of diffraction phases and amplitudes are shown in Fig. 2 as a function of .

There is also a phase shift between the interferometer outputs induced by a distance mismatch of the gratings ,, along the z-axis. The origin of this phase shift can be understood by recalling that when two plane waves interfere at an angle , interference fringes will be formed with intensity maxima along lines with an angle as described in Hecht (1998). In other words, a spatial interference pattern of the form with wave number will be observed. If the paths depicted in Fig. 1 are regarded as plane waves interfering at an angle then by geometry an effective phase shift
| (4) |
will be observed if there is a distance mismatch between the interferometer gratings. For two general paths originating from the diffraction orders of the effective phase shift induced by will be given by , since the fringe maxima are just rotated by an angle with respect to the z-axis.
The expressions for the diffraction phase (Eqn. 1) and grating distance mismatch phase (Eqn. 4) can then be used to specify the wave function just before grating
| (5) |
for any two interfering paths involving the diffraction orders of grating . The wave functions and describe the two atom beams corresponding to a given interferometer output and accounts for the diffraction phases and amplitudes through the relations
| (6) |
and
| (7) |
where and are given by Eqn. 1. The intensity can then be found in the usual way
| (8) | |||||
where and are the observed contrast and phase for a given interferometer output involving the diffraction orders as depicted in Fig. 1. The measured interferometer phase
| (9) |
can also be expressed in terms of the diffraction phases and grating mismatch phase shift . From Eqn. 9 it can be seen that , as implied by the symmetry of the interferometer.

Equations 8 and 9 can now be used to predict the phase shift between the various interferometer outputs shown in Fig 1. One noteworthy aspect of Eqn. 9 is the possibility for to be made zero if the diffraction phase term is cancelled by the appropriate choice of . To verify this prediction the phase difference was measured as a function of and the results are shown in Fig. 3. The atom beam velocity m/s ( Å) was measured independently by observing the diffraction pattern generated by when the other gratings are removed. Equations 4 and 9 can then be used to generate the solid curve in Fig. 3, since the grating period is known to be nm. The data agree quite well with our theory considering that there are no free parameters in the solid curve. At this point is known only up to some offset which can be interpreted as the grating distance mismatch which leads to the special case of . However, the value of will be determined next using another independent measurement technique.
As is shifted further from zero the partial spatial and temporal coherence of the atom beam causes the measured interference contrast to decrease. This notion is evident in the experimental data presented in Fig. 4, which plots the observed interference contrast as a function of . This contrast peak can be used to determine the offset , which then specifies the value of through Eqns. 4 and 9. For our particular atom beam setup spatial coherence was the dominant mechanism responsible for the contrast reduction.
The spatial coherence of the atom beam is determined by the spatial extent of the atom beam source, and describes the correlation of different transverse points of the wave function. When mm there is about 60 nm of shear (i.e. transverse displacement) between the two interfering beams, since rad. As a result the contrast will be reduced because the regions of overlap for the two interfering wave functions will be less correlated when there is nonzero shear. The van Cittert-Zernike theorem states that the contrast will be reduced in a way that is related to the spatial Fourier transform of the atom beam source profile Born and Wolf (1999). If the source intensity distribution is assumed to be then the contrast will be reduced according to
| (10) |
where is collimation slit width, is distance from the collimation slit to , and is the amount of induced shear. Equation 10 is similar to one found in Champenois et al. (1999) derived using a different method. The best fit to the data in Fig. 4 using Eqn. 10 yielded a value of m. Since nm and m, a best fit value of m was found to be consistent with the data, according to Eqn. 10.
Given the data in Figs. 3 and 4 the best fit value of implies that rad, according to Eqn. 4. The diffraction phase rad was measured recently in Perreault and Cronin (2005), which yields the first order diffraction phase rad. This value for is consistent with the value predicted by Eqn. 1, as summarized in Table 1.

By moving the detector so that it intercepts the different interferometer outputs indicated in Fig. 1 the higher order diffraction phases can be determined. The measured contrast, phase, and intensity is shown in Fig. 5 as a function of detector position. From Fig. 5 the phase rad can be determined. Equation 9 then implies that rad, which finally leads to rad. This value compares well to that predicted by Eqn. 1, as shown in Table 1.
In conclusion the atomic diffraction phases induced by a material grating structure have been measured for . This was accomplished by comparing the relative phases of the various outputs of a three-grating Mach-Zehnder atom interferometer. These measurements agree with a simple model that includes a vdW atom-surface interaction between the Na atom beam and the silicon nitride grating. In the future, one could simultaneously monitor and with two detectors, while applying some interaction to say the arm. One could then perform self-referencing phase measurements with the interferometer, eliminating the need to take control data in a serial fashion. In this type of application knowledge of the diffraction phases observed here would be required.
This work was supported by Research Corporation and the National Science Foundation Grant No. 0354947.
References
- Berman (1997) P. R. Berman, ed., Atom Interferometry (Academic Press, 1997).
- Weitz et al. (1994) M. Weitz, B. C. Young, and S. Chu, Phys. Rev. A 50, 2438 (1994).
- Durr et al. (1998) S. Durr, T. Nonn, and G. Rempe, Nature 395, 33 (1998).
- Buchner et al. (2003) M. Buchner, R. Delhuille, A. Miffre, C. Robilliard, and J. Vigue, Phys. Rev. A 68, 013607 (2003).
- Perreault et al. (2005) J. D. Perreault, A. D. Cronin, and T. A. Savas, Phys. Rev. A 71, 053612 (2005).
- Born and Wolf (1999) M. Born and E. Wolf, Principles of Optics (Cambridge University Press, 1999).
- Gustavson et al. (2000) T. L. Gustavson, A. Landragin, and M. A. Kasevich, Class. Quantum Grav. 17, 2385 (2000).
- Milonni (1994) P. W. Milonni, The Quantum Vacuum (Academic Press, 1994).
- Grisenti et al. (1999) R. E. Grisenti, W. Schollkopf, J. P. Toennies, G. C. Hegerfeldt, and T. Kohler, Phys. Rev. Lett. 83, 1755 (1999).
- Cronin and Perreault (2004) A. D. Cronin and J. D. Perreault, Phys. Rev. A 70, 043607 (2004).
- Perreault and Cronin (2005) J. D. Perreault and A. D. Cronin, arXiv:physics/0505160 (2005).
- Keith et al. (1991) D. W. Keith, C. R. Ekstrom, Q. A. Turchette, and D. E. Pritchard, Phys. Rev. Lett. 66, 2693 (1991).
- Savas et al. (1996) T. A. Savas, M. L. Schattenburg, J. M. Carter, and H. I. Smith, J. Vac. Sci. Tech. B 14, 4167 (1996).
- Hecht (1998) E. Hecht, Optics (Addison Wesley Longman, 1998).
- Champenois et al. (1999) C. Champenois, M. Buchner, and J. Vigue, Eur. Phys. J. D 5, 363 (1999).