Modeling innovation by a kinetic description of the patent citation system
Abstract
This paper reports results of a network theory approach to the study of the United States patent system. We model the patent citation network as a discrete time, discrete space stochastic dynamic system. From data on more than 2 million patents and their citations, we extract an attractiveness function, , which determines the likelihood that a patent will be cited. is approximately separable into a product of a function and a function , where is the number of citations already received (in-degree) and is the age measured in patent number units. displays a peak at low and a long power law tail, suggesting that some patented technologies have very long-term effects. exhibits super-linear preferential attachment. The preferential attachment exponent has been increasing since 1991, suggesting that patent citations are increasingly concentrated on a relatively small number of patents. The overall average probability that a new patent will be cited by a given patent has increased slightly during the same period. We discuss some possible implications of our results for patent policy.
I Introduction
Innovation plays a key role in economic development and the patent system is intended (and Constitutionally required in the United States) to promote innovative progress. The patent system promotes innovation by giving inventors the power to exclude others from using their inventions during the patent term. The power to exclude is a double-edged sword, however, benefiting the original inventor, but imposing costs on later innovators seeking to build on past inventions. Thus, the proper design of the patent system is an important matter – and a matter of considerable current debate. See, e.g., Jaffe and Lerner (2004); Federal Trade Commission (2003); Merrill et al. (2004). Advances in computer technology and the availability of large patent databases have recently made it possible to study aspects of the patent system quantitatively. To date the empirical analysis of the patent system has been undertaken by economists and some legal scholars. See, e.g., Jaffe and Trajtenberg (2003); Allison et al. (2004); Moore (2005). Because patents and the citations between them can be conceptualized as a growing network, however, techniques from statistical physics that have been used in the study of complex networks can be usefully applied to the patent citation network Albert and Barabási (2002); Newman (2003). In this paper we present what we believe to be the first results of a network theory approach to the patent system. We explore the kinetics of patent citation network growth and discuss some possible implications for understanding the patent system.
The paper is organized as follows: In Section II we provide background on the United States patent system and describe the citation data that is used in this study. In Section III we describe a general framework for modeling the kinetics of citation networks, define an “attractiveness function” for the evolving network and introduce an iterative method for extracting the attractiveness function from the data. In Section IV we apply this approach to analyze the US patent citation network and explore the changes in the kinetics from 1976 to 2000. In Section V we discuss some possible implications of our results, and mention directions for future research.
II Patentological background
While a similar approach could be applied to many patent systems, including the very important European and Japanese patent systems, we begin our analysis with the United States patent system for which an extensive database of citations has been made available through the work of economists Hall, Jaffe, and Trajtenberg Hall et al. (2003).
An application for a U.S. Patent is filed in the U.S. Patent and Trademark Office (USPTO). A patent examiner at the USPTO determines whether to grant a patent based on a number of criteria, most of important of which for present purposes are the requirements of novelty and non-obviousness with respect to existing technology. Once a patent is issued by the USPTO, it is assigned a unique patent identification number. These numbers are sequential in order of patent grant.
Novelty and nonobviousness are evaluated by comparing the claimed invention to statutorily defined categories of “prior art”, consisting in most cases primarily of prior patents. Patents are legally effective only for a limited term (currently twenty years from the date of application), but remain effective as “prior art” indefinitely. Inventors are required to provide citations to known references that are “material” to patentability, but are not required to search for relevant references (though they or their patent attorneys often do so). During consideration of the application, patent examiners search for additional relevant references.
Patent citations reflect potential prior art that was considered by the examiner. They thus reflect the judgment of patentees, their attorneys, and the USPTO patent examiners as to the prior patents that are most closely related to the invention claimed in an application. Patent citations thus provide, to some approximation, a “map” of the technical relationships between patents in the U.S. patent system. This “map” can be represented by a directed network, the nodes being the patents and the directed edges the citations. Our research uses a statistical physics approach inspired by studies of other complex networks to attempt to gain insight from that “map”.
The patent database we use for the analysis in this paper was created by Hall, Jaffe and Trajtenberg based on data available from the US Patent Office Hall et al. (2003). It is available online at http://www.nber.org/patents/. The database contains data from over 6 million patents granted between July 13, 1836 and December 31, 1999 but only reflects the citations made by patents after January 1, 1975: more than 2 million patents and over 16 million citations. Citations made by earlier patents are also available from the Patent Office, but not in an electronic format. The Hall, Jaffe and Trajtenberg database also contains additional data about the included patents, which is described in detail in Hall et al. (2003).
III Modeling patent citation networks
III.1 Defining the model framework
In this section we define the mathematical model framework we will use for studying patent citations. This framework is a discrete time, discrete space stochastic dynamic system. Time is measured in patent number units. We often “bin” the data from a range of patent numbers to obtain sufficient statistics for the analysis. In our model, each patent is described by two variables:
-
1.
, the number of citations it has received up to the current time step and
-
2.
, the age of the patent, which is simply the difference between the current time step (as measured in patent numbers) and the patent number. Because a given patent may cite more than one other patent, several citations may be made in one time step.
These two variables define what we call the “attractiveness” of a patent, which determines the likelihood that the patent will be cited when the next citation is made. In every time step the probability that an older patent will be cited is proportional to the older patent’s attractiveness multiplied by the number of citations made in that time step. We find that this simple model gives a very good approximation of the observed kinetics of the growth of the patent citation network.
More formally, the state of the system is described by and , , where is the patent number of the last patent studied and and are the in-degree and age, respectively, of patent at the beginning of time step . The attractiveness of any node with in-degree and age is denoted by . is defined such that the probability that node will be cited by a given citation in time step is given by
| (1) |
where is the total attractiveness of the system at time step .
| (2) |
The total probability that node will be cited in time step is thus , where is the number of citations made by patent . and are defined up to an arbitrary normalization parameter. To normalize, we arbitrarily define . With this normalization, is the inverse probability that a “new” node, with and , will be cited by a given citation during the next time step.
The function determines the evolution of the network. It describes the average citation preferences of the citing patents (the inventors and patent examiners in reality). In this study, we measure and analyze for the United States patent system during the time period covered by our data. We find first that the parameterization by and consistently describes the average kinetics of the patent citation network. Of course, underlying patent citations are patentee and patent examiner evaluations of the significance of the cited patent and the technological relationship between the citing and cited patents that our probabilistic approach cannot capture. The way in which these “microscopic dynamics” are translated into the average behavior that we observe remains an open question.
In the following part of this section we will explain our method for measuring the and functions for a given network. We believe that this method may be usefully applied to other networks as long as the necessary data is available.
III.2 Measuring the attractiveness function
Let us assume that edges are added to the system one after another in a fixed order; if two edges are added in the same time step (i.e., by the same citing patent), their order is fixed arbitrarily for the measurement. Let be an edge and let be indicator random variables, one for each triple, , where is the total number of edges in the system. is one if and only if edge cites a ) node (i.e., a node having in-degree and age ) and zero otherwise. The probability that edge cites a node, i.e., that is one, is thus given by
| (3) |
where is the time step during which edge is added, is the total attractiveness of the system right before adding edge , and is the number of nodes in the network right before adding edge . We thus have a formula for :
| (4) |
In (4) it is easy to determine for any , but is unknown. Moreover, we have only a single experiment for which is not enough to approximate properly. To proceed further, let us define a new set of random variables, each of which is a simple transformation of the corresponding variable:
| (5) |
If then is not defined. It is easy to see that the expected value of any variable (if defined) is ; thus we can approximate by
| (6) |
Here is the number of edges for which for any , and is the realization of in the network being studied.
To calculate this approximation for we need to determine , which itself is defined in terms of . To determine and self-consistently, we use the following iterative approach:
-
1.
First we assume that is constant, and use (6) to compute , normalizing the values such that .
-
2.
Then we calculate for each based on and use this to determine .
-
3.
We repeat this procedure until the difference between and is smaller than a given small for all .
To check this iterative method, we have applied it to various well-known models of growing networks, such as the Barabasi-Albert model Barabási et al. (1999). In these tests the method yielded the correct form of the function, which, for the BA-model, for example, is . While these tests gave very good agreement overall they also suggested that the method cannot accurately measure the attractiveness of young nodes (small ) with high in-degree (high ), as these occur very rarely in any finite sample network.
IV Results
IV.1 The attractiveness function

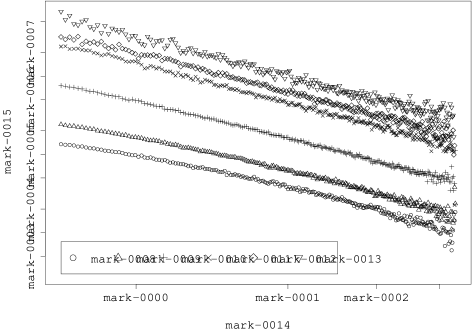
The analysis method described in the previous section was applied to the patent citation network and the forms of and were determined. Figures 1 and 2 show sections of the function and Figure 3 shows (which is also the inverse of the probability that a “new” node with and will be cited). For all the figures in this paper we have binned the age values into 300 bins, each containing 7172 patents. Ages and times are measured in patent number units. Figures 1 and 2 suggest that, for the patent network, the effects of in-degree and age can be separated to good approximation and that can be written approximately in the form
| (7) |
While this is a reasonable and useful approximation, it is also clear that it is only approximately true. e.g., decays faster than , see the second plot in Figure 1.
The measured function for the patent citation network has two major features – a peak at approximately 200,000 patent numbers and a slowly decaying tail. (The very large absolute values of are a result of the normalization, , and are of no independent significance.) The peak at 200,000 patent numbers corresponds to a large number of what might be called “ordinary”, relatively short-term citations. In 1998–1999, 200,000 patent numbers corresponded to about 15 months. The tail is best described by a power-law decay: with . The observation of this power law decay is an important result. It indicates that while typical citations are relatively short-term, there are a significant number of citations that occur after very long delays. Very old patents are cited, suggesting that the temporal reach of some innovations, which perhaps can be described roughly as “pioneer”, is very long indeed. Moreover, because is approximately independent of – i.e., approximately the same power law decay is observed even for small – the power law tail of demonstrates that there is a significant possibility that patents that have gone virtually un-cited for long periods of time will reemerge to garner citations. This slow power law decay of thus suggests the unpredictability of innovative progress.

The measured function increases monotonically with , as Figure 2 suggests. Higher in-degree always means higher attractiveness. Since the citation probability is proportional to the attractiveness, this means that the well-known preferential attachment, or “rich get richer” effect is at work here – the more citations a patent has received, the more likely it is to receive another. The functional form of is a power law over the entire range of values. , where and . We estimated these parameters using the smaller values of , for which we have more data, and the first 100 age bins. We then checked the results by comparing with more extensive fits.
Preferential attachment and its variations are well studied, see the reviews by Albert and Barabasi Albert and Barabási (2002) and by Newman Newman (2003). Linear preferential attachment () without aging has been shown to result in a degree distribution (frequency of nodes with degree ) with a power law tail Albert and Barabási (2002); Newman (2003). Krapivsky et al. Krapivsky et al. (2000) have studied nonlinear preferential attachment. In the model they studied there was no aging, . For , as is observed in the patent citation network, their calculations predict a condensation of node connectivity, in the sense that with high probability most of the edges are connected to only a small number of nodes. More specifically, in their model, if the number of nodes with more than incoming edges is finite, even in an infinite network. For the patent network suggesting that, if there were no aging, the number of patents receiving more than 6 citations would be very small, though those patents would account for a large fraction of all of the citations. Aging complicates this picture, of course, and likely precludes a complete condensation onto a few nodes. However, the fact that the observed preferential attachment is super-linear does indicate a tendency toward what might loosely be called “stratification” – many nodes with very few citations and a few nodes with many citations.
IV.2 The total attractiveness
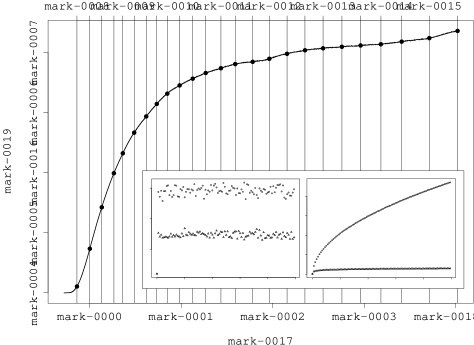
The total attractiveness function, , (see Fig. 3) of the US patent system increases with time. The initial steep increase is only a finite size effect and comes from the fact that the citations made by pre-1975 patents are missing from our database. From about 1984 on, however, displays a slow but steady increase. One way to interpret this increase is that the probability that a patent will be cited by a given citation (which is proportional to ) is decreasing as the size of the network increases. The decrease is determined in part by the rate at which patents age, which determines the number of patents “available” for citation.
To better understand the behavior of the function, we simulated two simple growing network models with two different “toy” functions, with linear preferential attachment and two different forms of age dependence:
| (8) | ||||
| (9) |
and were determined for these models, see Fig. 3, inset. In these models a single edge was added to the network at each time step.
When the attractiveness function decays exponentially with age (Model 1), the total attractiveness fluctuates around a constant value, which is determined by and is independent of the system size. In Model 1 the probability that a new node will be cited by a particular citation is thus always the same. The exponentially decaying age dependence means that the effect of very old nodes is negligible; there is effectively a constant-sized “band” of recent nodes that remain “citable”. In a patent citation system, such an exponential age dependence would imply, contrary to our observations, that the importance of innovations is short-lived.
In Model 2, the behavior of depends on . If is below a limit value (which is about 1), is sharply increasing. If is between and another limit, (which is about 1.5) increases slowly. When is higher than , fluctuates around a constant value, as does . Thus Model 2 exhibits a crossover from a regime of slowly decaying age dependence in which old nodes remain influential, to a regime of more rapidly decaying age dependence in which old nodes are “forgotten”. These results are in good agreement with other theoretical studies about aging and preferential attachment; see the work by Dorogovtsev and Mendes Dorogovtsev and Mendes (2000), Zhu et al. Zhu et al. (2003), Klemm and Eguluz Klemm and Eguíluz (2002).
These simple models would suggest that the patent citation network (which has an aging exponent of about 1.6 – above – should have roughly constant in time. Indeed, a third toy model with superlinear preferential attachment (exponent 1.2) and power-law aging (exponent 1.6) displayed a roughly constant . However, the observed for the patent system increases with time.
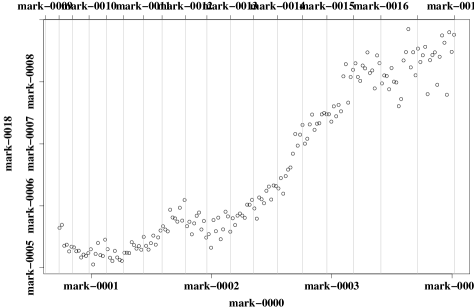
The explanation for this apparent contradiction lies in the fact that the average number of citations made by each patent (and hence, since we measure time in units of patents, the number of citations made in each time step, ), has increased approximately linearly with time in the real patent citation network, e.g., it was 4.69 in 1975 and 10.66 in 1999. See Fig. 4. A modified simulation with superlinear preferential attachment (exponent 1.2) and power-law aging (exponent 1.6), but with linearly increasing number of citations per time step confirmed that, as in the real patent data, the increasing number of citations made in each time step results in an increasing overall attractiveness, .
The probability that patent will be cited in a given time step (in other words, by a particular patent rather than by a particular citation) is
| (10) |
The probability that a new patent will be cited by the next patent is thus given by , which is shown in Fig. 4. From this plot one can see that the increase in the number of citations being made outweighs the increase in , so that the probability that a new patent will be cited has increased over time, despite the increasing . Patents do not get “lost in the crowd” the way we might have predicted from the simple models. Instead, patentees and patent examiners have on average increased the number of citations made by each patent to more than compensate for the increasing .
IV.3 Change in the patent system dynamics
While it is well known that there has been a significant increase in the number of US patents granted per year since 1984 Jaffe and Lerner (2004); Hall (2005), the underlying reason for this increase is not clear. Has there simply been an acceleration of technological development in the last twenty years or has there been a more fundamental change in the patent system, perhaps, as many have suggested, as a result of increased leniency in the legal standard for obtaining a patent Jaffe and Lerner (2004). A complete answer to this question is far beyond the scope of the present investigation. However, our kinetic model does permit us to ask whether there has been any deep change in the growth kinetics of the patent citation network. Because we measure time in units of patent number, a mere acceleration of technological progress should leave unchanged in patent number “time”. A change in indicates some other source of change.
Thus far, we have assumed a time-independent , which is reasonably consistent with our observations. In this section, we relax this assumption to ask the more subtle question of whether there has been a change in patent system kinetics over and above the acceleration that is already reflected in our choice of time units. Specifically, we allow and to vary with time and ask whether there has been a significant change in these parameters between 1980 and 2000.
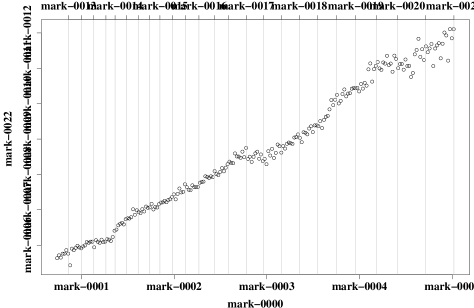
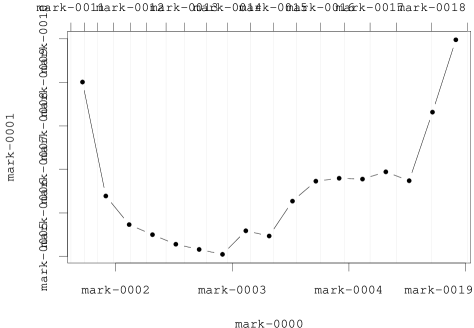
To answer this question we measured the parameters of the system as functions of time. To perform the fits, we averaged over a 500,000-patent sliding time window and calculated the parameters after every 100,000 patents. The measured parameters are plotted in Figure 5. There is a significant variation over time. The time dependence of the important parameter was also explored, but no significant time dependence was observed to within the statistical errors.
The plot for the parameter shows that there are two regimes. In the first regime, prior to about 1991, is decreasing with time, while in the second, starting around 1991, there is a significant increase. As noted earlier, the parameter has some very important consequences for the growth of the network: the higher , the more “condensed” or “stratified” the network will be. The increasing in the patent citation network indicates increasing stratification – a smaller and smaller fraction of the patents is receiving a larger and larger fraction of the citations. This change is not simply a result of accelerating numbers of patents being granted, but suggests a more fundamental change in the distribution of patents that are being issued.
V Conclusions
We have presented a stochastic kinetic model for patent citation networks. Though a complex process underlies each decision by a patent applicant or examiner to cite a particular patent, the average citation behavior takes a surprisingly simple form. The citation probability can be approximated quite well by the ratio of an “attractiveness function”, , which depends on the in-degree, , and age in patent numbers, , of the cited patent, and a time-dependent normalization factor, , which is independent of and .
We introduced a method to extract the and functions of a growing network from a specification of the connection history. We applied this technique to the patent citation network and, though no assumptions were made as to the functional form of , the measured function was well described by two approximately separable processes: preferential attachment as a function of in-degree, , and power law age dependence. The interplay of these two processes, along with the growth in the number of citations made by each patent, governs the emerging structure of the network. Particularly noteworthy are our finding that the preferential attachment is super-linear, implying that patents are highly stratified in “citability”, and our finding of a power law tail in the age dependence even for small , indicating not only that some patents remain important for very long times, but also that even “dormant” patents can re-emerge as important after long delays.
We also used our technique to investigate the time dependence of the growth kinetics of the patent citation network. Overall, we find that the increasing number of patents issued has been matched by increasing citations made by each patent, so that the chance that a new patent will be cited in the next time period has even increased over time. This result suggests that on average patents are not becoming less “citable”. However, we also find that there has been a change in the underlying growth kinetics since 1991. Since 1991, preferential attachment in the patent system has become increasingly strong, indicating that patents are more and more stratified, with fewer and fewer of the patents receiving more and more of the citations. A few very important, perhaps “pioneer”, patents seem to dominate the citations. This trend may be consistent with fears of an increasing patent “thicket”, in which more and more patents are issued on minor technical advances in any given area. These technically dense patents must be cited by patents that build upon or distinguish them directly, thus requiring that more citations be made, but few of them will be of sufficient significance to merit citation by any but the most closely related patents. Further work will be needed to understand this change in citation network kinetics.
This work is only the beginning. There are many further applications of network analysis to the patent citation network that are likely to bear fruit. It will be possible, for example, to compare the structural and kinetic behavior of the network for patents in different technological areas, to investigate the degree of relatedness between patents in seemingly disparate technologies, and to explore more detailed structural indicators, such as clustering coefficients and correlation functions. Also, it may be possible to compare the growth of patent systems internationally, perhaps providing a means to distinguish between the effects of global technological change and those of nation-specific legal changes. Finally, it will be interesting to compare the behavior of the patent citation network with that of other networks (such as the scientific journal citations discussed in Redner (2005)) to gain deeper insight into the behavior of complex networks in general.
Acknowledgements.
This work was funded in part by the National Science Foundation and the Hungarian Academy of Sciences under grant INT-0332075 and by the Henry R. Luce Foundation. K. S.’s research is supported by the DePaul University College of Law.References
- Albert and Barabási [2002] Réka Albert and Albert-László Barabási. Statistical mechanics of complex networks. Reviews of Modern Physics, 74:47, 2002.
- Allison et al. [2004] John R. Allison, Mark A. Lemley, Kimberly A. Moore, and R. Derek Trunkey. Valuable patents. Georgetown Law Journal, 92:435, 2004.
- Barabási et al. [1999] Albert-László Barabási, Réka Albert, and Hawoong Jeong. Mean-field theory for scale-free random networks. Physica A, 272:173–187, 1999. cond-mat/9907068.
- Dorogovtsev and Mendes [2000] S. N. Dorogovtsev and J. F. F. Mendes. Evolution of networks with aging of sites. Phys. Rev. E, 62(2):1842–1845, 2000.
- Federal Trade Commission [2003] Federal Trade Commission. To promote innovation: The proper balance of competition and patent law and policy. Report, October 2003.
- Hall [2005] Bronwyn H. Hall. Exploring the patent explosion. Journal of Technology Transfer, 30:35–48, 2005.
- Hall et al. [2003] Bronwyn H. Hall, Adam B. Jaffe, and Manuel Trajtenberg. The nber patent citation data file: Lessons, insights and methodological tools. In Adam B. Jaffe and Manuel Trajtenberg, editors, Patents, Citations, and Innovations: A Window on the Knowledge Economy. MIT Press, 2003.
- Jaffe and Trajtenberg [2003] A. Jaffe and M. Trajtenberg. Patents, Citations & Innovations: A Window on the Knowledge Economy. MIT Press, 2003.
- Jaffe and Lerner [2004] Adam B. Jaffe and Josh Lerner. Innovation and Its Discontents : How Our Broken Patent System is Endangering Innovation and Progress, and What to Do About It. Princeton University Press, 2004.
- Klemm and Eguíluz [2002] Konstantin Klemm and Víctor M. Eguíluz. Highly clustered scale-free networks. Phys. Rev. E, 65:036123, 2002.
- Krapivsky et al. [2000] P.L. Krapivsky, S. Redner, and F. Leyvraz. Connectivity of growing random networks. Physical Review Letters, 85:4629–4632, 2000.
- Merrill et al. [2004] Stephen A. Merrill, Richard C. Levin, and Mark B. Myers, editors. A Patent System for the 21st Century. National Research Council of the National Academies, National Academies Press, 2004.
- Moore [2005] Kimberly A. Moore. Worthless patents. Berkeley Technology Law Journal, 20, 2005.
- Newman [2003] M. E. J. Newman. The structure and function of complex networks. SIAM Review, 45:167–256, 2003.
- Redner [2005] S. Redner. Citation statistics from 110 years of physical review. Physics Today, 58:49, 2005.
- Zhu et al. [2003] Han Zhu, Xinran Wang, and Jian-Yang Zhu. Effect of aging on network structure. Phys. Rev. E, 68:056121, 2003.