Observation of Three-dimensional Long-range Order
in Smaller Ion
Coulomb Crystals in an rf Trap
Abstract
Three-dimensional long-range ordered structures in smaller and near-spherically symmetric Coulomb crystals of 40Ca+ ions confined in a linear rf Paul trap have been observed when the number of ions exceeds 1000 ions. This result is unexpected from ground state molecular dynamics (MD) simulations, but found to be in agreement with MD simulations of metastable ion configurations. Previously, three-dimensional long-range ordered structures have only been reported in Penning traps in systems of 50,000 ions or more.
pacs:
32.80.Pj, 52.27.Jt, 52.27.Gr, 36.40.EiA Coulomb crystal is the solid state phase of a confined ensemble of Coulomb interacting particles with the same sign of charge, often referred to as a one-component plasma (OCP). Coulomb crystallization and properties of Coulomb crystals have been studied experimentally for decades in such a variety of systems as 2D electron gases on super-fluid helium Grimes and Adams (1979) and in quantum well structures Andrei et al. (1988), laser cooled ions in traps Birkl et al. (1992); Mitchell et al. (1998); Itano et al. (1998); Drewsen et al. (1998); Hornekær et al. (2001); Schätz et al. (2001); Tan et al. (1995); Kjærgaard and Drewsen (2003); Blümel et al. (1988) and most recently dusty plasmas Arp et al. (2004). In nature, Coulomb crystals are presently expected to exist in exotic dense astrophysical objects van Horn (1991).
Theoretically, it has been found that the thermodynamic properties of infinite OCPs of a single species, are fully characterized by the coupling parameter Ichimaru (1982)
| (1) |
where is the charge of the particles, is the Wigner Seitz radius defined from the zero temperature particle density by . Furthermore, a liquid-solid transition to a body centered cubic (bcc) structure is expected to occur for 170 Pollock and Hansen (1973); Slattery et al. (1980). For finite OCPs simulations have shown that the situation is more complex, and the properties will depend both on the size and shape of the ion plasma, since surface effects cannot be neglected Rahman and Schiffer (1986); Hasse and Schiffer (1990); Schiffer (1993, 2002); Dubin and O Neil (1988).
Ion Coulomb crystals, which for more than a decade have been realized with laser-cooled ion plasmas confined by electromagnetic fields in Penning traps Tan et al. (1995); Itano et al. (1998); Mitchell et al. (1998) or in radio-frequency (rf) traps Birkl et al. (1992); Drewsen et al. (1998); Hornekær et al. (2001); Kjærgaard and Drewsen (2003); Schätz et al. (2001), offer an excellent opportunity to study finite size effects of OCPs under various conditions. The Coulomb crystal structures studied range from one-dimensional (1D) long cylindrical crystals Birkl et al. (1992); Drewsen et al. (1998); Hornekær et al. (2001); Schätz et al. (2001) over 2D thin planar crystals Mitchell et al. (1998) to 3D spheroidal crystals Drewsen et al. (1998); Tan et al. (1995); Itano et al. (1998); Mitchell et al. (1998). The 3D spheroidal ion Coulomb crystals reported in Refs. Drewsen et al. (1998); Hornekær et al. (2001) are composed of concentric ion shells formed under the influence of the surface of the Coulomb crystals. Simulations indicate that the ions form a near-2D hexagonal short-range ordered structure within each shell Hasse and Schiffer (1990). Similarly, shell and short-range order have recently been observed in dusty plasma experiments Arp et al. (2004).
Observations of three-dimensional long-range order in Coulomb crystals have previously only been reported in the case of 50,000 or more laser-cooled ions in a Penning trap Tan et al. (1995); Itano et al. (1998); Mitchell et al. (1998). In contrast to Penning traps, in rf traps Coulomb crystals undergo strong quadrupole deformations at the frequency of the applied rf field due to the so-called micro-motion Blümel et al. (1989) of the ions. Since this motion is known to produce heating Blümel et al. (1989); Schiffer et al. (2001), it has not been obvious that three-dimensional long-range order could be obtained in such traps.
In this Letter, we present observations of long-range structure in Coulomb crystals of 40Ca+ ions confined in a linear rf Paul trap. By varying the number of ions in near-spherically symmetric crystals, we have shown that bcc structures indeed can be observed in such traps even with the number of ions being below a thousand.
The linear Paul trap used in the experiments is described in detail in Ref. Drewsen et al. (2003), so here we give only a brief description of its basic properties. The linear Paul trap consists essentially of four circular electrode rods in a quadrupole configuration. Radial confinement of the ions is obtained by applying a sinusoidally time-varying rf-potential to diagonally opposite electrodes and the same time varying potential, but with a phase shift of , to the two remaining electrode rods. Static axial confinement is achieved by having all electrode rods sectioned into three parts with the eight end-pieces kept at a positive dc potential with respect to the four center pieces. The electrode rod radius is 2.0 mm, and the closest distance from the trap axis to the electrodes is 3.5 mm. Each sectioned rod has a 5.4 mm long center-piece and 20.0 mm long end-pieces. The frequency of the rf field is in all experiments MHz. With the definition given in Ref. Drewsen and Brøner (2000) of the relevant stability parameters and for the linear Paul trap under the present operation conditions, the geometry of the trap leads to and . In the experiments the rf-amplitude is maximally 500 V, corresponding to . This value is small enough that in all the experiments a harmonic pseudopotential with rotational symmetry with respect to the trap axis and a uniform zero temperature ion density given by cm-3 can be assumed ( is the vacuum permittivity and the mass of the ion).
The 40Ca+ ions are produced isotope-selectively by resonance-enhanced photo-ionization of atoms from an effusive beam of naturally abundant calcium Kjærgaard et al. (2000); Mortensen et al. (2004). Doppler laser cooling is achieved along the trap center axis by using counter propagating laser beams tuned to the – transition at 397 nm and with a repumper beam on the – transition at 866 nm. By this choice of cooling geometry the fluorescence level of the individual ion will not significantly be effected by the rf-induced micro motion (see Fig. 1), as this motion is perpendicular to the direction of the cooling laser to better than 1 mrad. The radial motion of the ions is cooled indirectly through the Coulomb coupling of the radial and axial degrees of freedom.
Images of the positions of the ions in the trap are obtained by detecting the 397 nm light spontaneously emitted during the laser cooling process by a CCD-camera equipped with an image intensifier and a 14 magnification lens system. As indicated in Fig. 1(a), the imaging optic is situated such that the real crystal structure is projected to a plane including the trap axis. Due to the rotational symmetry of the Coulomb crystal boundary around the trap axis, we can deduce from the images their real 3D sizes and hence the number of ions by using the expression for the ion density given above.
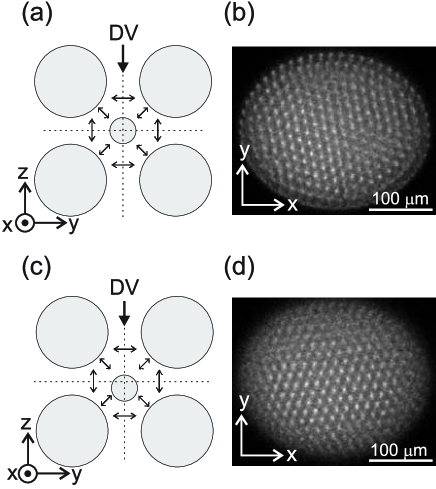
With an exposure time of 100 ms used in the experiments, the quadrupole deformations of the Coulomb crystal induced by the rf field are averaged out in the images. The direction of the micro-motion of the individual ions is position dependent as indicated in Fig. 1(a). As a result, only ions close to the horizontal trap plane defined by the horizontal dashed line in Fig. 1(a) and the trap axis, are imaged without micro-motion blurring due to their micro-motion only being in the direction of view (DV) of the camera system.
In Fig. 1(b), an image of a slightly prolate ion Coulomb crystal consisting of about 2300 ions is presented. Clearly visible is a hexagonal structure. Since the depth of focus (50 m) is several times the inter-ion distance (15 m), the observed structure cannot originate from a single layer of ions. In order to reveal if the ordered structure persists not only very close to the image plane, in another experiment, the Coulomb crystal was moved down a few inter-ion distances (40 m) by adding a positive dc voltage to the upper two electrode rods as sketched in Fig. 1(c). By doing this one achieves that it is a different part of the crystal that is close to the horizontal trap plane. As seen in the image presented in Fig. 1(d), in this situation we still observe an ordered structure apart from close to the edges where the fluorescence light originates from ions not being close to the image plane. This experiment substantiates that the ordered pattern observed indeed originates from a three-dimensional long-range ordered structure. Furthermore from a density point of view the observed structure can not just be two-dimensional.
From the pre-knowledge that the ground state of larger ion systems is a bcc configuration Pollock and Hansen (1973); Slattery et al. (1980), it is tempting to assume that the observed structure is indeed a bcc structure observed along the [111] direction. However, also simple cubic (sc) and face centered cubic (fcc) structures will lead to similar hexagonal patterns for the same direction of observation. For a specific side length of the triangles making up the observed structure, the three cubic structures correspond, however, to different ion densities related by . The perfect agreement between the expected density of cm-3 with the one obtained from the images cm-3 assuming a bcc structure, strongly supports that the observed structure is indeed a bcc and certainly not a sc or fcc structure. As seen from Fig. 2(a)–(c), the outer shape of the crystal is not critical for observing the long-range structures, at least not as long as the crystal is not too oblate or prolate.
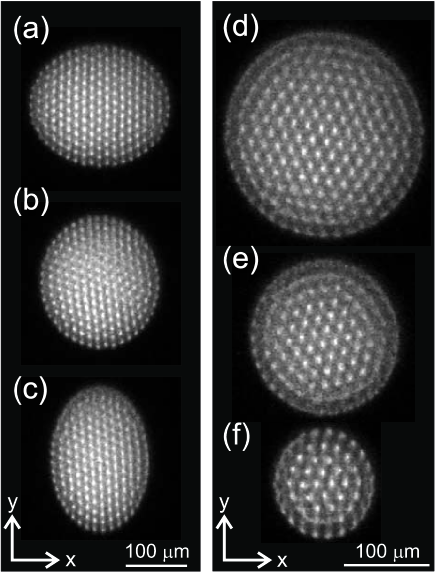
A series of measurements on near spheric crystals with different numbers of ions were done to investigate the size effect of the observation of three-dimensional long-range structures. A few resulting images of this study are presented in Fig. 2(d)–(f). Here one observes long-range-order for as few as 770 ions (Fig. 2(e)), and even some structure is present in the core for the case of 290 ions (Fig. 2(f)).
When comparing the images in Fig. 2, it is evident that the relative number of ions in the regular structure decreases with the size of the crystals, as may be expected since the outer layer of the crystals is always spheroidal shaped. Another size dependent quantity noticed is the frequency at which ordered structures are indeed observed: The smaller the crystals the more unlikely it is to observe the regular structures. The rate at which the long-range ordered structures are observed in crystals of a few thousand ions is 0.1 Hz and the lifetime of the structure is a few hundred ms. In all cases, since the exposure time of 100 ms is many orders of magnitude larger that both the rf-period and the timescale of crystal vibrations (, with MHz being the plasma frequency), the crystal structures are at least to be considered as metastable states.
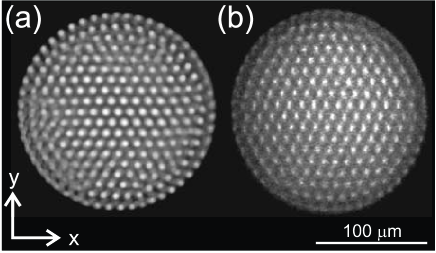
Molecular dynamics (MD) simulations of ground state configurations of Coulomb crystals in static spherical harmonic potentials have proven only to have a pronounced bcc structure when the number of ions exceeds 5000 Totsuji et al. (2002); Hasse (2003). However, in contrast to such ground state simulations, a certain thermal energy is always present in experiments, and configurations different from the ground state may occur. In order to understand the observed long-range-ordered structures, we have made several MD simulations using a static spherical harmonic potential where we initially kept a core of the ions fixed in a bcc-structure and cooled the surrounding ions slowly until 100.000 was reached. For an ion system of 1000 ions, the excess potential energy (relative to the ground state configuration) of such artificially created cold configurations is even with more than one tenths of the ions kept fixed in a bcc-structure, several times smaller than the thermal energy of the system at the typical experimental temperature of a few mK. Simulations where all the ions were subsequently slowly heated to (a few mK) furthermore showed that the artificially made configurations could be metastable on the time scale of the exposure time of the images, 10 ms. Figure 3(a) is an example of a constructed image based on the results of a MD simulation of a crystal of 2685 ions heated to (temperature: 5 mK), where initially 10% of the ions were kept fixed in a bcc-structure. With the 10 ms integration time of this simulation, the central bcc-structure is seen to be well preserved, and the image resembles very much the experimentally obtained image of a Coulomb crystal with about the same number of ions (Fig. 3(b)).
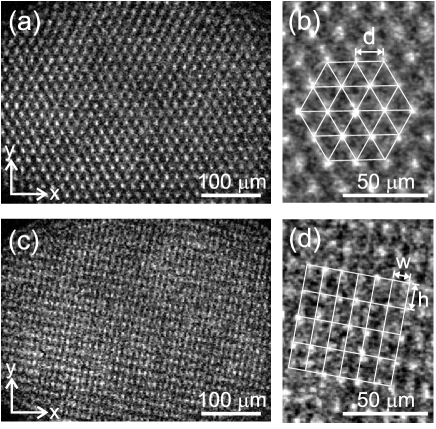
For crystals with more than 2000 ions, images are observed, which suggests three-dimensional long-range ordering different from bcc. In Fig. 4, two images of the same ion ensemble (13,000 ions) at two different instants are presented. While the hexagonal structure of Fig. 4(a) and (b) with m again is compatible with a bcc structure, the rectangular structure observed in Fig. 4(c) and (d) cannot be interpreted as another projection of a bcc structure, but has to relate to another structure. The sides of the rectangle are m and m, which yields a ratio of the sides of . We do not find that any projection of cubic crystal structures exactly complies with this ratio, but the fcc structure projected in the [211] direction comes close as this has the ratio . For the expected ion density of cm-3 the corresponding side lengths of the projected rectangles should for a fcc structure have been m and m. The origin of the small discrepancy between the observed and the predicted ratio is at present unknown, but an explanation could probably be found in a micro-motion induced distortion of the fcc lattice. The observation of fcc structures is not so surprising since such structure have already been observed for larger near-spherical Coulomb crystals in Penning traps Itano et al. (1998). Furthermore, MD simulations have as well predicted very small differences in the potential energies of bcc and fcc structures for larger crystals Hasse (2003).
The reason why the observed bcc or fcc structures always seem to observed from a specific direction is still not completely understood. However, the non-perfect cylindrical symmetry of the quadrupole trap configuration and the corresponding micro-motion as well as small patch potentials may play a role.
In conclusion, we have proven that it is possible to obtain three-dimensional long-range ordering in smaller ion Coulomb crystals formed in rf traps. The long-range structures are found to be consistent with metastable structures observed in MD simulations.
We acknowledge financial support from the Carlsberg Foundation as well as from the Danish National Research Foundation: Center for Quantum Optics QUANTOP.
References
- Grimes and Adams (1979) C. C. Grimes and G. Adams, Phys. Rev. Lett. 42, 795 (1979).
- Andrei et al. (1988) E. Y. Andrei, G. Deville, D. C. Glattli, F. I. B. Williams, E. Paris, and B. Etienne, Phys. Rev. Lett. 60, 2765 (1988).
- Birkl et al. (1992) G. Birkl, S. Kassner, and H. Walther, Nature 357, 310 (1992).
- Mitchell et al. (1998) T. B. Mitchell, J. J. Bollinger, D. H. E. Dubin, X.-P. Huang, W. M. Itano, and R. H. Baughman, Science 282, 1290 (1998).
- Itano et al. (1998) W. M. Itano, J. J. Bollinger, J. N. Tan, B. Jelenković, X.-P. Huang, and D. J. Wineland, Science 279, 686 (1998).
- Drewsen et al. (1998) M. Drewsen, C. Brodersen, L. Hornekær, J. S. Hangst, and J. P. Schiffer, Phys. Rev. Lett. 81, 2878 (1998).
- Hornekær et al. (2001) L. Hornekær, N. Kjærgaard, A. M. Thommesen, and M. Drewsen, Phys. Rev. Lett. 86, 1994 (2001).
- Schätz et al. (2001) T. Schätz, U. Schramm, and D. Habs, Nature 412, 717 (2001).
- Tan et al. (1995) J. N. Tan, J. J. Bollinger, B. Jelenkovic, and D. J. Wineland, Phys. Rev. Lett. 75, 4198 (1995).
- Kjærgaard and Drewsen (2003) N. Kjærgaard and M. Drewsen, Phys. Rev. Lett. 91, 095002 (2003).
- Blümel et al. (1988) R. Blümel, J. M. Chen, E. Peik, W. Quint, W. Schleich, Y. R. Shen, and H. Walther, Nature 334, 309 (1988).
- Arp et al. (2004) O. Arp, D. Block, A. Piel, and A. Melzer, Phys. Rev. Lett. 93, 165004 (2004).
- van Horn (1991) H. M. van Horn, Science 252, 384 (1991).
- Ichimaru (1982) S. Ichimaru, Rev. Mod. Phys. 54, 1017 (1982).
- Pollock and Hansen (1973) E. L. Pollock and J. P. Hansen, Phys. Rev. A 8, 3110 (1973).
- Slattery et al. (1980) W. L. Slattery, G. D. Doolen, and H. E. DeWitt, Phys. Rev. A 21, 2087 (1980).
- Rahman and Schiffer (1986) A. Rahman and J. P. Schiffer, Phys. Rev. Lett. 57, 1133 (1986).
- Hasse and Schiffer (1990) R. W. Hasse and J. P. Schiffer, Ann. Phys. 203, 419 (1990).
- Schiffer (1993) J. P. Schiffer, Phys. Rev. Lett. 70, 818 (1993).
- Schiffer (2002) J. P. Schiffer, Phys. Rev. Lett. 88, 205003 (2002).
- Dubin and O Neil (1988) D. H. E. Dubin and T. M. O Neil, Phys. Rev. Lett. 60, 511 (1988).
- Blümel et al. (1989) R. Blümel, C. Kappler, W. Quint, and H. Walther, Phys. Rev. A 40, 808 (1989).
- Schiffer et al. (2001) J. P. Schiffer, M. Drewsen, J. Hangst, and L. Hornekær, Proc. Natl. Acad. Sci. 97, 10697 (2001).
- Drewsen et al. (2003) M. Drewsen, I. Jensen, J. Lindballe, N. Nissen, R. Martinussen, A. Mortensen, P. Staanum, and D. Voigt, Int. J. Mass Spectrom. 229, 83 (2003).
- Drewsen and Brøner (2000) M. Drewsen and A. Brøner, Phys. Rev. A 62, 045401 (2000).
- Kjærgaard et al. (2000) N. Kjærgaard, L. Hornekær, A. Thommesen, Z. Videsen, and M. Drewsen, Appl. Phys. B 71, 207 (2000).
- Mortensen et al. (2004) A. Mortensen, J. J. T. Lindballe, I. S. Jensen, P. Staanum, D. Voigt, and M. Drewsen, Phys. Rev. A 69, 042502 (2004).
- Totsuji et al. (2002) H. Totsuji, T. Kishimoto, C. Totsuji, and K. Tsuruta, Phys. Rev. Lett. 88, 125002 (2002).
- Hasse (2003) R. W. Hasse, J. Phys. B 36, 1011 (2003).