Dynamic and Stagnating Plasma Flow Leading to Magnetic Flux Tube Collimation
Abstract
Highly collimated, plasma-filled magnetic flux tubes are frequently observed on galactic, stellar and laboratory scales. We propose that a single, universal magnetohydrodynamic pumping process explains why such collimated, plasma-filled magnetic flux tubes are ubiquitous. Experimental evidence from carefully diagnosed laboratory simulations of astrophysical jets confirms this assertion and is reported here. The magnetohydrodynamic process pumps plasma into a magnetic flux tube and the stagnation of the resulting flow causes this flux tube to become collimated.
The extreme collimation of astrophysical jets (Meier et al., 2001; de Young, 1991; Burrows et al., 1996) and the solar corona heating mechanism (Walsh and Ireland, 2003) are two seemingly unrelated astrophysical mysteries, yet both involve collimation of magnetic flux tubes. Astrophysical observations (de Young, 1991; Burrows et al., 1996) and simulations (Meier et al., 2001; Nakamura et al., 2001) indicate that bipolar plasma outflows (jets) are natural Meier et al. (2001); Lynden-Bell (2003) features of young stellar objects, black holes, active galactic nuclei and even aspherical planetary nebula (Sahai et al., 2003). Although it has long been presumed (Lovelace, 1976; Blandford and Payne, 1982) that astrophysical jets are magnetohydrodynamically driven, the standard models do not agree on a single collimation process. A similar issue exists in solar physics: solar spicules (De Pontieu et al., 2004), prominences (Solanki et al., 2003; Priest et al., 1996) and coronal loops (Patsourakos et al., 2004) are considered to be plasma-filled filamentary magnetic flux tubes; coronal heating models (Priest et al., 1998; Aschwanden, 2001) then invoke magnetic reconnection and plasma flow within such filamentary loops. However, the models explain neither the origin of the observed flows nor the extreme collimation (filamentary nature) of the observed structures.
We propose that the collimation of any, initially flared, current-carrying magnetic flux tube is due to the following process (Bellan, 2003): a magnetohydrodynamic (MHD) force resulting from the flared current profile drives axial plasma flows along the flux tube; the flows convect frozen-in magnetic flux from strong magnetic field regions to weak magnetic field regions; flow stagnation then piles up this embedded magnetic flux, increasing the local magnetic field and collimating the flux tube via the pinch effect. Thus, the flux tube fills with ingested plasma and simultaneously becomes collimated. This paper presents direct experimental evidence for this process. We use ultra-high-speed imaging and Doppler measurements of the fast plasma flows, combined with direct density measurements before and after the filling of the flux tube.
Our experimental setup (Hsu and Bellan, 2002) simulates magnetically-driven astrophysical jets at the laboratory scale by imposing boundary conditions analogous to astrophysical jet boundary conditions (Fig. 1): a disk (cathode) representing a central object such as a star, is coaxial and co-planar with an annulus (anode) representing an accretion disk. A vacuum poloidal magnetic field produced by an external coil links these two electrodes, mimicking a poloidal magnetic field threading the accretion disk. A radial electric field applied across the gap between the disk and annulus drives poloidal current.
The nominal parameters of the lab experiment include a plasma discharge duration s, poloidal magnetic field T, gun voltage kV, poloidal current kA, density m-3. The Alfvén speed is m/s, and the ion gyroradius is mm, much smaller than the typical scale lengths ( cm). The plasma ranges from 1 to 0.5, assuming a plasma temperature eV, and the Lundquist number , depending on the characteristic length used to define the resistive time (estimated from classical Spitzer resistivity) and the Alfvén time . These dimensionless numbers are comparable to numerical MHD simulations.
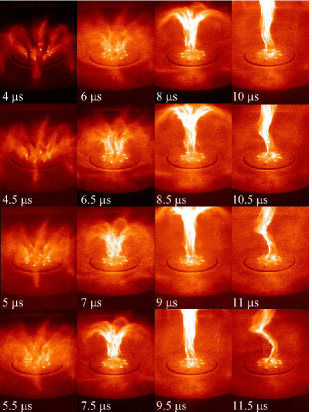
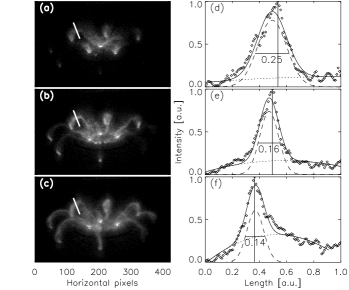
Just before breakdown, neutral gas is puffed into the vessel from nozzles located on the disk and the annulus. After breakdown, plasma arches form, analogous to solar prominence loops (Bellan and Hansen, 1998). These arches are distributed toroidally, reminiscent of spider legs, with each ‘leg’ linking a gas nozzle on the disk to a corresponding nozzle on the annulus (Fig. 1, 4.0 s and Fig. 2). These magnetically-dominated plasma arches are initially flared (i.e. their minor radius increases with distance along their axis). Because the coil-produced poloidal vacuum magnetic field is weaker at the annulus than at the disk, the outer footpoint diameter is initially 4-5 times that of the inner footpoint. The eight legs quickly become bright and highly collimated: in 0.5 s, as the legs fill up with plasma, the outer/inner footpoint diameter ratio has been measured to reduce by a factor of 2 (Fig. 3), and can approach unity to within (Fig. 4). The legs later merge (Fig. 1, 5.5-7.5 s) to form a single central column (Fig. 1, 8.0 s), which constitutes the axially-expanding ‘astrophysical jet’ (Fig. 1, 8-10 s). The central column can eventually kink (Fig. 1, 10-11.5 s) and lead to spheromak formation (Hsu and Bellan, 2003). The initial flaring of the spider legs is just the flaring of the coil-imposed vacuum magnetic field, a known analytic function Jackson (1975).
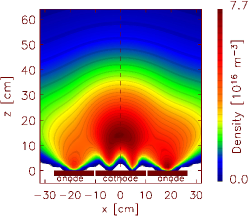
Measurements shown in Fig. 5 indicate that the neutral gas density existing at breakdown is totally inadequate to account for the plasma density measured in the spider legs or the central column. The measurements were taken with a custom-built fast ion gauge (FIG), with a 2s response time, absolutely calibrated with a standard commercial ion gauge. In situ measurements of the gas cloud in front of the electrodes were fitted numerically to obtain a complete 3D approximation of the gas output from the nozzles. The numerical fit assumed a linear superposition of gas cones from each nozzle, each with a pressure distribution having an axial exponential drop and a radial Gaussian profile. In particular, these measurements indicate that prior to breakdown, the neutral gas density at the location of a single spider leg is m-3 (Fig. 5), which is 3-4 orders of magnitude less than the plasma density measured just a few s later (Fig. 6a). These time-resolved FIG measurements also show that, consistent with the molecular thermal velocity of km/s, the characteristic time-scale for neutral density evolution is ms, so the neutral gas distribution is quasi-stationary during the s plasma discharge duration. For a plasma density times greater than the locally available supply of neutrals, simple pinching of the tube would require 30-100 fold decrease in radius. Only a 2-fold decrease is observed, so all spider leg particles must be ingested from the gas valves into the leg by MHD forces on s time-scales.

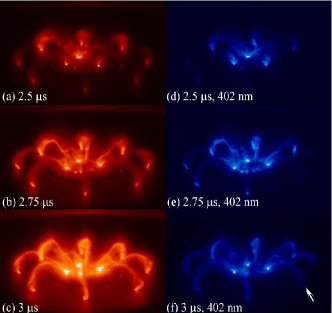
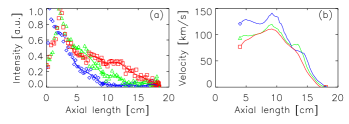
To visualize this fast axial flow, nitrogen was injected from the cathode footpoints of the spider legs and neon from the anode footpoints (Fig. 2). A narrowband interference filter (central wavelength 402 nm, Gaussian passband 10 nm) isolated the nitrogen plasma for one camera (Fig. 2d-f), while simultaneous, unfiltered photographs were obtained with a second camera (Fig. 2a-c). A reconstruction of the experimental geometry overlaid on the images allows comparison of the dimensions of visible legs with best-fit vacuum magnetic flux tube (Fig. 4d). The photographs indicate a brightness propagating along the axis of the spider-leg flux tube, from the cathode end to the anode end, on a 0.5 s time-scale (Figs. 2 and 7). This bright front propagation occurs s after the breakdown process has ended, demonstrating that it is different from streamer fronts Zambra et al. (2004) associated with breakdown mechanisms. The time scale rules out ion acoustic velocities ( km/s) from consideration and the flow direction rules out electrostatic acceleration. The propagation in fact resembles a magnetized vacuum arc discharge Boxman et al. (1995) and involves nitrogen plasma flow, with km/s velocities (Fig. 7) and a m/s2 mean acceleration. Flow velocities can be calculated assuming that the density profile along the axis of the flux tube is proportional to the square root of the light intensity, and integrating the continuity equation
| (1) |
where the stagnation velocity and cm is the spider leg’s axial length (assumed to remain constant during the measurements). The mean acceleration is estimated from the typical velocity and time-scale ( m/s2) or from the typical length-scale of the flow ( m/s2).
According to the model (Bellan, 2003), the axial component of the MHD pumping force is maximised on the flux tube axis and accelerates plasma along this axis according to the equation of motion
| (2) |
where is the local flux tube radius ( is the flaring), is the total current in the flux tube, is the axial plasma velocity and is the plasma density.
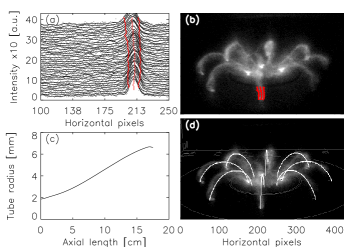
Using spider-leg flux tube dimensions measured from the photographs (Fig. 4c, mm, ) and assuming the current inside a single leg is one eighth the total measured 120 kA gun current, Eq.2 predicts a spider-leg plasma density of m-3. This implies that within 0.5 s, MHD forces inject about nitrogen particles from the gas nozzles into a cm3 spider-leg. Summing over all eight flux tubes gives a total influx pumping rate of particles/s. Since it takes s for the legs to merge and form the 2.5 cm diameter, 50 cm long central column, assuming the pumping rate is constant, the central column should then have a m-3 volume-averaged plasma density. The central column jet, located where 10 s previously there was essentially vacuum, has ingested about 10% of the total number of particles available from the gas feed lines. At this rate, it would take a few hundred s to empty all the gas from the feed lines. This time is much shorter than the time-scale of fusion experiments, where similar filamentary flux tubes have been observed to emerge (Wilson and Cowley, 2004) explosively from the hot plasma core and connect to the cold walls.

The prediction for very high plasma densities in the spider legs and the central column has been substantiated using independent spectroscopic line measurements (Figs. 6a, 8). These measurements can exhibit large Stark broadening indicative of high electron densities. For hydrogen plasmas, we measure m-3 in the spider-leg (Fig. 8a) and m-3 in the fully-formed central column jet. In nitrogen discharges, central column jet densities m-3 are measured (Fig. 6a at 4 s, Fig. 8b) however spider-leg densities cannot be resolved. Spectral lines were sampled by optical fibres viewing selected portions of the discharge and recorded with an optical multichannel analyzer. The FWHM [nm] is related to [m-3] by for NII (Mar et al., 2000) and for H (Griem, 1964). The measurements are corrected for the instrument function and a 1-10 eV thermal broadening, estimated from ion line ratios.
The pumping model also predicts that the largest plasma flow velocity in the tube is of the order of the Alfvén velocity associated with the magnetic field generated by the axial current. Here, the 15 kA current, m-3 density and 4 mm typical radius of the spider-leg gives km/s, encompassing the measured km/s shown in Fig. 7. On the axis of a single spider-leg (Fig. 6b), we observe blue shifts corresponding to km/s line-of-sight velocities. Using CCD images, we estimate the optical probe to be 8 cm along and 1 cm away from the spider-leg axis, with a line-of-sight angle of 72∘3∘to the plasma flow direction. In the central column jet, the flow velocity is measured at km/s (Fig. 8b), with a line-of-sight coincident to the jet axis. These velocities are consistent with the Alfvén velocity expected from the measured total 150 kA current and m-3 peak density in the central column. Both the collimation of the spider legs and the central column jet arise from the same process.
The results thus provide strong evidence for flow-driven collimation of flared magnetic flux tubes. This process requires net electrical current, a supply of particles and stagnation of the driven flow. In an astrophysical context, accretion disks supply plasma and flows stagnate at the lobes; a net axial current is understood to be necessary for self-confinement (Ferrari, 1998) and recent observations of helical magnetic field structure in jets are indicative of net axial current (Uchida et al., 2004). The electrical circuit is then closed by radial currents in the accretion disk, returning via the cocoon. Active solar regions also exhibit unneutralized electrical currents (Wheatland, 2000). We emphasize that strong flows and collimation can be driven by even modest amounts of current, before reaching the kink instability (high current) threshold. Supported by the US DoE and NSF.
References
- Meier et al. (2001) D. L. Meier, S. Koide, and Y. Uchida, Science 291, 84 (2001).
- de Young (1991) D. S. de Young, Science 252, 389 (1991).
- Burrows et al. (1996) C. J. Burrows et al., Astrophys. J. 473, 437 (1996).
- Walsh and Ireland (2003) R. J. Walsh and J. Ireland, Astron. Astrophys. Rev. 12, 1 (2003).
- Nakamura et al. (2001) M. Nakamura, Y. Uchida, and S. Hirose, New Astron. 6, 61 (2001).
- Lynden-Bell (2003) D. Lynden-Bell, Mon. Not. R. Astron. Soc. 341, 1360 (2003).
- Sahai et al. (2003) R. Sahai et al., Nature 426, 261 (2003).
- Lovelace (1976) R. V. E. Lovelace, Nature 262, 649 (1976).
- Blandford and Payne (1982) R. D. Blandford and D. G. Payne, Mon. Not. R. Astron. Soc. 199, 883 (1982).
- De Pontieu et al. (2004) B. De Pontieu, R. Erdélyi, and S. P. James, Nature 430, 536 (2004).
- Solanki et al. (2003) S. K. Solanki et al., Nature 425, 692 (2003).
- Priest et al. (1996) E. R. Priest, A. A. van Ballegooijen, and D. H. MacKay, Astrophys. J. 460, 530 (1996).
- Patsourakos et al. (2004) S. Patsourakos, J. A. Klimchuk, and P. J. McNeice, Astrophys. J. pp. 322–329 (2004).
- Priest et al. (1998) E. R. Priest et al., Nature 393, 545 (1998).
- Aschwanden (2001) M. J. Aschwanden, Astrophys. J. 560, 1035 (2001).
- Bellan (2003) P. M. Bellan, Phy. Plasmas 10, 1999 (2003).
- Hsu and Bellan (2002) S. C. Hsu and P. M. Bellan, Mon. Not. R. Astron. Soc. 334, 257 (2002).
- Bellan and Hansen (1998) P. M. Bellan and J. F. Hansen, Phys. Plasmas 5, 1991 (1998).
- Hsu and Bellan (2003) S. C. Hsu and P. M. Bellan, Phys. Rev. Lett. 90, 215002 (2003).
- Jackson (1975) J. D. Jackson, Classical Electrodynamics (J. Wiley & Sons, New York, 1975), p. 178, 2nd ed.
- Mar et al. (2000) S. Mar et al., J. Phys. B: At. Mol. Opt. Phys. 33, 1169 (2000).
- Zambra et al. (2004) M. Zambra et al., IEEE Trans. Plasma Sci. 32 (2004).
- Boxman et al. (1995) R. L. Boxman, P. Martin, and D. Sanders, eds., Handbook of Vacuum Arc Science and Technology (Noyes, New Jersey, 1995).
- Wilson and Cowley (2004) H. R. Wilson and S. C. Cowley, Phys. Rev. Lett. 92, 175006 (2004).
- Griem (1964) H. R. Griem, Plasma Spectroscopy (McGraw-Hill, 1964).
- Ferrari (1998) A. Ferrari, Annu. Rev. Astron. Astrophys. 36, 539 (1998).
- Uchida et al. (2004) Y. Uchida et al., Astrophys. J. 600, 88 (2004).
- Wheatland (2000) M. S. Wheatland, Astrophys. J. 532, 616 (2000).