Quantitive and sociological analysis of blog networks
Abstract
This paper examines the emerging phenomenon of blogging, using three different Polish blogging services as the base of the research. Authors show that blog networks are sharing their characteristics with complex networks ( coefficients, small worlds, cliques, etc.). Elements of sociometric analysis were used to prove existence of some social structures in the blog networks.
1 Introduction
1.1 Blog – what is it?
Blog111http://www.matisse.net/files/glossary.html#Blog 222http://www.blogger.com/tour_start.g is a diary published on the author’s website. Because the Internet is used as a medium, authors feel free to express their opinions and views on different subjects, without fear of censorship.
1.2 How blog networks are created?
As blogging becomes very popular, many internet portals offer (mostly free of charge) blogging facilities to their customers. That causes aggregation of blogs in one “place”, and encourages building communities. Bloggers (as we call people who run their blogs) very often place hypertext links to their friends and colleagues sharing similar views or describing similar subjects. Such connections create what we call blog networks which are subject of our research.
1.3 Examined blogging services
We examined three different Polish blogging services:
-
1.
blog.onet.pl – one of the most popular services, about registered blogs
-
2.
blog.gery.pl – moderately known service, about blogs
-
3.
jogger.pl – niche service, gathering mostly tech-savvy people, only around blogs
It should noted that many of blogs may be abandoned by their authors and no longer updated. They are still available however, and were taken into the account.
2 Collecting the data
We used standard GNU/Linux tools to automate process of collecting the data:
-
•
text-mode lynx browser for downloading the content of WWW pages
-
•
grep for filtering out unnecessary information
-
•
sort for sorting the blog list
-
•
uniq for removing the duplicate blog list entries
-
•
bash shell which provided a scripting framework
Usually blogging services provide users with possibility of listing all existing blogs. We used this feature to create a list of all bloggers for each service. For example jogger.pl blog list has the following URL:
http://jogger.pl/users.php?sort=1&start=offset
where offset is the CGI parameter for specifying position in the list. It has 100 blog links presented on each page, so it was possible to gather all the blog links by starting from offset=0 and increasing it by 100 in a loop until no more blogs were presented. In each loop iteration content of the list page was downloaded by using lynx browser in HTML source dump mode. Then grep was used to filter out all data apart from blog URL addresses. We found it convenient to sort the resulting list and remove duplicate entries.
When the list was ready, content of every listed blog page was downloaded and links to other blogs in the same service were filtered out in similar manner. In the result, list of all outgoing connections for each blogger in the service was created. This process was repeated for each examined blogging service.
3 Quantitive analysis
This section presents results of quantitive analysis performed on data collected from the services we examined.
3.1 Vertices
The terminology we used comes from the graph theory. Each blog is represented by a vertex in the connection graph.
Average vertex degrees for each service:
-
1.
blog.onet.pl:
-
2.
blog.gery.pl:
-
3.
jogger.pl:
It’s clearly seen that these graphs are very sparse. We’ll try to show that the function of degree distribution is of power–law type: , where represents vertex degree.
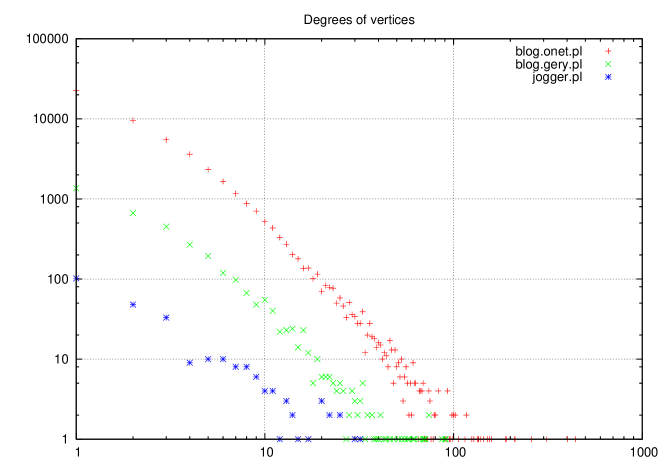
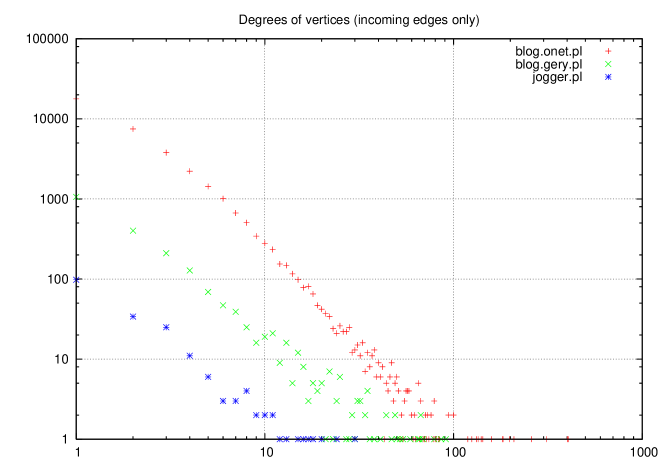
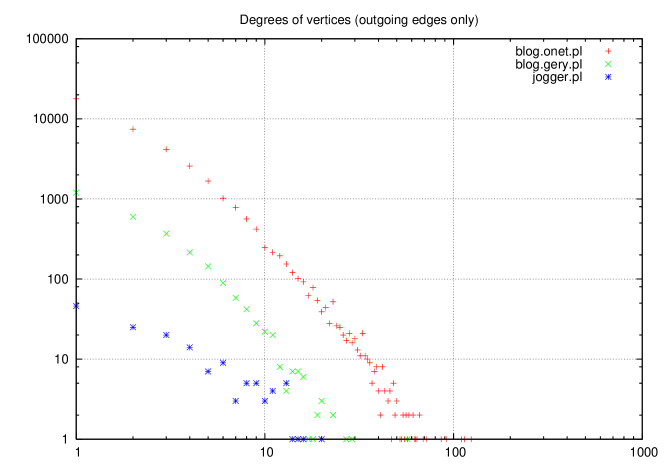
Histograms presented in Figures 1, 2 and 3 are very similar, even though number of blogs in each service is different by an order of magnitude. That shows us that scaling is also very similar in these networks.
coefficients of the vertices degree functions are presented in Table 1 below. represents the square of the correlation coefficient.
| Service | blog.onet.pl | blog.gery.pl | jogger.pl | |||
|---|---|---|---|---|---|---|
| Outgoing edges | ||||||
| Incoming edges | ||||||
| Incoming and outgoing edges combined | ||||||
Vertices with maximal degrees are listed in Table 2.
| Service | blog.onet.pl | blog.gery.pl | jogger.pl | |||
|---|---|---|---|---|---|---|
| Name | Deg. | Name | Deg. | Name | Deg. | |
| Outgoing edges | zycielily | 407 | martus | 91 | jpc | 30 |
| Incoming edges | blizniaczki777 | 124 | www333home page of the service | 57 | siwa | 20 |
| Incoming and outgoing edges combined | zycielily | 444 | martus | 91 | marcoos | 32 |
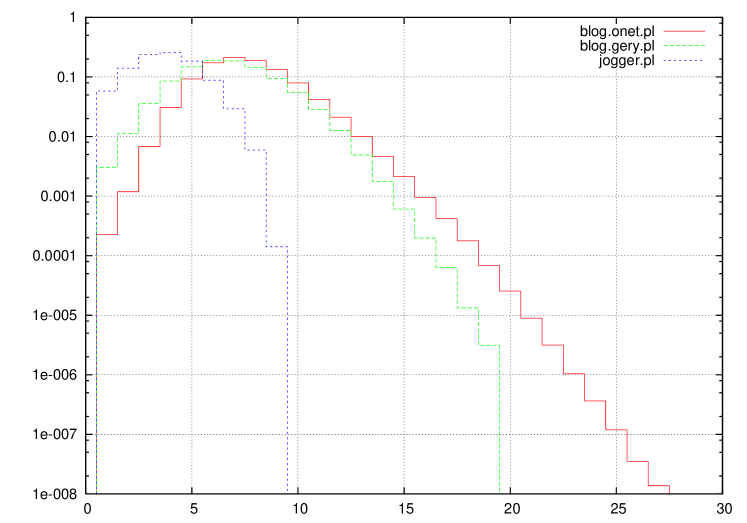
3.2 Average path length
Average path lengths for each service are presented in Table 3. Standard deviation is represented by the symbol.
| Service | blog.onet.pl | blog.gery.pl | jogger.pl |
|---|---|---|---|
| Average path length | 7.60 | 6.76 | 3.78 |
| 3.46 | 3.74 | 2.64 |
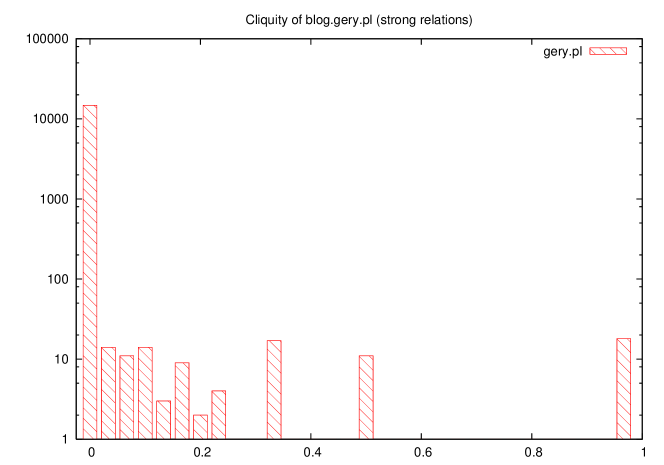
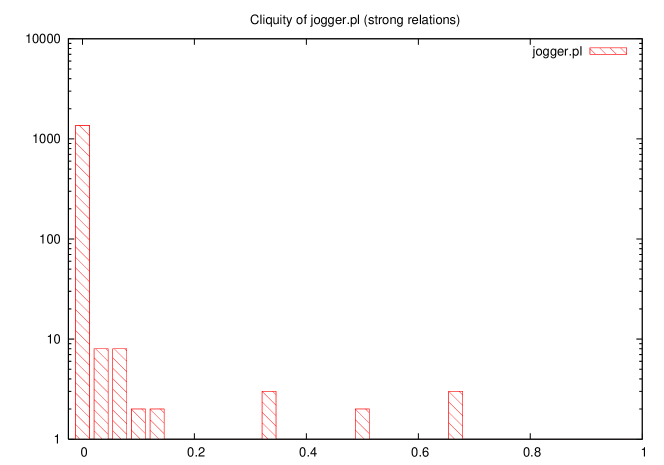
3.3 Cliques
Two different kinds of connections between the vertices are distinguished – weak (idols and fans) and strong (friends). We call a connection between vertices weak when there’s only one edge, going either from to or to . That means that only one blog links to the other, which resembles relationship between fan and his idol. On the other hand, connection is called strong when two edges between and can be found. First goes from to and the other from to . If we assume that linking to somebody’s blog means liking that person, then such relation means that and are friends as they like each other.
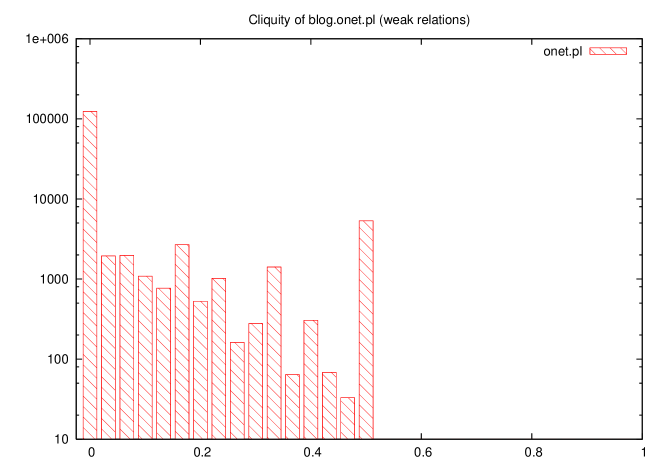
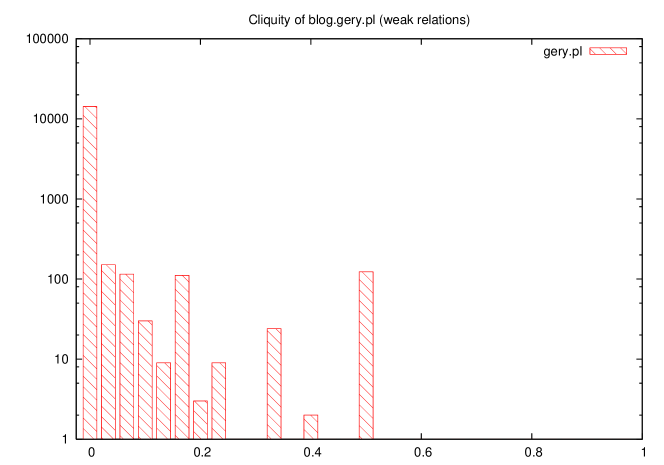
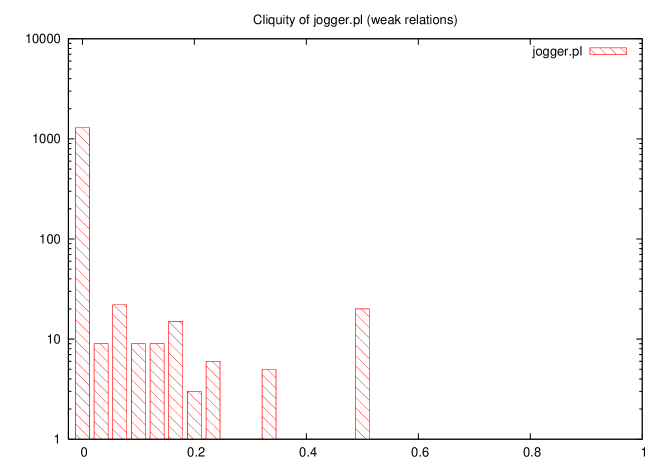
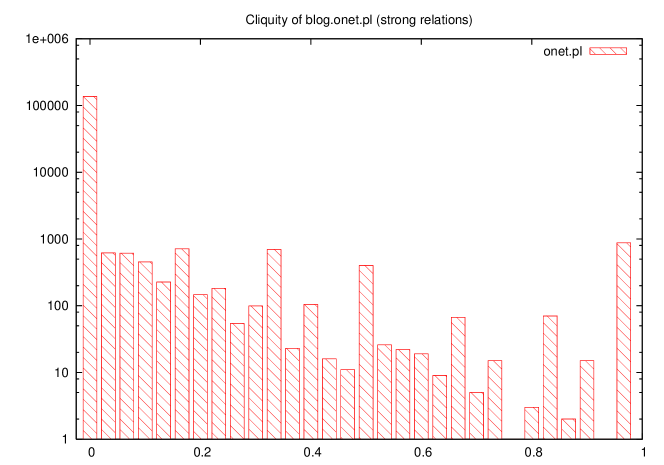
We also measured average cliquity for each service. Cliquity represents “completeness” of the neighbourhood of vertex [8, 9], i.e. is in case of a complete subgraph, when a vertex is isolated.
Average cliquities for each service are presented in Table 4. Figures 5–7 and 8–10 show histograms of vertex cliquities for each examined service, weak and strong connections respectively. Overdominance of isolated vertices is evident. When strong connections are considered, full subgraphs can be observed in larger services.
| Service | blog.onet.pl | blog.gery.pl | jogger.pl | |||
|---|---|---|---|---|---|---|
| Weak relations | ||||||
| Strong relations | ||||||
4 Sociometric analysis
Connected graph is a graph in which every two vertices are connected with a path. Two subgraph groups have been generated: strong relationship graphs — when one blog is referring to another, the other mutually referring to the first one (“friends”) and weak relationship graphs — where references are not mutual.
Frequencies of vertex degrees depending on the type of relationship are shown in Fig. 11.

The number of isolated persons was established (no references to other blogs on their pages). The result is given in Table 5.
| Portal | jogger.pl | blog.gery.pl | blog.onet.pl |
| Number of users | 1391 | 14861 | 141755 |
| Number of isolated blogs | 1315 | 14135 | 122412 |
| Percent of isolated blogs | 94.5% | 95.1% | 86.3% |
| Percent of not isolated blogs | 5.5% | 4.9% | 13.7% |
| Average number of users | 9.5 | 3.24 | 5 |
| Number of strong subgraphs | 8 | 224 | 3797 |
Having given number of isolated persons from particular blog service, it is possible to establish group integration index. The integration index is calculated with the following method [3]:
These are respectively: , .
As a result of computer - aided calculations we have been able to determine the number of blog pairs for blog.onet.pl and blog.gery.pl services where authors chose each other mutually (placed links in their weblogs). For blog.gery.pl this was 554 of total 14861; in case of blog.onet.pl this value reached 21160 of total number of 141755 weblogs. Connection index is given by formula [3]:
Consequently, connection indices for these blogs are respectively: , . Notice that despite a tenfold population difference between the two services, connection indices differ only about 2 times.
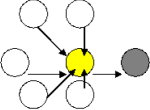
Idol is a sociometric structure which describes person who got the large number of positive choices, though making small number of choices by itself (that means that it has small positive expansion)[1, 4, 7] . With idol is connected the person of eminence grise — who is the person chosen by idol (illustrated in Fig. 12).
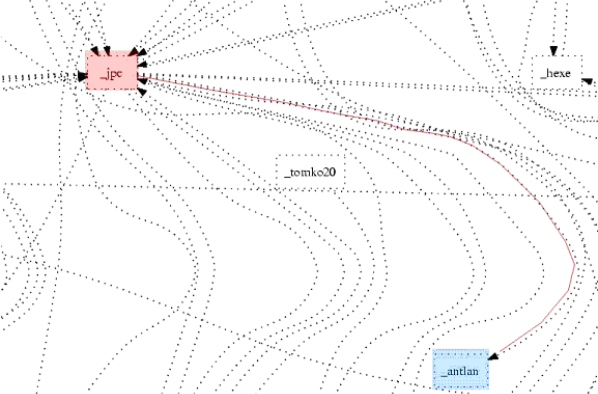
Blog jpc (shown in Fig. 13) is an idol with relatively large positive expansion (21 choices). Eminence grise is clearly visible (blog antlan), and is chosen by jpc without mutuality. Text analysis suggests that authors of both blogs are friends from University, from the “real” life. The more experienced user (jpc) promotes his friend’s weblog in bloggers’ community. This however does not work very well — although blog jpc was established in November 2003 and is regularly updated, blog antlan is an ephemeron. For the 5 months of its existence it was updated only once.
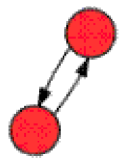
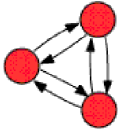
In the Fig. 14 the basic sociometric structures are presented — diad which is mutual positive choice between 2 persons and triad which is mutual positive choice among 3 persons [1, 5, 6].
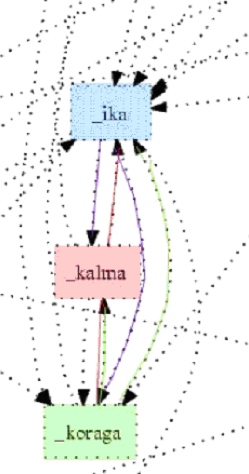
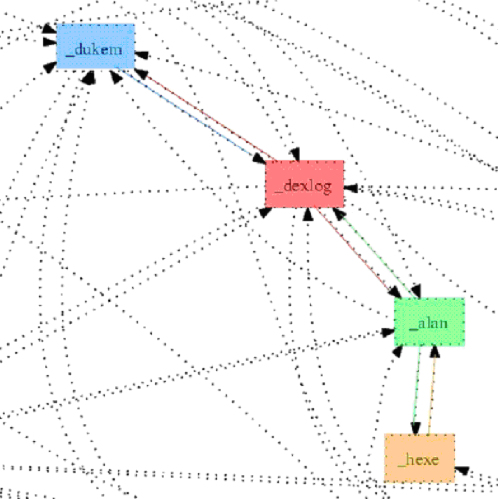
In the left picture of Fig. 15 the example of triad is shown — three mutual choices from jogger.pl service. One can see that the positive expansion of these blogs is small, despite relatively high sociometric status (with blog kalma having the smallest number of choices within the triad). Text analysis provides explanation of this — all three blogs belong to one family, a marriage with a 2 years old child. koraga is a blog describing events from child’s life written from its “point of view” by his mother, kalma is a weblog of its father while ika belongs to mother. Right picture of Fig. 15 shows the chain structure consisting of a number of diads. Text analysis shows that these people are connected with historical internet portal Histmag. Such choice structure has been established despite large outlook differences.
5 Summary
Sparsity is the first apparent property of examined blogs networks. The highest observed average vertex degree is , that means that most of the vertices are not connected with others at all (about ).
coefficients describing power–law of the decay of the vertex degree function is below in all examined services. That indicates that blogs are in fact scale–free networks [8, 9].
We don’t observe notable increase of the average path length along with the increasing graph size. While the number of vertices of blog.onet.pl and blog.gery.pl services differs by order of magnitude, the difference between their average path lengths is only . It can be observed that as the graph is growing, we don’t need respectively longer paths to “travel” between its vertices. That property is called small world [10].
The proportion between strong and weak relations in cliques doesn’t change with the size of the graph. However, small graphs are dominated by very dense (many connections) and loose cliques(no connections at all, isolated vertices). That contrast could be explained by saying that in smaller communities some people are very sociable, while others don’t tend to “connect” with others at all. More balanced behaviour is rare.
In larger graphs, average cliquity is much greater (almost an order of magnitude) than in smaller ones, so we reckon that larger structures tend to help building stronger relations between their participants. In smaller structures the border between the “liked” and isolated ones is much stronger.
We also tried to implement a sociometric analysis method, a domain of microsociology, to analyse a large net of virtual interpersonal connections. Although treating blog networks as such can be controversial, we believe that for the purpose of this analysis such interpretation can be proved valid.
In large groups it is possible to find some regular sociometric structures. Structures described in this work were sociologically explainable despite vast differences of relationships among blog authors.
6 Acknowledgments
We’d like to thank our colleagues — studens of Computer Science at Gdańsk University, who helped us with data processing: Krzysztof Treyderowski, Wojciech Glod, Marcin Jeremicz, Piotr Tadych, Lukasz Pasula, Lukasz Rolbiecki.
W.B., P.L. R.P. and D.M. are very grateful to organisers of the FENS meeting, professors R. Kutner and J. Holyst for their hospitality and subject inspiration.
References
- [1] 1. Piotr Sztompka, Socjologia, Wydawnictwo Znak, Kraków 2002
- [2] C.F. Nachmias, Research Methods in the Social Sciences, Scientific American/St. Martin’s College Publishing Group Inc. (1996)
-
[3]
Oeconomicus: socjologia,
http://www.econom.pl/nauka/socjo5.php3 20.01.2005 - [4] J. Szmatka, Male struktury spoleczne, Warszawa 1989
- [5] Male struktury spoleczne, I. Machaj (ed.), Lublin 1998
- [6] J. Turowski, Socjologia. Male struktury spoleczne, Lublin 1993
- [7] J. Brzeziński, Metodologia badań psychologicznych, Wydaw. Naukowe PWN, Warszawa 1999
- [8] R. Albert and A.-L. Barabasi, Rev. Mod. Phys. 74, 47 (2002)
- [9] S.N. Dorogovtsev and J.F.F. Mendes The shortest path to complex networks, cond-mat/0404593
- [10] S. Milgram, Psych. Today 2, 60 (1967)