Metastability Exchange Optical Pumping of Helium-3 at High Pressures and 1.5 T: Comparison of two Optical Pumping Transitions
Abstract
Abstract:
At low magnetic field, metastability exchange optical pumping of
helium-3 is known to provide high nuclear polarizations for pressures
around 1 mbar. In a recent paper, we demonstrated that
operating at 1.5 T can significantly improve the results of
metastability exchange optical pumping at high pressures. Here, we compare the
performances of two different optical pumping lines at 1.5 T, and show
that either the achieved nuclear polarization or the production rate
can be optimized.
pacs:
03.75.Be - 32.60.+i - 32.80.Bx - 67.65.+z - 87.61.-cgI Introduction
Highly polarized helium-3 is used in various fields of science, for example, to perform magnetic resonance imaging (MRI) of air spaces in human lungs albert ; moller , or to prepare spin filters for neutrons becker and polarized targets for nuclear physics xu . The most successful methods presently used to polarize helium-3 are spin-exchange optical pumping using alkali atoms bouchiat ; happer , and pure-helium metastability exchange optical pumping colegrove ; nacher85 . The applications have driven research towards improvement in terms of photon efficiency, steady-state polarization, and production rate, both for spin exchange optical pumping babcock , and metastability exchange optical pumping becker ; gentile . The metastability exchange technique was demonstrated by Colegrove, Schearer, and Walters over forty years ago colegrove . In standard conditions, metastability exchange optical pumping is performed at low pressure (1 mbar) in a guiding magnetic field up to a few mT. Metastable S-state atoms are produced using a radiofrequency discharge. They are optically pumped using the S-P transition at 1083 nm. The electronic polarization is transferred to the nuclei by hyperfine interaction. Through metastability exchange collisions, nuclear polarization is transferred to ground state helium-3 atoms. Metastability exchange optical pumping in standard conditions provides in a few seconds high nuclear polarizations (up to 90% at 0.7 mbar batz ). Unfortunately, the achieved nuclear polarization rapidly drops down when the helium-3 pressure exceeds a few mbar gentile ; cracovie . Therefore, a delicate polarization-preserving compression stage is necessary for all applications needing a dense sample.
We recently demonstrated that operating at 1.5 T can significantly improve the nuclear polarization achieved at high pressures abboud , using one of the most intense lines in the S-P absorption spectrum. Here, we show that a different choice of optical pumping transition can further improve the steady-state polarization although the production rate is slightly lower. We also describe more precisely the experimental protocol, and demonstrate the consistency of the optical absorption technique for dynamic measurement of the nuclear polarization in presence of the optical pumping laser.
II Experimental
II.1 Setup
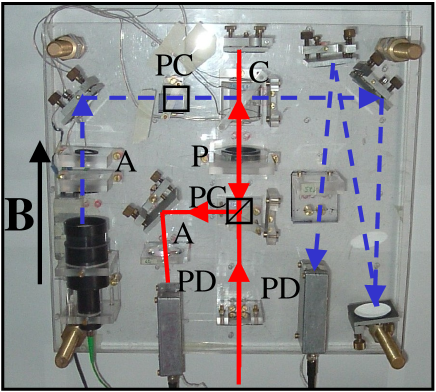
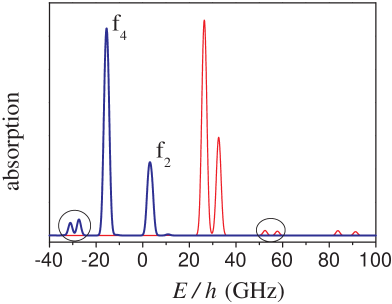
Experiments are performed in the bore of a clinical MRI scanner providing a homogeneous 1.5 T magnetic field. The experimental apparatus is shown in Fig.1. The helium-3 gas is enclosed in a sealed cylindrical Pyrex cell, cm in diameter and cm in length. Cells filled with pressure =1.33, 8, 32, and 67 mbar of pure helium-3 are used. A radiofrequency high voltage applied to electrodes on the outside of the cell generates a weak electrical discharge in the gas. It is used to populate the S state and maintain a metastable atoms density nm in the range 1-81010 atoms/cm3, depending on the applied voltage and the gas pressure. The optical pumping laser is a 50 mW single mode laser diode amplified by a 0.5 W ytterbium-doped fiber amplifier chernikov . The laser wavelength can be tuned by temperature control over the entire spectrum of the S-P transition of helium (150 GHz at 1.5 T, see Fig.2). The circular polarization of the pump beam is obtained using a combination of polarizing cube and quarter-wave retarding plate. The pump beam is back-reflected after a first pass in the cell to enhance its absorption, and collected by a photodiode to measure its absorption.
The probe beam is provided by another single mode laser diode. It is attenuated and linearly polarized perpendicularly to the magnetic field. The absorption of probe and pump lasers are measured using a modulation technique. The discharge intensity is modulated at Hz and the absorptions are measured with lock-in amplifiers. The average values of the transmitted probe and pump intensities are also recorded. Laser sources and electronics remain several meters away from the magnet bore in a low-field region.
II.2 Optical pumping configuration
The structure of the S-P transition and Zeeman sublevels of helium-3 at 1.5 T is described in courtade ; abboud .
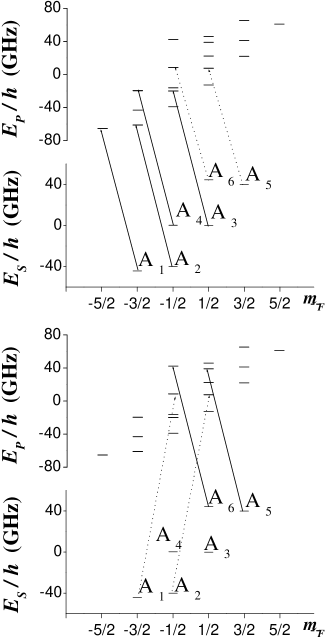
In our experiments, optical pumping is performed using one of the two pumping lines labeled f4 or f2 in the absorption spectrum displayed in Fig.2. The f4 line consists of four unresolved transitions spreading over 1.31 GHz. Given the Doppler width of helium-3 at room temperature (2 GHz FWHM), it addresses simultaneously four metastable sublevels A1 to A4 with =-3/2, -1/2 and 1/2, where is the magnetic quantum number for the total angular momentum (see Fig.3). The f2 line (two transitions split by 1.37 GHz) simultaneously addresses sublevels A5 and A6 with =1/2 and 3/2. The population transfer into A5 and A6 for f4 pumping (or into A1 to A4 for f2 pumping) occurs as follows: excitation by laser absorption, collisional redistribution in the P state, and spontaneous emission.
II.3 Optical measurement of nuclear polarization
The optical detection method used in our experiments is based on absorption measurements using a weak probe beam.
This absorption technique does not need any calibration and can be used at arbitrary magnetic field, and pressure courtade . It relies on the fact that in the absence of optical pumping, metastability exchange collisions impose a spin temperature distribution for the metastable populations , where is the spin temperature in the S state related to the nuclear polarization in the ground state .
In practice, the probe laser frequency is swept over two lines. Peaks amplitudes are precisely measured by a fit to a Voigt absorption profile.
The population ratio of the two hyperfine sublevels addressed by the probe lines is then found using the field-dependent computed transition probabilities, and is used to calculate the spin temperature. Hence, the ground-state nuclear polarization is inferred courtade .
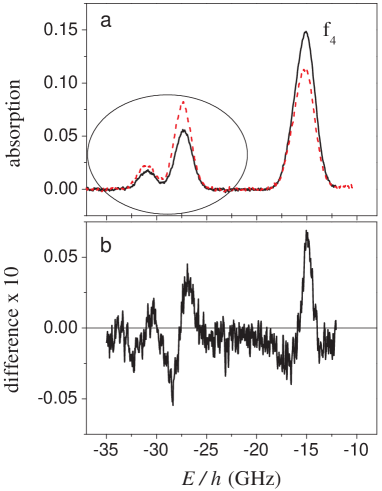
Polarization build-up is monitored in the presence of the optical pumping beam. Therefore, the probe absorption measurements must involve metastable sublevels not addressed by the optical pumping laser. In our configuration (see Fig.3), the populations of sublevels A5 and A6 (respectively A1 and A2) are measured for f4 (respectively f2) pumping. Fig.4a shows typical absorption spectra recorded in the absence and in the presence of the pump laser. In the absence of the pump laser (solid line), the spectrum is accurately fit by the spectrum computed assuming a spin temperature distribution (residue plot in Fig.4b). The presence of the pump strongly affects the population distribution, with efficient population transfer from the pumped levels to A5 and A6 and modifies the absorption profile (dashed line). However the ratio of populations in sublevels A5 and A6 remains unaffected, and an absorption measurement still accurately provides the correct value for
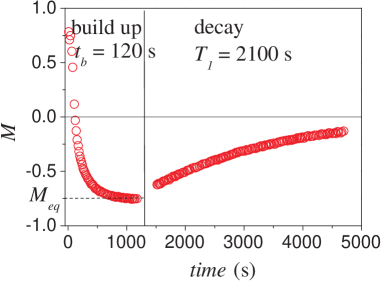
An example of dynamical measurement of polarization build-up and decay is shown in Fig.5 for the 8 mbar cell. Several scans of the probe laser are recorded successively, and the value of the nuclear polarization is inferred as a function of time. The gas is initially polarized to the equilibrium positive value of achieved with f4 pumping. At time , the pump laser is tuned to the f2 line. When the new steady-state polarization is reached, the pump laser is turned off and polarization decays by discharge-induced relaxation.
III Results
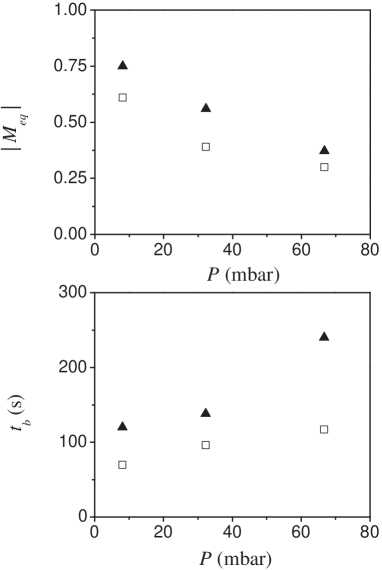
Several experimental parameters influence the performances of optical pumping: the cell geometry, the gas pressure, the discharge conditions (voltage, electrodes configuration) which impact on and , the optical pumping transition, and the pump laser power. A systematic study of optical pumping using the f4 line has been reported in abboud . Here, we focus on the comparison of optical pumping with f4 and f2 lines in the same cells. We present selected results obtained with identical discharge conditions for f4 and f2, using a 0.5 W pump power.
The f2 line yields higher steady-state polarizations but f4 allows pumping with significantly shorter build-up times (Fig.6). As a result, the magnetization production rates are slightly lower for f2 (see Table 1). The main difference between the two optical pumping lines actually lies in the photon efficiency, defined as the number of polarized nuclei per photon absorbed by the gas. A simple calculation, based on the average angular momentum transfer from polarized light to atoms during one absorption-collisional redistribution-spontaneous emission cycle, shows that the photon efficiency of f2 should be approximately twice that of f4. This has been experimentally checked, at various laser powers. Magnetization production rates for f2 pumping are yet slightly lower due to the lower absorption of the pump beam on this line with respect to f4.
| (mbar/s) | ||
|---|---|---|
| (mbar) | f4 | f2 |
| 8 | 0.07 | 0.05 |
| 32 | 0.13 | 0.12 |
| 67 | 0.17 | 0.11 |
IV Discussion
We have compared the performances of two different optical pumping lines at 1.5 T in helium-3 gas, at high pressures (up to 67 mbar). The strongest line of the absorption spectrum (f4) yields the highest magnetization production rates. However, the highest steady-state nuclear polarizations (up to at mbar) are achieved using a weaker line with higher photon efficiency. f2 pumping, requiring fewer absorbed photons to achieve the same production rate, is thus advantageous when long, optically thick pumping cells are used.
Given the structure of sublevels and optical transitions, one could expect that the two most intense lines would be just as efficient as the corresponding lines. Similar optical pumping performances have indeed been obtained, although no systematic comparison has been carried out.
An analysis of all optical pumping data collected at 1.5 T is under way using a detailed model of metastability exchange optical pumping in high field conditions, and will be the subject of a forthcoming paper.
References
- (1) M.S. Albert et al., 1994, Nature 370, 199.
- (2) H. Möller et al., 2002, Magn. Res. in Medicine 47, 1029.
- (3) J. Becker et al., 1998, Nucl. Instrum. Meth. A 402, 327.
- (4) W. Xu et al., 2000, Phys. Rev. Lett. 85, 2900.
- (5) M.A. Bouchiat et al., 1960, Phys. Rev. Lett. 5, 373.
- (6) T.G. Walker, W. Happer, 1997, Rev. Mod. Phys. 69, 629.
- (7) F. D. Colegrove et al., 1963, Phys. Rev. 132, 2561.
- (8) P.-J. Nacher et al., 1985, J. Physique 46, 2057.
- (9) E. Babcock et al., 2003, Phys. Rev. Lett. 91, 123003.
- (10) T.R. Gentile, R.D. Mckeown, 1993, Phys. Rev. A 47, 456.
- (11) M. Batz et al., 2004, NIST Journal of Research, Proceed. Precis. Meas. with Slow Neutrons, in press.
- (12) P.-J. Nacher et al., 2000, Acta Phys. Pol. B 33, 2225.
- (13) M. Abboud et al., 2004, to appear in Europhys. Lett..
- (14) S.V. Chernikov et al., 1997, Electr. Lett. 33, 787.
- (15) E. Courtade et al., 2002, Eur. Phys. J. D 21, 25.