New address: ]Raman Research Institute, C. V. Raman Avenue, Sadashivanagar, Bangalore 560080, India
Continuous loading of an electrostatic trap for polar molecules
Abstract
A continuously operated electrostatic trap for polar molecules is demonstrated. The trap has a volume of 0.6 cm3 and holds molecules with a positive Stark shift. With deuterated ammonia from a quadrupole velocity filter, a trap density of cm-3 is achieved with an average lifetime of 130 ms and a motional temperature of mK. The trap offers good starting conditions for high-precision measurements, and can be used as a first stage in cooling schemes for molecules and as a “reaction vessel” in cold chemistry.
pacs:
33.80.Ps, 33.55.Be, 39.10.+jThe production and storage of cold polar molecules is of considerable interest to physicists and chemists. Once sufficiently cold and dense samples are available, the anisotropic and long-range dipole-dipole interaction can lead to new phases of matter Santos00 ; Baranov02 ; Goral02 . The interaction can even be tuned by external fields allowing one to link polar molecules Bohn03 . Other applications include the study of ultracold chemical reactions Balakrishnan01 . Different methods have been developed to produce and trap cold polar molecules EPJD04 . Here, trapping is defined as the ability to store the particles much longer than the time it would take them to leave the trap volume in the absence of the trapping potential. So far, magnetic trapping was demonstrated for molecules cooled by a buffer-gas Weinstein98 or synthesized from alkali atoms by photoassociation Wang04 . In other experiments decelerated samples of cold molecules were trapped in static Meijer-trap00 ; BethlemPRA02 or oscillating electric fields Veldhoven05 . A basic feature of all these methods is their pulsed operation, where the trap is switched on after the sample has been produced, or the sample is produced in the trap center. From that point onward, the sample decays, e.g. by collisions with background gas, and has to be regenerated. Accumulative methods have been proposed, but remain challenging vandeMeerakkerPRA01 . Such continuously operated traps would be advantageous not only for high-precision measurements where long observation times with samples under constant conditions are required, but also for determining cold collision rates of reacting molecular species.
In this Letter we report on a novel electrostatic trap for polar molecules, which is continuously loaded from an electrostatic quadrupole guide Rangwala03 . Equilibriation of the filling and loss rates results in a steady state population of trapped molecules. The trap works along electrostatic principles already proposed some time ago Wing80 . It confines low-field-seeking molecules in a region with low electric field strength, surrounded by a region with a high electric field. The trap is experimentally demonstrated with deuterated ammonia (ND3), but can be used for all molecules exhibiting significant Stark effect.
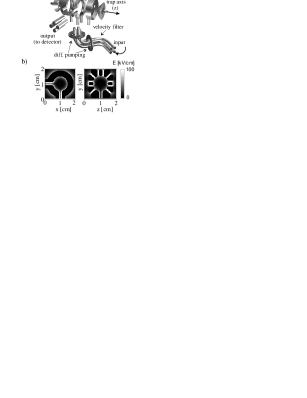
As shown in Fig. 1 a), the trap consists of five ring-shaped electrodes and two spherical electrodes at both ends. Neighboring electrodes carry high voltages of different polarity giving rise to an inhomogeneous electric field, illustrated in Fig. 1 b), which is large near the electrodes and small in the center of the trap. The central ring electrode is intersected two times and local thickening of the neighboring electrodes towards the gaps makes it possible to adapt two quadrupole segments, one for filling and one for extraction of the trapped gas. The inner radii of the five ring electrodes are (2.0; 4.3; 4.8; 4.3; 2.0) mm and the two end electrodes have a diameter of 2 mm. The electrodes are separated by a 1 mm gap and the enclosed volume amounts to 0.6 cm3. With the present setup, a voltage difference of 10 kV between neighboring trap electrodes can be reached. This results in a minimum electric field of 40 kV/cm which the molecules need to overcome in order to escape the trap in regions away from the small entrance and exit holes. At these electric fields, only guided molecules with velocities below 30 m/s can be kept within the trap where the maximum capture velocity depends on the Stark shift of the individual molecule.
Once inside the trap, those molecules which overcome the Stark potential barrier of the trap are either lost by hitting the electrodes or they escape the trap and are pumped away. The remaining molecules undergo multiple reflections off the trap potential, randomizing their motion, and escape via the entrance or exit hole. As the trap surface is large compared to the exit channel area given by the two quadrupolar openings, the probability of finding these holes is small and can even be made arbitrary small by making the trap volume and/or the electric field larger. Even though the trap allows continuous filling, continuous accumulation is not possible in this conservative potential and the trap density equilibrates when the filling rate equals the leak-out rate.
In our experiment, the trap is filled with ND3 from a quadrupole velocity filter as detailed in Junglen04 . In brief, molecules from a thermal reservoir are loaded into a quadrupolar electric field guide via an appropriate nozzle assembly. The quadrupole potential provides filtering of the slowest molecules in the transverse direction whereas the longitudinal filtering is achieved by the centripetal action in a bent part of the guide between the nozzle and the trap. With this technique, a continuously guided flux of the order of 1010 s-1 can be achieved for quadrupole voltages of 5 kV, which results in a maximum electric field of 90 kV/cm. The guided flux consists of a mixture of states with different Stark shifts with the larger Stark shifted states preferentially guided. The longitudinal velocity distribution can be described by a one-dimensional thermal distribution with a most probable velocity of 40 m/s. Due to the two-dimensional confinement at finite field strengths, the transversal velocity distribution is expected to be much narrower. In passing we note that the Stark state distribution in the guide and the trap is the same despite additional filtering in the trap as discussed above.
As the average electric field inside the quadrupole is higher than inside the trap, the molecules are accelerated when entering the trap. It follows that the lowest-velocity molecules are absent in the trap. The properties of the trapped sample are revealed by the molecules which leave the trap through the 17 cm long output quadrupole. Here, the molecules are guided through a differential pumping aperture into a separate vacuum chamber where they are detected by a mass spectrometer (MS). Both the input and output quadrupole guides are separated by a 0.5 mm gap from a short piece of a quadrupole guide formed from the trap electrodes. This separation allows independent switching of the quadrupole segments and the trap. The background pressure in the trap chamber is of the order of 10-10 mbar and even lower in the detection chamber.
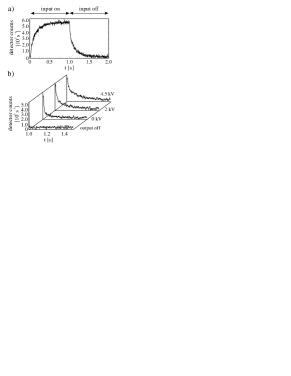
In a first trapping experiment, voltages of 4.5 kV were applied to the trap and the output electrodes while the input quadrupole was switched from 0 kV to 4.5 kV and back every 2 s. The effusive source temperature was set to a constant value of 160 K. Fig 2(a) shows a raw trapping signal obtained after averaging over 4000 cycles. When the input quadrupole is switched on at t0, slow molecules are guided and the trap is filled resulting in an increasing signal at the output quadrupole guide. After the input quadrupole is switched off at t1 s, a signal decay is observed which allows to estimate the lifetime of the molecules in the trap. However, we found that the rising and the falling slope show significant rate of change in signal even 500 ms after switching on or off the input quadrupole. After 500 ms of filling or emptying of the trap, steady state conditions are expected to prevail. Hence, a change of the output flux cannot be caused by the molecules of interest. On the rising slope, the excess signal is likely to be caused by a local pressure increase near the detector after switching on the guiding process. These molecules must be pumped away after switching off the input guide, an effect which leads to a time-dependent signal at the falling slope. These spurious signals can be measured by switching on and off the output quadrupole while the trap is continuously filled: As soon as the output guide is switched off, a rapid decay of the MS signal to the background level is expected, only limited by the time the molecules that already left the guide need to fly to the detector, typically less than 1.0 ms. Indeed, a fast decay can be observed but it is accompanied by a slow decay with a 1/e-time of 150 ms. Assuming that the guided flux into the detector is a sharp step function , the measured signal is used to determine the deconvolution kernel, , where denotes the Fourier transform. For determining the lifetime of the molecules in the trap, the measured decay signal, , is deconvoluted by the transformation , where denotes the inverse Fourier transform. After deconvolution the slow rise and fall of the signal ms after switching on and off the input guide vanishes.
Having described the deconvolution process, we now discuss the trap measurements in which the input quadrupole is periodically switched. In order to demonstrate that the decay rate originates from the trap dynamics, an artificial hole was created in the trap by rapidly lowering the voltage on one small ring electrode to a constant value when the input quadrupole and accordingly the filling process is switched off. Fig. 2(b) shows the decay signals after deconvolution for reduced voltages on the particular ring electrode of 0, 2 and 4.5 kV, respectively. In the decay measurement where the voltage has been switched to 0 kV, a fast decay can be observed followed by a small and slow decay contribution. The fast decay is caused by the losses due to the weaker field near the particular ring electrode. The molecules causing the slow decay are either too slow to overcome even the weak field potential barrier or they do not encounter the weak field on their way inside the trap. Note that the start of the decay is delayed by the time the molecules need to pass through the output quadrupole. When the voltage on the ring electrode is raised to 2.0 kV, the loss rate decreases which leads to a reduction of the fast decay contribution whereas the slow decay caused by molecules which are trapped longer is more pronounced. For the remaining curve the voltage on the electrode is set to 4.5 kV and here the slow decay is dominant.
Note that the initial fast decay can always be observed. Simulations show that this decay is caused by a class of molecular trajectories which approximately are confined in the plane defined by the middle ring electrode. As both exit channels lie in this plane a fast escape is very probable. For those molecules whose trajectories fill the whole trap volume the escape probability is reduced leading to a longer trapping time. As the lifetime of the molecules in the trap depends on how fast they find an exit, the lifetime is velocity dependent. Therefore, the decay cannot be described by an exponential function and, hence, not by a (1/e)-lifetime. An alternative measure for the trap lifetime is the time after which half the molecules have left the trap. From the data for kV a lifetime of 130 10 ms can be derived.
The lifetime is mainly limited by the exit channels whereas collisions with the background gas do not contribute significantly. As the field vanishes only at some regions in the center of the trap, Majorana transitions to nontrapping Stark levels are not very likely. With the angle distribution of the guided molecules behind the output quadrupole and the sensitivity of the MS the total flux emerging from the trap can be determined. From the measured angle distribution it has been determined that only 15 percent of the guided flux reaches the detector. As the detector sensitivity is of the order of 10-4 counts/molecule the guided flux from the trap with all electrodes set to 4.5 kV amounts to 3108 s-1. Similar trapping results were obtained with formaldehyde (CH2O) and methylchloride (CH3Cl) which also show a linear Stark effect.
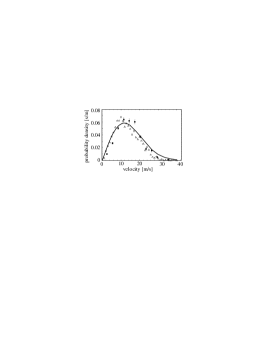
In the following the temperature of the trapped ND3 sample is determined by a measurement of the molecules’ velocity distribution. Therefore, a time-of-flight measurement is performed where the trap is continuously filled and only the output quadrupole is switched on and off at rate 1 Hz. All electrodes were set to voltages of 4.5 kV. As soon as the output quadrupole is switched on, molecules from the trap are guided to the detector where their arrival time is recorded. After more than 50,000 cycles a clear time-of-flight signal has developed. From the delay and the rising slope the longitudinal velocity distribution can be derived by differentiation. For a single molecular state, the velocity distribution should show a relatively sharp velocity cut-off because the guide and the trap filter on kinetic energy. But given a mixture of states with different Stark shifts, the cut-off is smeared out so that the velocity distribution can be described by a one-dimensional thermal distribution. As the time-of-flight signal is affected by the above-mentioned spurious signal, the measured signal was deconvoluted according to the method described above. Fig. 3 shows the velocity distribution obtained from the deconvoluted data. It can be described by a characteristic velocity m/s with =, where is the Boltzmann constant, the temperature and the molecular mass. The characteristic velocity is equivalent to the most probable speed of a thermal gas in a three-dimensional volume element. This velocity corresponds to a motional temperature of 300 mK. Note that the lowest velocity molecules may be partially depleted by collisions in the nozzle where the densities are relatively high. Note also that the molecular velocities in the output quadrupole are slightly smaller than inside the trap because the molecules are decelerated when entering the higher quadrupole field. However, as there are only conservative potentials involved, the temperature of the sample does not change. The experimental data are in good agreement with the simulation. As expected, the temperature of 300 mK is smaller than the trap depth of 800 mK derived from the average Stark potential.
The transverse velocity distribution of the trapped molecules can be estimated by recording the decrease of the flux of guided molecules in the output quadrupole when the electric field in the latter is reduced. During the measurements, the voltages on the input quadrupole and the trap were set to 4.5 kV and the input was modulated. In each measurement the electric field in the output quadrupole was set to a different but constant value. It was observed that more than 90 of the flux from the trap can be guided even if the output quadrupole voltage is reduced down to 750 V so that most of the molecules can be two-dimensionally trapped in an electric field of only 15 kV/cm. Below this voltage, the guided flux decreases and at voltages of 160 V (3 kV/cm), for example, the initial flux has reduced by a factor of two. The measured decrease of the signal amplitude as a function of the output quadrupole voltage is in good agreement with the simulation of the experiment. This justifies the assumption that the simulated transverse velocity distribution with its characteristic velocity of m/s describes the experiment well. It follows that the characteristic velocity of the longitudinal distribution is roughly equal to the characteristic velocity determined for the transversal velocity distribution, which is in contrast to the situation in the input quadrupole guide. There, the longitudinal velocities can be much higher as longitudinal filtering is less restrictive than transverse filtering. The trap randomises the input velocity which leads to an equilibration of the transverse and longitudinal velocity distributions, as is also obtained in the simulation. With the knowledge of the average speed and the total molecular flux out of the trap, one can estimate the number density in the trap by where is the effective area of each of the two exit channels. From simulations we know that the molecular density distribution inside the guide with voltages of 4.5 kV has a half width of 400 m. Taking this as the radius of a circular area A and assuming an average velocity of 18 m/s, the number density inside the trap is of the order of 108 cm-3.
To summarize, a continuously loaded, large-volume electrostatic trap for polar molecules has been demonstrated experimentally. Our results show that a sample of ND3 molecules at a density of 108 cm-3 can be trapped with a lifetime of 130 10 ms. The trap is filled from a quadrupole guide, but it is also conceivable to produce molecules inside the trap, for example by reactive collisions Loesch or crossed molecular beams Elioff03 . These molecules could be cooled by a buffer gas Weinstein98 or light scattering Vuletic00 . A simple modification of the present trap with three guides coupled to it could lead to the intriguing possibility of an electrostatic “reaction vessel”. Two of the guides could be used to load different species of molecules into the trap and the third guide could be used to extract and detect the reaction products. If the trap volume is large, the lifetime and the number of molecules is expected to increase so that reactions inside the trap become possible even at the present densities. Provided electrostatic or mechanical valves can be developed, one can even envision a small cold chemical factory made out of a network of interconnected reaction vessels with new possibilities in controlling chemical reactions.
References
- (1) L. Santos et al., Phys. Rev. Lett. 85, 1791 (2000).
- (2) M.A. Baranov et al., Phys. Rev. A 66, 013606 (2002).
- (3) K. Góral, L. Santos, and M. Lewenstein, Phys. Rev. Lett. 88, 170406 (2002).
- (4) A.V. Avdeenkov and J.L. Bohn, Phys. Rev. Lett. 90, 043006 (2003).
- (5) N. Balakrishnan and A. Dalgarno, Chem. Phys. Lett. 341, 652 (2001).
- (6) See, e.g., the special issue on ultracold polar molecules, Eur. Phys. J. D 31, 149-445 (2004).
- (7) J.D. Weinstein et al., Nature (London) 395, 148 (1998).
- (8) D. Wang et al., Phys. Rev. Lett. 93, 243005 (2004).
- (9) H.L. Bethlem et al., Nature (London) 406, 491 (2000).
- (10) H.L. Bethlem et al., Phys. Rev. A 65, 053416 (2002).
- (11) J. van Veldhoven, H.L. Bethlem, and G. Meijer, Phys. Rev. Lett. 94, 083001 (2005).
- (12) S.Y.T. van de Meerakker et al., Phys. Rev. A 64, 041401(R) (2001).
- (13) S.A. Rangwala et al., Phys. Rev. A 67, 043406 (2003).
- (14) W.H. Wing, Phys. Rev. Lett. 45, 631 (1980).
- (15) T. Junglen et al., Eur. Phys. J. D 31, 365 (2004).
- (16) H.-J. Loesch, private communication.
- (17) M.S. Elioff, J.J. Valentini, and D.W. Chandler, Science 302, 1940 (2003).
- (18) V. Vuletić and S. Chu, Phys. Rev. Lett. 84, 3787 (2000).