Frequency comparisons and absolute frequency measurements of 171Yb+ single-ion optical frequency standards
E. Peik1,∗, B. Lipphardt1, H. Schnatz1, T. Schneider1, Chr. Tamm1,
S. G. Karshenboim2,3
1Physikalisch-Technische Bundesanstalt,
Bundesallee 100, 38116 Braunschweig, Germany
2D. I. Mendeleev Institute for Metrology (VNIIM), 198005 St. Petersburg, Russia
3Max-Planck-Institut für Quantenoptik, 85748 Garching, Germany
∗ e-mail: ekkehard.peik@ptb.de
Abstract
We describe experiments with an optical frequency standard based on a laser cooled 171Yb+ ion confined in a radiofrequency Paul trap. The electric-quadrupole transition from the ground state to the state at the wavelength of 436 nm is used as the reference transition. In order to compare two 171Yb+ standards, separate frequency servo systems are employed to stabilize two probe laser frequencies to the reference transition line centers of two independently stored ions. The experimental results indicate a relative instability (Allan standard deviation) of the optical frequency difference between the two systems of only, so that shifts in the sub-hertz range can be resolved. Shifts of several hertz are observed if a stationary electric field gradient is superimposed on the radiofrequency trap field. The absolute optical transition frequency of Yb+ at 688 THz was measured with a cesium atomic clock at two times separated by 2.8 years. A temporal variation of this frequency can be excluded within a relative uncertainty of yr-1. Combined with recently published values for the constancy of other transition frequencies this measurement provides a limit on the present variability of the fine structure constant at the level of yr-1.
1 Introduction
Time and frequency are presently by far the most precisely measurable physical quantities and optical atomic frequency standards hold great potential for further improvements in stability and accuracy. A single trapped and laser cooled ion can be used as a reference that offers excellent control over possible systematic effects. Presently, a number of groups is pursuing research along these lines with different ions (see [1, 2] for recent reviews). High-resolution spectroscopy and precise frequency measurements using femtosecond laser frequency comb generators [3] have been performed with reference transitions in Sr+ [4, 5], In+ [6, 7], Yb+ [8, 9, 10, 11] and Hg+ [12, 13].
In this paper we review two recent experiments at PTB with an optical frequency standard based on the 171Yb+ ion: (i) frequency comparisons between two ions in separate traps are used to investigate the stability and to evaluate systematic frequency shifts [14], (ii) a sequence of absolute optical frequency measurements has been made using a cesium fountain clock in order to test the reproducibility of the standard and to obtain a stringent limit on a possible temporal variation of the fine structure constant [15].
2 171Yb+ optical frequency standard
The 171Yb+ ion is attractive for an optical frequency standard because reference transitions with vanishing low-field linear Zeeman frequency shift are available in a level system with relatively simple hyperfine and magnetic sublevel structure (cf. Fig. 1a). The electric quadrupole transition at 436 nm wavelength can serve as the reference transition, with a natural linewidth of 3.1 Hz. A single ytterbium ion is trapped in a miniature Paul trap and is laser-cooled to a sub-millikelvin temperature by exciting the low-frequency wing of the quasi-cyclic component of the resonance transition at 370 nm. A static magnetic field of approximately mT is applied in order to prevent optical pumping to a nonabsorbing superposition of the magnetic sublevels of the ground state. The natural linewidth of this transition is 21 MHz, which implies a one-dimensional kinetic temperature of 0.6 mK at the Doppler cooling limit. A weak sideband of the cooling radiation provides hyperfine repumping from the ground state to the level. At the end of each cooling phase, the hyperfine repumping is switched off in order to prepare the ion in the ground state. The rapid spontaneous decay from the state to the sublevel of the metastable state that occurs during laser cooling is compensated for by coupling this level with an additional laser at 935 nm wavelength to the state, from where the ion readily returns to the ground state. The sublevel of the state is not rapidly populated or depleted by the laser cooling excitation. Individual quantum jumps to this state due to excitation of the reference transition can therefore be detected using the electron shelving scheme.

The electric quadrupole reference transition is probed by the frequency doubled radiation from a diode laser emitting at 871 nm. The short term frequency stability of this laser is derived from a temperature-stabilized and seismically isolated high-finesse reference cavity. Figure 1b shows a high-resolution excitation spectrum obtained with 90 ms long laser pulses, leading to an approximately Fourier-limited linewidth in the range of 10 Hz, or a resolution of . Since the duration of the probe pulse is longer than the lifetime of the excited state (51 ms), the observed maximum excitation probability is limited by spontaneous decay. In order to operate the system as a frequency standard, both wings of the resonance are probed alternately, and the probe light frequency is stabilized to the line center according to the difference of the measured excitation probabilities.
3 Frequency comparisons between two trapped ions
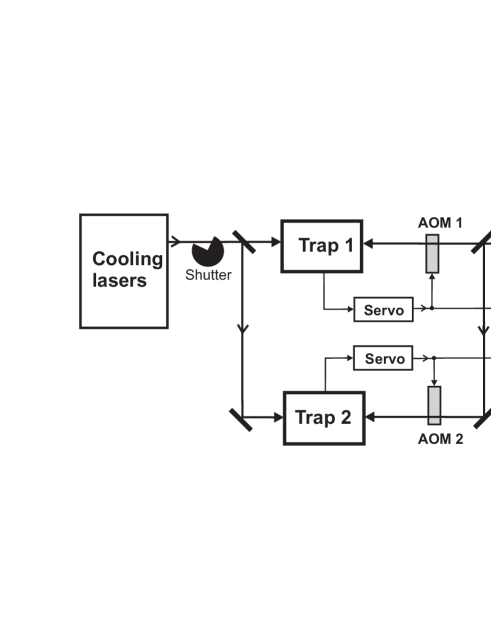
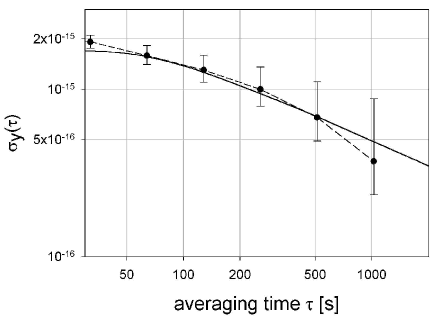
To enable a quantitative study of systematic frequency shifts on the sub-hertz scale, we compare the line center frequencies of two 171Yb+ ions stored in separate traps. The scheme of the frequency comparison experiment is shown in Fig. 2. Both traps use the same cooling laser setup and synchronous timing schemes for cooling, state preparation, and state detection. The beam from the probe laser is split and two separate frequency shift and servo systems are employed to stabilize the probe frequencies to the reference transition line centers of the two ions. The atomic resonance signal is probed in typically eight excitation cycles until an error signal is calculated and the detunings between the probe laser frequency and the probe light beams incident on the traps are corrected. The servo time constants are in the range of 10 s. In order to minimize servo errors due to the drift of the probe laser frequency, a second-order integrating servo algorithm is used. The differences of the detunings imparted on the probe beams are averaged over time intervals of 1 s and recorded. As a measure of the instability, the Allan deviation of a typical data set is shown in Fig. 3. The result indicates a relative instability of the frequency difference between the two systems of . The atomic resonance signals were resolved with Fourier-limited linewidths of approximately 30 Hz in both traps. For averaging times that are longer than the time constants of the servo systems, the so-called quantum projection noise [16] limits the instability. This contribution to the instability is dominant because the state measurement is done on a single atom only. We have performed a numerical calculation which simulates the effect of quantum projection noise for the realized experimental conditions and include the result as the solid line in Fig. 3, showing good agreement with the measured data.
The mean frequency difference between the two traps was generally in the hertz or sub-hertz range for nominally unperturbed conditions [14]. The dominant source of systematic uncertainty in the 171Yb+ optical frequency standard is the so-called quadrupole shift of the atomic transition frequency. It is due to the interaction of the electric quadrupole moment of the state with the gradient of the static electric field in the trap. In order to experimentally determine the 171Yb+ quadrupole moment, a static field gradient was generated in one of the traps by superimposing a constant voltage on the radiofrequency trap drive voltage. The orientation of this field gradient is determined by the symmetry axis of the trap. The other trap was operated with a pure rf voltage and served as a reference. From this experiment, we infer a quadrupole moment of for the level with being the elementary charge and the Bohr radius. The uncertainty is mainly determined by the uncertainty of the measurement of the angle between the magnetic field and the trap axis. Depending on the orientation, a field gradient of 1 V/mm2 may produce a frequency shift of up to 6 Hz. Averaging the frequency over three orthogonal quantization axes – i.e. axes of the magnetic field – allows to determine the unperturbed transition frequency [17].
4 Absolute frequency measurements
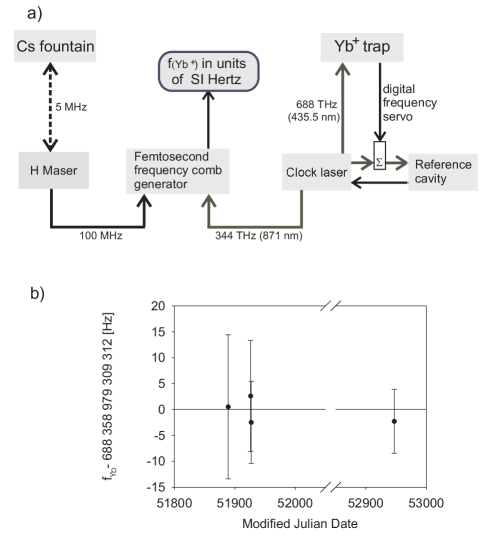
The absolute frequency of the 171Yb+ standard at 688 THz was measured relative to a cesium fountain clock [18], using the setup shown schematically in Fig. 4a. A hydrogen maser is referenced to the cesium clock and delivers a signal at 100 MHz with a relative instability below in 1000 s of averaging. The link between the optical and microwave frequencies is established with a femtosecond-laser frequency comb generator. The 171Yb+ frequency was measured first in December 2000 and January 2001. The result was Hz with a total measurement uncertainty of Hz [8]. In November 2003, the frequency was remeasured after improvements in the resolution of the ionic resonance and in the frequency comb generator setup. The new value has a total uncertainty of 6.2 Hz and is insignificantly lower by 2.3 Hz. The dominant source of systematic uncertainty is the quadrupole shift that may be produced by patch charges on the trap electrodes. The static quadrupole potential associated with these charges will also alter the oscillation frequencies of the ion in the trap. Measurements of the oscillation frequencies allow to estimate the uncertainty due to the quadrupole shift as 3 Hz under the conditions of the experiment. The total uncertainty of 6.2 Hz (corresponding to a relative uncertainty of ) contains also a systematic contribution of 2.2 Hz from the microwave reference and frequency comb generator and a total statistical contribution of 4.8 Hz.
From the sequence of absolute frequency measurements (cf. Fig. 4b) we deduce a value for the fractional temporal variation of the frequency ratio of yr-1, consistent with zero. This result can be used to obtain a limit on the temporal variation of the fine structure constant.
5 Variations of fundamental constants
Discussions about a possible temporal variability of fundamental constants of nature date back until the 1930s, with Dirac’s large number hypothesis [19] being a prominent example. Meanwhile, strong motivation to search for such an effect has developed because theories that attempt to unify the fundamental interactions allow or even imply temporal variations of the coupling constants (see e.g. [20]). Variations of the constants have been searched for in various systems [21, 22]. Sommerfeld’s fine-structure constant (composed of the elementary charge , Planck’s constant , the speed of light , and the electric constant of vacuum ) is presently the most important test case because it is the fundamental coupling constant of the electromagnetic interaction. As a dimensionless quantity can be determined without reference to a specific system of units. This point is important because the realization of the units themselves may also be affected by variations of the constants.
An indication for a possible variation of comes from a shift of wavelengths of specific absorption lines produced by interstellar clouds in the light from distant quasars [23]. These observations seem to suggest that about yr ago the value of was smaller than today by , representing evidence for a varying [24]. Assuming a linear increase in with time, this would correspond to a drift rate [24]. Recent evaluations of new data on quasar absorption lines are consistent with for all look-back times [25].
To perform a laboratory tests for the variability of in the present epoch one can compare different electronic transition frequencies in the optical range [26, 27]. For the analysis, we express the electronic transition frequency as
| (1) |
where Hz is the Rydberg constant in SI units of frequency, appearing here as the common atomic scaling factor. is a numerical constant which depends only on the quantum numbers characterising the atomic state and which is independent of time. is a dimensionless function of that takes into account level shifts due to relativistic effects [28]. In many-electron atoms these effects lead to different sensitivities of the transition frequencies to a change of , with the general trend to find a stronger dependence in heavier atoms [29]. The relative temporal derivative of the frequency can be written as:
| (2) |
The first term represents a variation that would be common to all measurements of electronic transition frequencies: a change of the numerical value of the Rydberg constant in SI units, i.e. with respect to the 133Cs hyperfine splitting. We distinguish here between the numerical value of and the physical parameter which determines the atomic energy scale. A change of the latter would not be detectable in this type of measurement because the 133Cs hyperfine splitting also scales with this quantity. Consequently, the detection of a non-zero value of would have to be interpreted as being related to a change of the nuclear magnetic moment of 133Cs. The second term in Eq. 2 is specific to the atomic transition under study. The sensitivity factor for small changes of has been calculated for a number of cases of interest by Dzuba, Flambaum et al. [28]. Assuming that all possible drifts are linear in time over the duration of the frequency comparisons, the fractional drift rate can be obtained from at least two measured drift rates of transition frequencies if these have been measured against a common reference, and if the sensitivity factors for the two transitions are different.
To derive the limit on we combine the data from 171Yb+ with a published limit on the drift rate of a transition frequency in 199Hg+ [13], obtained at NIST (Boulder, USA). In Hg+ the transition at 282 nm (1065 THz) with a natural linewidth of 1.9 Hz serves as the reference. A first absolute frequency measurement of this transition with respect to a cesium clock was published in 2001 with an uncertainty of [30]. A sequence of measurements over the period from August 2000 to November 2002 has resulted in a constraint for the fractional variation of at the level of yr [13]. The sensitivities of the ytterbium and mercury transition frequencies to changes of are quite different: and [28].
A further precision test for the constancy of an optical transition frequency was presented by Fischer et al. who measured the transition frequency in atomic hydrogen in two periods in July 1999 and in February 2003, using a transportable cesium fountain frequency standard [31]. The limit on the fractional drift rate for the hydrogen frequency that is deduced from these experiments is yr-1 [31] with the sensitivity factor being zero.

Plotting the three limits on the frequency drift rates as a function of (Fig. 5a) and performing a weighted linear regression we obtain from the slope of the fit:
| (3) |
for the present value of the temporal derivative of the fine structure constant at the confidence level of . This limit is based on a model-independent analysis, not using assumptions on correlations between drift rates of different quantities and not postulating the drift rate of any quantity to be zero. To our knowledge, this is so far the most stringent limit on obtained from atomic clock comparisons [15]. Another related analysis based on the data from hydrogen and mercury is presented in [31].
The intercept of the straight line representing the dependence of the optical frequency drift rate on with the line in Fig. 5a can be used to determine the drift rate of the numerical value of the Rydberg frequency. This quantity is of great metrological importance. A non-zero value would imply among other consequences that a time scale generated with a cesium clock would not be uniform with respect to other atomic oscillations. The result that we obtain here is consistent with zero:
| (4) |
Fig. 5b shows how the measurements of the three transition frequencies contribute to the constraints on the temporal derivatives of and . The central hatched area is bounded by the standard uncertainty ellipse (see Ref. [15] for details).
With these results we reach a sensitivity for with yr that approaches that of the quasar observations [24, 25] to within about a factor of three if a linear change of is assumed on a cosmological time scale. Further improvements in the data from clock comparisons can be expected since trapped ions have the potential to reach relative uncertainties in the range of for the comparison of optical transition frequencies [1]. The kind of analysis that we have applied here to the frequencies of the quadrupole transitions in 171Yb+ and 199Hg+ and of the transition in H may be extended to other atomic systems as soon as precision data on frequency drift rates become available.
Acknowledgements
We are grateful to A. Bauch, S. Weyers and R. Wynands for contributions to the experiments and helpful discussions. This work was partially supported by DFG through SFB 407 and by RFBR under grants 03-02-04029.
References
- [1] A. A. Madej, J. E. Bernard, in: Frequency Measurement and Control: Advanced Techniques and Future Trends, Topics in Applied Research, Ed.: A. N. Luiten (Springer, Berlin, Heidelberg, 2000).
- [2] P. Gill et al., Meas. Sci. Tech. 14, 1174 (2003).
- [3] J. Reichert, M. Niering, R. Holzwarth, M. Weitz, Th. Udem, T.W. Hänsch, Phys. Rev. Lett. 84, 3232 (2000); S.A. Diddams, D.J. Jones, J.Ye, S.T. Cundiff, J.L. Hall, J.K. Ranka, R.S. Windeler, R. Holzwarth, Th. Udem, T.W. Hänsch, Phys. Rev. Lett. 84, 5102 (2000).
- [4] J. E. Bernard, A. A. Madej, L. Marmet, B. G. Whitford, K. J. Siemsen, S. Cundy, Phys. Rev. Lett. 82, 3228 (1999).
- [5] H. S. Margolis et al., Phys. Rev. A 67, 032501 (2003).
- [6] J. v. Zanthier et al., Opt. Lett. 25, 1729 (2000).
- [7] Th. Becker, J. von Zanthier, A. Yu. Nevsky, Ch. Schwedes, M. N. Skvortsov, H. Walther, E. Peik, Phys. Rev. A 63, 051802(R) (2001).
- [8] J. Stenger, Chr. Tamm, N. Haverkamp, S. Weyers, and H. Telle, Opt. Lett. 26 1589 (2001).
- [9] Chr. Tamm, D. Engelke, and V. Bühner, Phys. Rev. A 61, 053405 (2000).
- [10] Chr. Tamm, T. Schneider, and E. Peik, in: Proc. of the 6. Symp. on Frequency Standards and Metrology, Ed.: P. Gill (World Scientific, Singapore, 2002).
- [11] P. Blythe et al., Phys. Rev. A 67, 020501(R) (2003).
- [12] R. J. Rafac, B. C. Young, J. A. Beall, W. M. Itano, D. J. Wineland, and J. C. Bergquist, Phys. Rev. Lett. 85, 2462 (2000).
- [13] S. Bize et al., Phys. Rev. Lett. 90, 150802 (2003).
- [14] Chr. Tamm, T. Schneider, and E. Peik, in: Laser Spectroscopy XVI, Eds.: P. Hannaford, A. Sidorov, H. Bachor, and K. Baldwin (World Scientific, Singapore, 2004).
- [15] E. Peik, B. Lipphardt, H. Schnatz, T. Schneider, Chr. Tamm, S. G. Karshenboim, Phys. Rev. Lett. 93, 170801 (2004).
- [16] W. M. Itano et al., Phys. Rev. A 47, 3554 (1993).
- [17] W. M. Itano, J. Res. NIST 105, 829 (2000).
- [18] A. Bauch, Meas. Sci. Technol. 14, 1159 (2003).
- [19] P. A. M. Dirac, Nature 139, 323 (1937).
- [20] J. D. Barrow, Astrophys. Space Sci. 283, 645 (2003).
- [21] Astrophysics, Clocks and Fundamental Constants, Lecture Notes in Physics Vol. 648, Eds.: S. G. Karshenboim and E. Peik (Springer, Heidelberg, 2004).
- [22] J.-P. Uzan, Rev. Mod. Phys. 75, 403 (2003).
- [23] J. K. Webb et al., Phys. Rev. Lett. 87, 091301 (2001).
- [24] M. T. Murphy, J. K. Webb, V. V. Flambaum, Mon. Not. R. Astron. Soc. 345, 609 (2003).
- [25] R. Quast, D. Reimers, S. A. Levshakov, Astr. Astrophys. 415, L7 (2004); R. Srianand, H. Chand, P. Petitjean, B. Aracil, Phys. Rev. Lett. 92, 121302 (2004).
- [26] S. Karshenboim, Can. J. Phys. 78, 639 (2001).
- [27] S. G. Karshenboim, eprints physics/0306180 and physics/0311080.
- [28] V. A. Dzuba, V. V. Flambaum, J. K. Webb, Phys. Rev. A 59, 230 (1999); V. A. Dzuba, V. V. Flambaum, Phys. Rev. A 61, 034502 (2000); V. A. Dzuba, V. V. Flambaum, M. V. Marchenko, Phys. Rev. A 68, 022506 (2003).
- [29] J. D. Prestage, R. L. Tjoelker, L. Maleki, Phys. Rev. Lett. 74, 3511 (1995).
- [30] Th. Udem et al., Phys. Rev. Lett. 86, 4996 (2001).
- [31] M. Fischer et al., Phys. Rev. Lett. 92, 230802 (2004).