Momentum Analysis in Strong-field Double Ionization
Abstract
We provide a basis for the laser intensity dependence of the momentum distributions of electrons and ions arising from strong-field non-sequential double ionization (NSDI) at intensities in the range . To do this we use a completely classical method introduced previously ho-etal05 . Our calculated results reproduce the features of experimental observations at different laser intensities and depend on just two distinct categories of electon trajectories.
pacs:
32.80.Rm, 32.60.+iI Introduction
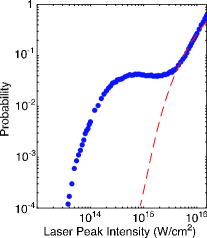
When atoms with two or more electrons are exposed to an ultra-short (10-600 femtoseconds) and ultra-strong () laser pulse, two electrons can be ripped off from the nucleus. This strong-field double ionization process has been observed in all inert gas atoms fittinghoff-etal ; walker-etal ; NSDI-atoms and some molecules NSDI-molecules . The remarkable aspect of this process is its strong electron pair correlation. Uncorrelated electrons are ionized sequentially, each event well explained by single-ionization theory PPT-ADK . This sequential ionization theory cannot explain a characteristic knee-like structure observed in the double-ionization yield (see Fig. 1) as a function of laser intensity, so this process is usually known as nonsequential double ionization (NSDI).
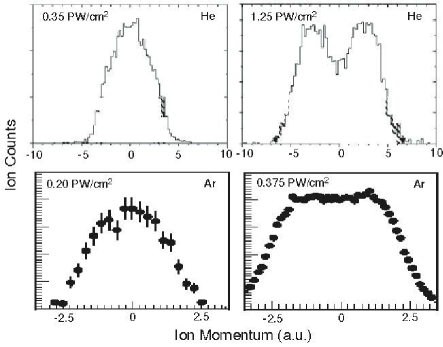
In addition to ion yield, experiments in the intensity regime of the knee-like structure have examined recoil ion momentum distributions in which the shape depends strongly on laser intensity weber_He ; weber_Ar ; feuerstein_Ar ; eremina ; Ullrich-jpb04 ; Ullrich-04 ; moshammer_Ne . Distributions for different atomic species (helium, neon and argon) show different shape variations as a function of laser intensity, as shown in Fig. 2: at low laser intensities there are more low-momentum or zero-momentum ions, giving a narrow distribution peaked at zero momentum, whereas at higher laser intensity the high-momentum ions become more dominant and the distribution becomes broader.
A variety of theoretical initiatives have been pursued corkum ; taylor ; smatrix ; coulomb-focusing ; softcollision ; Texas with the goal of understanding NSDI effects including ion yield and final-state momenta. With the exception of the calculations made by the Taylor group that are applicable only to helium taylor , all have ad hoc elements that are not easy to justify fully, and none have successfully dealt with the intensity-dependence of the shapes of the experimental momentum distributions shown in Fig. 2.
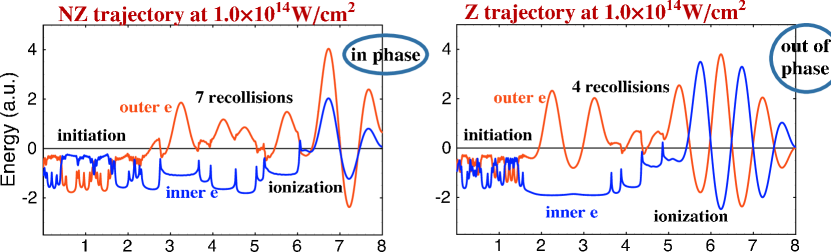
Recently we pursued a fully classical theory ho-etal05 as an explanation for the electron correlation in NSDI and suggested that the major features of NSDI arise naturally without needing to engage quantum processes at all, not even tunnelling as the initial step in NSDI. In such a treatment the NSDI process is a consequence of both electrons actively responding to the laser field and to each other and to the nuclear attraction, undergoing ordinary (but complicated) Hamiltonian dynamics throughout the duration of the laser pulse. As one consequence, double ionization can be easily seen to occur in four universal stages (see Fig. 3).
In this brief note we provide calculational evidence supporting a classical interpretation of the intensity-dependent changes in the shape of ion recoil momentum distributions that are shown in Fig. 2. The calculations suggest the active presence of two distinct categories of two-electron ejection from the atom, loosely speaking associated with back to back ejection on the one hand and side by side ejection on the other hand. In the first case one can expect that little net momentum will be carried by the pair and in the second case the net electron momentum can be substantial. For ease of description we have labelled these as the Z and NZ categories Ho-Eberly03 ; ho-etal05 , meaning “zero” and “non-zero” momentum to impart to the ion.
Our approach will be to display the results of entirely classical calculations of the NSDI electron trajectories as evidence that the Z-NZ distinction exists, and then show that it explains the origin of the laser intensity dependence of the shape of the momentum distributions shown in Fig. 2.
II Classical Ensemble Method
We use the classical ensemble method that has been described in detail by Panfili, et al. Panfili-etal01 . The idea is to use a large number of classical electron pairs (100,000 - 500,000 members) to model the dynamical evolution of a two-electron system exposed to an intense laser field.
We are interested only in the forward-backward aspects of the recoil ion momentum, what is measured as the longitudinal momentum (i.e., along the axis of the laser polarization). This means that the one-dimensional aligned-electron approximation (AEA) Javanainen-etal87 , in which the response of each electron is restricted to the axis of the laser polarization, will be adequate. All of the relevant experimental data is for linearly polarized laser light, which is the vast majority of available data. We also use the so-called Rochester screened Coulomb potential Javanainen-etal87 to model the nuclear binding potential and electron-electron repulsion potential. We have previously shown that the character of the NSDI process (recall Fig. 3) obtained using this 1d model does not differ much from that of 3d ho-etal05 . In addition, Haan, et al. have shown that there are striking similarities in the dynamical evolution of the classical ensemble calculations and the corresponding quantum 2-e wave functions Panfili-etal02 ; haan-etal02 .
Each electron pair is given a different set of initial conditions but each pair is given an initial energy of -2.24 a.u., which corresponds to the energy of the two-electron quantum ground state. We use to denote the optical field, where is the maximum field strength, is the envelope function. We take an 8-cycle ( 25 fs) sinusoidal laser pulse with the wavelength 780 nm (frequency = 0.0584 a.u.) and a trapezoidal envelope with 2-cycle turn-on and turn-off.
The response of the two electrons can be obtained by solving two coupled Newtonian equations of motion:
Here and are the positions of two electrons, and clearly the evolution of each electron pair can be visualized as a distinct trajectory in the plane. In this treatment all Coulombic forces and laser-electron forces are acting continuously and simultaneously, and both electrons are continually dynamically active.
III Calculated Momentum Distributions of Ions and Electrons
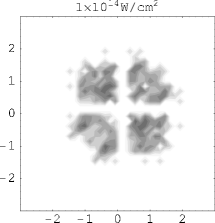
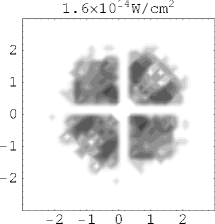
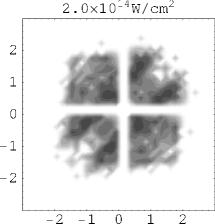
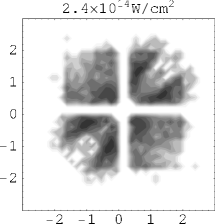
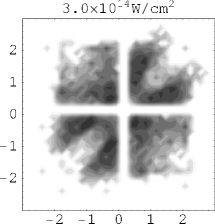
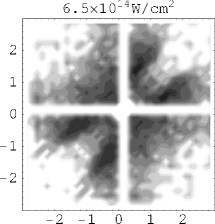
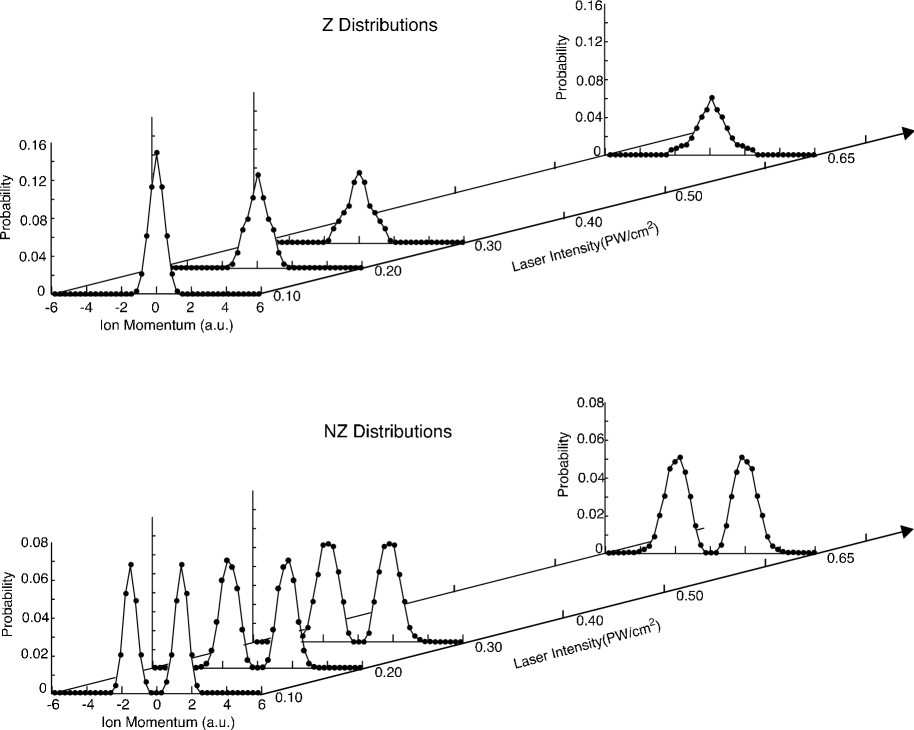
Calculations based on the ensemble method provide a wealth of “experimental” information at every intensity. Fig. 4 shows the two-electron momentum plane at the end of the laser pulse for each of six different laser intensities. The planes contains dense distributions of doubly ionized electron-pair points. Electron pairs with opposite momenta (Z category) produce points in the second and fourth quadrants, and electron pairs moving together (NZ category) provide the points in the first and third quadrants. These points yield theoretical ion momentum distributions for the Z and NZ pairs, and these distributions are found to have different shapes, and also different behaviors as a function of intensity. The calculated shapes are shown with their intensity dependences in Fig. 5. In both categories the shapes broaden with increasing intensity, more so in the NZ case. More significantly, in both categories the peak of the distribution drops with increasing intensity, but this effect is much stronger for the Z category. Analysis of the time evolution of Z and NZ trajectories, and their relative ability to produce the NSDI “jets” that have been discussed previously haan-etal02 ; Panfili-etal02 , will be reported separately.


The combined result of broadening and peak-height decrease is a predicted substantial shift in probability in favor of the NZ category. As shown in Fig. 6, the relative probability P(Z) - P(NZ) is predicted to change sign as the intensity exceeds a few times watts/cm2, first strongly favoring the Z category at low intensity and then above about watts/cm2 strongly favoring the NZ category. This correlates with the change in appearance of the panels in Fig. 4 and we can see that this Z NZ shift is adequate to explain the shape variation with increasing intensity in the experimental curves shown in Fig. 2. Additional quantitative comparisons can be obtained if the Z and NZ data are combined to make calculated total-momentum distributions.
Fig. 7 plots the calculated ion momentum distributions obtained by combining Z and NZ contributions for intensities in the range of , similar to the range in some of the experiments. Details of the distributions depend to a degree on the definition of double ionization, as explained already in Fig. 4, but the main characteristics are quite stable. By comparing our calculated results with those measured experimentally (recall the data in Fig. 2), we find the following similarities in the laser intensity dependence of the shape of the momentum distribution:
(1) The width of the distribution increases with the laser intensity. The helium experiment shows that the base width of the distribution changes from 8 a.u. at to 12 a.u. at , and the argon experiment shows that the base width of the distribution changes from 10 a.u. at to more than 12 a.u. at . Similarly, our calculated distribution has the base width of 6 a.u. at . This width is raised more than 50% trajectories to about 10 a.u. at .
(2) More low or zero momentum ions are observed at low laser intensities, whereas more high or nonzero momentum ions are observed at high laser intensities. Such a transition is clearly illustrated both in the experiment and our calculation, in which the side peaks become higher and wider as the laser intensity increases.
One can see from the calculated two-electron momentum distributions that four NZ regions near one axis but relatively far from the origin have the highest density of NZ trajectories, and two Z regions near the origin have the highest density of Z trajectories. The presence of these densely populated regions indicates that the momenta of two electrons are correlated. We find that our classical calculations show similarities with the quantum results of Lein, lein , obtained by solving the time-dependent Schrödinger equation for the same model with similar parameters. The locations of the highest density two-electron trajectories are in good agreement with the quantum calculations. This is a further confirmation that the dynamics of two electrons in a strong laser field has definite classical attributes.
IV Summary
We have used a completely classical method to investigate the laser intensity dependence of the momentum distributions of electrons and ions. Based on the final momenta of two electrons, we have identified two distinct categories of electron trajectories, Z and NZ. We found that the shapes of the ion momentum distributions of the Z and NZ trajectories are very different, in which the Z and NZ trajectories produce single-peak and double-peak structures respectively. Furthermore, the height and width of their distributions depend on the laser intensity. Thus, these two types of trajectories act as a basis to give different shapes of the ion momentum distributions at different laser intensities. Our calculated results showed that the Z trajectories are more favorable at low laser intensities, whereas the NZ trajectories are more favorable at high laser intensities. This Z NZ shift has been demonstrated in the helium and argon experiments.
Currently, the available experimental ion momentum distributions of neon show a double-peak structure, and its width decreases with decreasing laser intensity within the NSDI regime (see moshammer_Ne ; Ullrich-jpb04 ; Ullrich-04 ). Since this shape and its variation are consistent with the behavior of the NZ distribution, we suggest that these neon data are in the intensity regime that favors the production of NZ trajectories Neon-note . By lowering the laser intensity further, our analysis suggests that experiment on neon could observe a sngle-peak momentum distribution that has dominant Z ions.
V Acknowledgement
This work was supported by NSF grant PHY-0072359. The author wants to thank J. H. Eberly for his suggestions and careful reading of the manuscript. Also, the author acknowledges the on-going collaboration with S. L. Haan at Calvin College.
References
- (1) Phay J. Ho, R. Panfili, S. L. Haan and J. H. Eberly, Phys. Rev. Lett. 94, 093002 (2005).
- (2) D. N. Fittinghoff, P. R. Bolton, B. Chang and K. C. Kulander, Phys. Rev. Lett. 69, 2642 (1992).
- (3) B. Walker et al., Phys. Rev. Lett. 73, 1227 (1994).
- (4) S. Augst et al., Phys. Rev. A52, R917 (1995); A. Talebpour et al., J. Phys. B 30, 1721 (1997); S. Larochelle, A. Talebpour and S. L. Chin, J. Phys. B 31, 1201 (1998).
- (5) C. Guo, and G. N. Gibson, Phys. Rev. A63, 040701(R) (2001); M. J. DeWitt, E. Wells, and R. R. Jones, Phys. Rev. Lett. 87, 153001 (2001); E. Wells, M. J. DeWitt, and R. R. Jones, Phys. Rev. Lett. 66, 013409 (2002).
- (6) See A. M. Perelomov, V. S. Popov, and M . V. Terentev, Sov. Phys. JETP 23, 924 (1966), and M. V. Ammosov, N. B. Delone and V. P. Kraĭnov, Sov. Phys. JETP 64, 1191 (1986).
- (7) Th. Weber et al., Phys. Rev. Lett. 84, 443 (2000).
- (8) R. Moshammer et al., Phys. Rev. Lett. 84, 447 (2000).
- (9) Th. Weber et al., J. Phys. B 33, L127 (2000).
- (10) B. Feuerstein et al., Phys. Rev. Lett. 87, 043003 (2001).
- (11) E. Eremina et al., J. Phys. B 36, 3269 (2003).
- (12) V. L. B. de Jesus et al., J. Phys. B 37, L161 (2004).
- (13) V. L. B. de Jesus et al., J. Electron Spectrosc. and Related Phenom. 141, 127 (2004).
- (14) P. B. Corkum, Phys. Rev. Lett. 71, 1994 (1993).
- (15) J. S. Parker et al., J. Phys. B 36, L393 (2003).
- (16) A. Becker and F. H. M. Faisal, Phys. Rev. A59, R1742 (1999); A. Becker and F. H. M. Faisal, Phys. Rev. Lett. 84, 3546 (2000); R. Kopold et al., Phys. Rev. Lett. 85 3781 (2000); S.P. Goreslavskii, S.V. Popruzhenko, R. Kopold, and W. Becker, Phys. Rev. A 64, 053402 (2001).
- (17) T. Brabec, M. Yu. Ivanov and P. B. Corkum, Phys. Rev. A 54, R2551 (1996).
- (18) G. L. Yudin and M. Yu. Ivanov, Phys. Rev. A 63, 033404 (2001).
- (19) L.-B. Fu, J. Liu and S.-G. Chen, Phys. Rev. A 65, 021406(R) (2002).
- (20) P. J. Ho and J. H. Eberly, Opt. Express 11, 2826 (2003).
- (21) R. Panfili, J. H. Eberly and S. L. Haan, Opt. Express 8, 431 (2001).
- (22) See J. Javanainen, J. H. Eberly and Q. Su, Phys. Rev. A38, 3430 (1987), and Q. Su and J. H. Eberly, Phys. Rev. A44, 5997 (1991).
- (23) R. Panfili, S. L. Haan, and J. H. Eberly, Phys. Rev. Lett. 89, 113001 (2002).
- (24) S. L. Haan, P. S. Wheeler, R. Panfili and J. H. Eberly, Phys. Rev. A 66, 061402(R) (2002).
- (25) M. Lein, E. K. U. Gross and V. Engel, Phys. Rev. Lett. 85, 4707 (2000).
- (26) E. Eremina et al. in eremina have provided the ion momentum distributions of neon at , and no experimental neon distribution is available below this intensity.