Characteristics of the Korean stock market correlations
Abstract
We establish in this study a network structure of the Korean stock market, one of the emerging markets, with its minimum spanning tree through the correlation matrix. Based on this analysis, it is found that the Korean stock market does not form the clusters of the business sectors or of the industry categories. When the MSCI (Morgan Stanley Capital International Inc.) index is exploited, we find that the clusters of the Korean stock market is formed. This finding implicates that the Korean market, in this context, is characteristically different from the mature markets.
keywords:
Correlation-based clustering , Emerging market , Minimum spanning tree, EconophysicsPACS:
89.65.Gh , 89.75.Fb , 89.75.Hc1 Introduction
The stock price of a given company is a mutual inference of various information, such as company revenue, competition performance, currency policy, business barometers, political situation, and so on. In other words, when the price is estimated, there are numerous complicated factors that must be considered. In the stock market, all companies are interconnected and consequently their stock prices are correlated. This correlation, known as the potential of deep inner impact, forms the stock market network.
Network theory has been extended into a wide range of subjects[1, 2, 3, 4]. Barabási and Albert (BA) introduced the scale-free network which is constructed by the growth rule and the preferential attachment rule[5]. We consider the preferential attachment rule as the connectivity of an influential company in stock market - a more influential company has more connections with other companies. The interaction strengths between nodes are important in many network systems. Non-binary scale-free network[6] which takes a continuous weight between 0 and 1 is a proper choice for modeling a stock market. We regard companies as nodes (vertices) of the network, interacting relations between stocks as links (edges) and correlation coefficients as weights.
The minimum spanning tree (MST) is widely used to study the stock market since Mantegna first constructed the network based on the correlations[7]. The minimum spanning tree is generated by selecting the most important links. We construct a correlation matrix of N stocks. This matrix is symmetric and diagonal with . The MST is determined by the distance matrix where . There have been several attempts to identify the cluster structure[8, 9, 10]. The MST is very useful to observe the network topology and identify clusters of the market including the stock and Foreign Exchange (FX) market[11, 12]. Bonanno et al. introduced the topological properties of the MSTs through the real and model markets’ dataset[13]. Onnela et al. investigated the dynamical properties of the American market correlations and taxonomy analysis in detail. The S&P500 forms clusters with the business sectors and the portfolio optimization with these clusters is successful. The MST also can be applied to the portfolio analysis in practice[14].
While there has been an abundance of literature concerning mature markets - especially, the US market - relatively little work has been published for emerging markets such as those of Korea, BRICs and Eastern Europe. Emerging markets often lack liquidity and reliable data, so they are generally unstable. These factors make the study of emerging markets more complex. Even the universal features for mature markets cannot be extended to emerging markets for every cases[15]. It seems that the model appropriate to emerging market should be exploited.
In this paper, we aim to explore the topological characteristics of the Korean market as a representative emerging market. We construct the non-binary network by following the method introduced and applied for S&P500 companies by Kim et al[16]. We study the taxonomy and network topology of the Korean market with it.
2 Properties of the Korean Stock Market
The Korean stock market is much smaller than the US stock market. There are two stock markets in Korea - the Korea Stock Exchange (KSE) and the KOSDAQ. There are 700 and 900 listed companies and total capitalizations are $400 billion and $30 billion, respectively. For NYSE and NASDAQ, there are thousands of listed companies and the total market capitalization is approximately $11 trillion. Rough estimation shows the US companies’ average market capitalization is ten times greater than that of Korea, which is about $2 million.
There are two predominant types of stock price indices; a price-equally-weighted index is an arithmetic average and a value-weighted index is an value weighted average of current stock prices. The former such as DJIA assumes that every stock has the same influencing power, while the latter such as S&P500 assumes that each stocks have the power proportional to their market capitalization. KOSPI200 is a value-weighted index of 200 representative stocks in KSE, that is appropriate for the purpose of this study.
Table 1 shows the market capitalization of some largest companies listed on the S&P500 and KOSPI200. This quantity reflects the financial scale of a given company and the fraction of total market capitalization in a stock market. () denotes stock symbol. The main distinction between two markets is the influence of several top companies. The portion of top 10 KOSPI200 companies is 49.13% where that of S&P500 is 22.82%. It means that KOSPI200 index is more sensitive to the influence of a few top companies.
Table 2 shows shareholding composition of KSE by investor group. We can notice that foreign investors possess the bulk of stocks of large companies and a large part of market liquidity is supplied by them. Thus, the foreign investors’ trading activities are crucial to the KSE. So naturally the Korean stock market is highly correlated with the foreign stock markets such as the US market.
3 Methodology
We construct a network of KOSPI 200 companies; each node (company) has a different number of links (connections) and weights (correlations). We use the cross-correlations in stock price changes between KOSPI200 companies from Jan/2001 to Jun/2004. The dataset is daily closure prices in terms of Korean Won (KRW), the Korean local currency. In 1997, the Asian financial crisis made the exchange rate to fluctuate violently. However, during the period analyzed the Korean FX market doesn’t have an experience of external impact or violent fluctuation. Let be the stock price of company . Then, the log-return of the stock price is defined as
| (1) |
where t is time interval. In this paper, we analyzed daily data; t=1day. The cross-correlations between stock i and j can be written as
| (2) |
where means a time average over the period. These correlation coefficients form a correlation matrix . This matrix is a symmetric NN matrix. If stock i and j are completely correlated (anti-correlated), . The case of means they are uncorrelated.
Each node of the network corresponds to a company, which is fully connected to every another nodes. Each link has a weight , simply as the same value with the cross-correlation coefficient; .
The influence strength (IS) is a physical quantity to measure how strongly a node influences other nodes. This quantity is defined as the sum of the weights of all links incident upon a given node ,
| (3) |
where denotes the links connected to the node . Since the weight is distributed in the range [-1,1], the IS can be negative. Here we just need to determine the influencing structure, and the sign of is not important. Thus we only deal with the absolute magnitude of the IS denoted by .
4 Characteristics of the Korean Stock Market
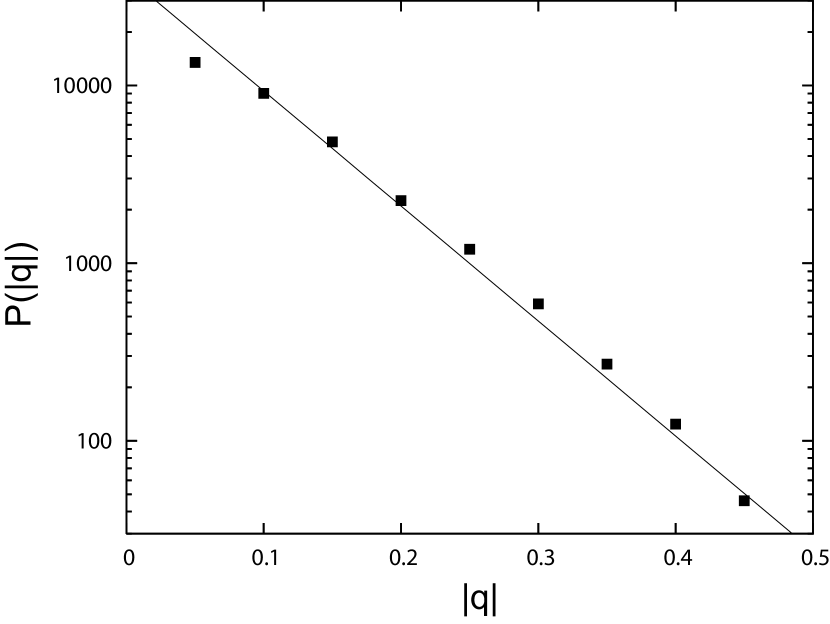
In Fig. 1, we plot the IS distribution of KOSPI200. Kim et al.[16] found the IS distribution of S&P500 follows a power law distribution, where the exponent is estimated to be . It is known that as the degree exponent is smaller in SF networks, the connectivity of a node with a large degree becomes higher, and hence the network tends to be more centralized to a few nodes. In other words, several powerful companies make a dominant effect to the whole market. It is also noticeable that the IS component of the S&P500 is smaller than the degree exponent values for SF networks in the real world such as the Internet and the World-Wide Web[1, 2].
By Table 1, the largest company from the viewpoint of a market capitalization in the S&P500 is General Electric (GE); its fraction is 3.39%. In the case of the KOSPI200, Samsung Electronics Corporations (SEC) occupies this position; its fraction is 21.94%. So we can consider the KOSPI200’s hub to be more powerful, and the KSE network is more centralized to this company than the S&P500. However, Fig. 1 shows that the KOSPI200’s IS distribution does not follow a power law distribution, but an exponential distribution. The Korean stock market is less centralized than the S&P500 or other scale-free networks in the real world.
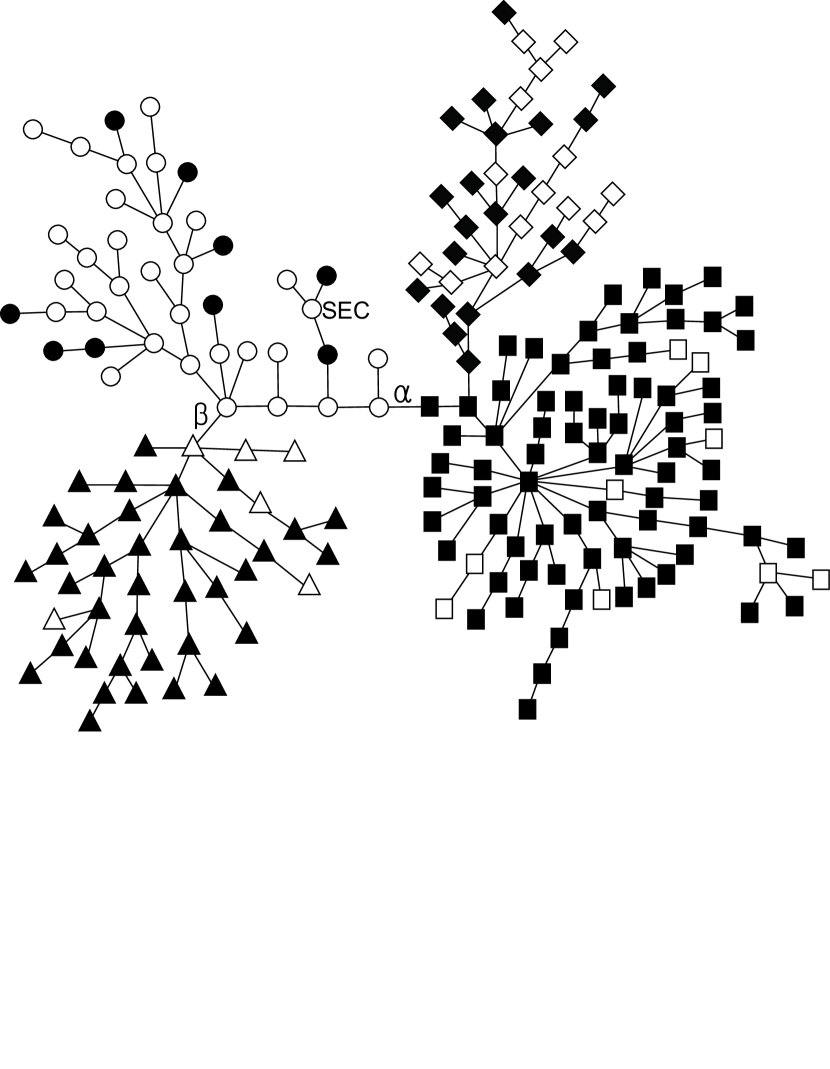
We construct the asset tree through the minimum spanning tree (MST) to find the difference between the S&P500 and KOSPI200. GE acts as the hub of the S&P500’s MST[7, 14]. However, we cannot find any comparable hub in the whole market of the KOSPI200 contrary to the dominant position of SEC in KSE. SEC node is located far away from the center (Fig. 2). This means the fraction of SEC’s market capitalization is large, and as such the KOSPI Index moves with SEC while most companies’ stocks do not follow this trend. Neither SEC nor the others in Table 1 is located at the center of KOSPI’s MST. The weak influence of SEC shows weak correlations with other stocks. Hence, we cannot find such scale-free behaviors in the Korean market as the American market.
One possible explanation of this difference is the market maturity. The American stock market is a mature market. There are numerous powerful companies such as GE, Microsoft and Citigroup. These companies have similar market capitalization and influence power on the market. In the Korean stock market, an emerging market, there is a great gap between the SEC and the others - even though, 9 companies of Table 1 - with a viewpoint of the market capitalization.
For the application of portfolio optimization, the identification of groups of stocks in common dynamics is necessary to diversify the risks. At first, we introduce some terminology. The term branch is defined as a subset of a tree, to all nodes that share a specified common parent and cluster as a subset of a branch. There are two kinds of clusters. One is a complete cluster and the other is incomplete. A complete cluster contains all the companies of the studied set belonging to the corresponding branch, so that none are left outside the cluster. Onnela et al.[14] found that clusters of S&P500 with business sector or industry categories are mostly incomplete, but come very close to being complete clusters, only missing one or two companies of the cluster. We consider this situation as a complete cluster from the viewpoint of practical portfolio optimization. However, the clusters of KOSPI200 do not coincide with business sectors or industry categories. In addition, they made the portfolio using the central node (GE), but the KOSPI200 has no single central hub, and thus this method cannot be applied to the Korean situation.
We attempted to identify groups of KOSPI200 with other rules than business sectors or industry category. Most major Korean companies are members of conglomerate forms of enterprise, commonly known as Chaebeol. For example, Samsung Electronics Co. is a member of Samsung Conglomerate. This conglomerate is comprised of many companies over different sectors, i.e., Samsung Electronics Co., Samsung Life Insurance, Samsung Heavy Industries Co., Samsung Petrochemical Co., Samsung Corporation, and so on. Their ownerships are controlled by complex shareholding structures. So their stocks can be considered a group. However, we cannot find any group structure related with Korean major conglomerates - Samsung, LG, SK, Hyundai, and so on.
We also consider the influence of foreign investors on the trading patterns of domestic investors. Foreign investors are generally believed to employ superior techniques and information and their strategies are considered as benchmarks by domestic counter parties in the Korean stock market. So we apply the MSCI index to make groups of Korean stocks. Morgan Stanley Capital International Inc. (MSCI) is one of the leading providers of equity indices and offers the most widely used international equity benchmarks by international investors. MSCI Equity Indices are designed to fulfill the investment needs of a wide variety of global institutional market participants. These include many categories of indices, i.e. Sector, Industry Group and Industry Indices, Global, Regional and Country Equity indices, and so on. We focus on the MSCI Korea Index - one of the MSCI Country Equity Indices.
Fig. 3 supports the validity of MSCI index grouping. We can identify two types of clusters by mainly composed of stocks included in MSCI index or not. While all of them are incomplete clusters, they can be considered as complete clusters in practice. It seems that MSCI index grouping is the most acceptable method for the Korean market. In fig 3, the weight of link is the second lowest and that of is the fifth lowest one. So we can divide the whole market into three clusters separated by these two links, and each cluster forms a sub-market. Another noticeable feature of this MST is the absence of a global hub. The node in the center of cluster seems to be a hub, but it is just a local hub for isolated sub-market. We can also see that highly capitalized stock like SEC is far from a hub even for a sub-market .
Bonanno et al.[13] constructed the MST using market models; random market model and one-factor model. Random market model assumes that the return distribution is uncorrelated Gaussian and one-factor model assumes that the return is controlled by a single factor like index. The degree distribution for the MST of mature market follows a power law distribution, and the degree distribution of the one-factor model is decayed rapidly and contains an asset with a very high value of the degree. Fig. 1 shows that the degree distribution of the KOSPI200 follows neither a power law distribution nor a distribution of the one-factor model. It seems close to a distribution of the random market model.
5 Conclusions
We have studied the Korean stock market and obtained some characteristics that differ from the characteristics of the US market. The pertinent question is, why does the Korean stock market have different properties? One possible reason is the composition of firms. The history of mature markets is longer than that of emerging markets. Thus, the mature markets have many companies including several large firms. In the case of the Korean market, there are only a few large firms, e.g. SEC; these corporations are very large in comparison with others. As such, these large firms are separated from other companies of the market. This accounts for why there are no hubs in the Korean stock market. We don’t know yet whether this is the characteristics of an emerging market or only Korean characteristics. The other is the trading culture and globalization. Foreigners’ trading patterns are much important in the Korean market. Globalization has progressed very rapidly and influence of a few developed countries has become more and more powerful. At present, many stock markets’ synchronization to the US market is observed. In other words, the whole markets in the world are synchronized. We may thus find clusters in terms of the MSCI index. If a specified company’s stock is included in the MSCI index, it is more synchronized to a foreign market and regarded as a good company’s stock to the Korean market. All markets throughout the world have characteristics of their own. We need to study each market with its own properties.
The 1997 Asian financial crisis was a very important event to the Korean market. After the crisis, the market’s response to the external market is more sensitive[17]. The correlation coefficient of the Korean market is smaller than that of the American market and sometimes shows unusual distribution. The correlation and the MST have more information about the market than this paper’s analysis, i.e. average length, positive correlation and negative correlation. The investigation about the points mentioned with the knowledge on the history of the Korean market is our future work.
We wish to thank S.-W. Son, O. Kwon and C. Kim for helpful discussions and supports.
References
- [1] M. Faloutsos, P. Faloutsos and C. Faloutsos, Comput. Commun. Rev. 29 (1999) 251.
- [2] R. Albert, H. Jeong and A.-L. Barabási, Nature 401 (1999) 130.
- [3] H. Jeong, B. Tomber, R. Albert, Z. N. Oltvai and A.-L. Barabási, Nature 407 (2000) 651.
- [4] J. Jung, J. Lee and H.-T. Moon, Proteins 58 (2005) 389.
- [5] A.-L. Barabási, R. Albert and H. Jeong, Physica A 272 (1999) 173.
- [6] S. H. Yook, H. Jeong, A.-L. Barabási and Y. Tu, Phys. Rev. Lett. 86 (2001) 5835.
- [7] R. N. Mantegna, Eur. Phys. J. B 11 (1999) 193.
- [8] L. Laloux, P. Cizeau, J.-P. Bouchaud and M. Potters, Phys. Rev. Lett. 83 (1999) 1467.
- [9] V. Plerou, P. Gopikrishnan, B. Rosenow, L. A. N. Amaral and H. E. Stanley, Phys. Rev. Lett. 83 (1999) 1471.
- [10] L. Kullmann, J. Kertész and R. N. Mantegna, Physica A 287 (2000) 412.
- [11] S. Miccichè, G. Bonanno, F. Lillo and R. N. Mantegna, Physica A 324 (2003) 66.
- [12] M. McDonald, O. Suleman, S. Williams, S. Howison and N. F. Johnson, e-print arXiv:cond-mat/0412411.
- [13] G. Bonanno, G. Caldarelli, F. Lillo and R. N. Mantegna, Phys. Rev. E 68 (2003) 046130.
- [14] J.-P. Onnela, A. Chakraborti, K. Kaski, J. Kertész, and A. Kanto, Phys. Rev. E 68 (2003) 056110.
- [15] K. Matia, M. Pal, H. Salunkay and H. E. Stanley, Europhys. Lett. 66 (2004) 909.
- [16] H.-J. Kim, Y. Lee, B. Kahng and I. Kim, J. Phys. Soc. Jpn. 71 (2002) 2133.
- [17] F. Climent and V. Meneu, Int. Rev. Econ. Financ. 12 (2003) 111.
| Rank | S&P 500 | KOSPI 200 | ||
|---|---|---|---|---|
| Company(Symbol) | % | Company(Symbol) | % | |
| 1 | General Electric (GE) | 3.39 | Samsung Electronics (005930) | 21.94 |
| 2 | Exxon Mobil (XOM) | 2.96 | SK Telecom (017670) | 4.48 |
| 3 | Microsoft (MSFT) | 2.91 | POSCO (005490) | 3.80 |
| 4 | Pfizer INC. (PFE) | 2.39 | Kookmin Bank (060000) | 3.46 |
| 5 | CitiGroup (C) | 2.36 | KEPCO (015760) | 3.41 |
| 6 | Wal-Mart (WMT) | 2.19 | Hyundai Motors (005380) | 3.21 |
| 7 | Amer.Intl.Group (AIG) | 1.82 | KT (030200) | 3.15 |
| 8 | Bank of America (BAC) | 1.73 | LG Electronics (066570) | 2.35 |
| 9 | Johnson&Johnson (JNJ) | 1.66 | SK Corp. (003600) | 1.68 |
| 10 | P&G (PG) | 1.41 | Woori Finance (053000) | 1.65 |
| Individual | Foreigners | Institution and Others | |
|---|---|---|---|
| # of shareholder(A) | 99.33% | 0.39% | 0.22% |
| # of shares(B) | 48.50% | 13.99% | 37.51% |
| Market capitalization(C) | 23.44% | 37.67% | 38.89% |
| B/A | 0.488 | 35.8 | 170.5 |
| C/A | 0.236 | 96.6 | 176.8 |
| C/B | 0.483 | 2.70 | 1.04 |