Statistical modelling of tropical cyclone tracks: a semi-parametric model for the mean trajectory
Abstract
We present a statistical model for the unconditional mean tracks of hurricanes. Our model is a semi-parametric scheme that averages together observed hurricane displacements. It has a single parameter that defines the averaging length scale, and we derive the optimum value for this parameter using a jackknife. The main purpose of this model is as a starting point for developing a statistical model of hurricanes for use in the estimation of the wind, rainfall and flooding risks. The model also acts as an optimal filtering tool for estimating mean hurricane tracks.
1 Introduction
We are interested in the question of how to estimate the wind, rainfall and flooding risks caused by tropical cyclones. Various methods to evaluate these risks have been developed over the last 20 years in industry and academia. The insurance industry, for instance, uses such methods to inform the process of setting insurance rates. Some of the models used in industry have been published, either in full or in part (see, for example, Drayton (2000) and Clark (1986)). The models developed by academics include those of Darling (1991), Chu and Wang (1998), Vickery et al. (2000) and Emanuel et al. (2005). The papers of Vickery et al. (2000) and Emanuel et al. (2005) contain a number of references to other studies in this subject area.
The papers cited above use a range of methods for modelling tropical cyclone risks. At present it seems that there has been no systematic attempt to compare these different methods, and there is little consensus as to which of the methods are the best. Our long-term goal is to try and bring some more rigourous analysis to bear on this question. However, our immediate goal is to start to develop a hierarchy of models that simulate hurricane tracks. The models in this hierarchy will be similar, at a general level, to the models described by Drayton (2000), Vickery et al. (2000) and Emanuel et al. (2005).
One of our specific aims is to build models using statistical best-practice. There are various aspects to this. For instance, we intend to test the models we develop using cross-validation (often known in meteorology as ‘out-of-sample testing’). This restricts us to developing models that can be fitted to the observed data automatically and efficiently (in a matter of minutes or hours), since only such models can be tested in this way. Also, we intend to follow a systematic modelling philosophy whereby we start with a simple model and add complexity only to the extent that it can be proven to improve the cross-validated results. The model that we describe in this article is therefore rather simple, as is appropriate for the first model in our hierarchy, but it sets the stage for the development of more complex models that can easily be tested and compared. By developing such a hierarchy we hope that we will gradually converge on an accurate model that makes good use of the available data but avoids overfitting. And maybe we will learn something about tropical cyclones on the way, too.
2 Data
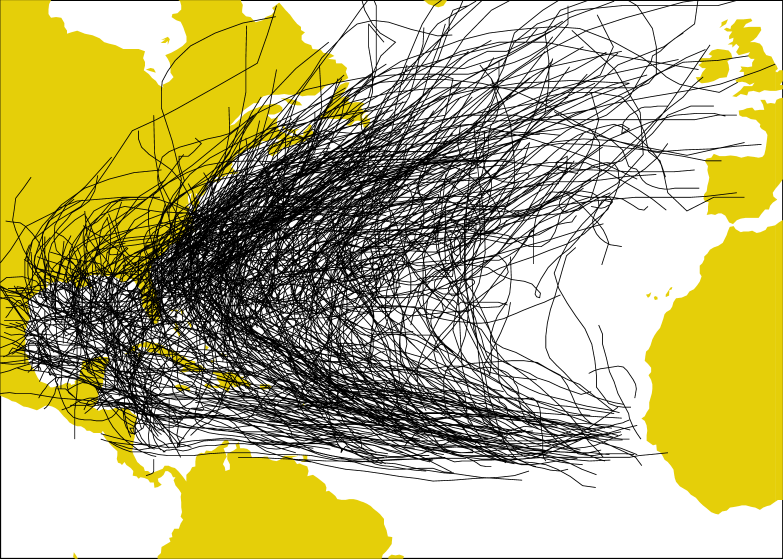
We use the HURDAT re-analysis ‘best track’ data set of North Atlantic tropical cyclones maintained by the NOAA s Hurricane Research Division222www.aoml.noaa.gov/hrd/hurdat. HURDAT contains 6-hourly data of position of storm centers, as well as wind speed and sea-surface pressure, for tropical cyclones from 1851 through 2003. We restrict attention to dates after 1950, when Doppler radar data started being used to make reliable wind-speed estimates, and we remove a small fraction of storms that have suspect features. This leaves 524 storms, the data on which we construct and evaluate our model. The tracks of these storms are shown in figure 1.
3 The model
There are various statistical techniques available that one could use to build a model of hurricane tracks. For instance, one could consider parametric methods, non-parametric methods or semi-parametric methods. For our purposes we will define these terms as follows: in a parametric method, various parameters are estimated from observational data. Simulations of hurricane tracks can then be generated using these parameters without further recourse to the data. In a non-parametric method, on the other hand, simulations of hurricane tracks are generated directly from the observational data without any parameters being estimated. Finally in a semi-parametric method various parameters are estimated from the observational data, but simulations are based on both the parameters and the observational data. We do not have any particularly strong views as to which of these classes of techniques are generally more appropriate for statistical modelling: for each particular problem that one tackles one should aim to derive models which combine simplicity with accuracy, and depending on the nature of the problem such models may come from any of these three classes. In this particular case the model we use for the starting point for our hierarchy is semi-parametric, which seems to offer a very simple but nevertheless reasonable approach.
The two basic principles on which our model is based are that (a) the main source of information we have about hurricane motion is the observed motion of hurricanes in the historical record, and (b) hurricanes in a similar part of the Atlantic tend to move in a similar way. The second assumption is validated in our analysis. We consider the motion of a hurricane over a 6 hour interval to consist of a component along a line of longitude and a component along a line of latitude. The size of each component is modelled as a sample from a normal distribution, and the joint distribution of the two components is taken as a bivariate normal distribution. We do not argue that the bivariate normal distribution is the right distribution to model these displacements (i.e. we are not arguing that the real displacements are sampled from a bivariate normal distribution), but it certainly seems like a very reasonable choice for the first model in our hierarchy. At a later stage we intend to test whether one can improve the results by attempting to model various aspects of non-normality such as non-normal marginals or a non-Gaussian copula. To complete the description of the model we simply need to specify the mean, variance and correlation of the bivariate normal distribution. In this article we will focus on modelling the unconditional mean displacement, which we define as the expected displacement if we have no information about previous motion of the hurricane, and know only its current location. In subsequent studies we will consider models for the conditional mean (conditioned on the track so far, and other factors) and the variance.
We will take the mean 6 hourly displacement of a hurricane currently at the longitude-latitude point to be the weighted average of the 6 hourly displacements of all hurricanes that have passed near the point in history. In fact, we take the weighted average of the motion of all hurricanes, not only those that have passed near the point , but the weights will be negligible for hurricane tracks that are far away. Our weighting model is based on a Gaussian, with a length scale as a free parameter. We determine the optimal length scale using a jackknife: we fit the model on years of data and test it on the remaining year, and then repeat times for the different possible choices of remaining year.
We can write our model for the unconditional mean displacement as:
| (1) |
where
| (2) |
where represent distance measured zonally, and are the zonal positions of a hurricane at a 6 hourly interval, is a 6-hour displacement of a historical hurricane, is distance from to the location of the historical displacement, is a free parameter and the sums run over all historical 6-hour displacements for the 524 hurricanes in our data set. We use analogous expressions for displacements in the meridional direction.
What cost function should we use to fit the length-scale parameter ? Since we are ultimately interested in evaluating risks such as the risk of extreme winds in particular locations, then one could argue that we should incorporate that directly into the cost function (e.g. the cost function could measure the extent to which we simulate the observed pattern of extreme winds at selected locations during the last 50 years). However, such a ‘macroscopic’ cost function is rather hard to calculate, given that we are building up our model ‘microscopically’ from the motion of each hurricane track. And it may be flawed in that it may not give unique solutions for the tracks, or it may be impractical to calculate in terms of CPU time, and thus prohibit proper model testing. However, this argument is moot anyway since the current model doesn’t give predictions of wind risk at all. So at this point we will use a ‘microscopic’ cost function: the RMSE of 6 hour forecast errors measured in km, where the mean in the RMSE is taken over all observed 6 hourly displacements for each hurricane in the remaining year, and over all years. It is not entirely clear whether optimising using this microscopic cost function will be ultimately sufficient for giving good predictions of macroscopic quantities (although it seems likely that it might be), and we may have to revisit the question of which cost function to use later once the model is more complete.
Relative to the model of Emanuel et al. (2005) (ERVR) we note that:
-
•
We have assumed bivariate normality for the distribution of 6 hourly track displacements, while ERVR avoid making any strong distributional assumptions
-
•
We have avoided binning in space, while ERVR estimate transition probabilities on a grid
-
•
We have avoided binning in speed or direction, while ERVR discretize the distribution of possible speeds and directions
Relative to the model of Vickery et al. (2000) (VST) we note that:
-
•
Our model is semi-parametric (with one parameter), rather than parametric (with many parameters)
-
•
We have assumed bivariate normality for the distribution of 6 hourly track displacements, while VST have assumed normally distributed errors on speed and direction
-
•
We have avoided binning in space, while VST estimate parameters in 5ox5o boxes.
We have designed our model as described above because we think this is a sensible, simple and promising way to build such a model. However, we do not argue that our model is ultimately better than these other models. That is not for us to decide, but would be a question for statistical testing. For instance, either of the above models could be used to make a cross-validation estimate of our RMSE-based cost function.
4 Results
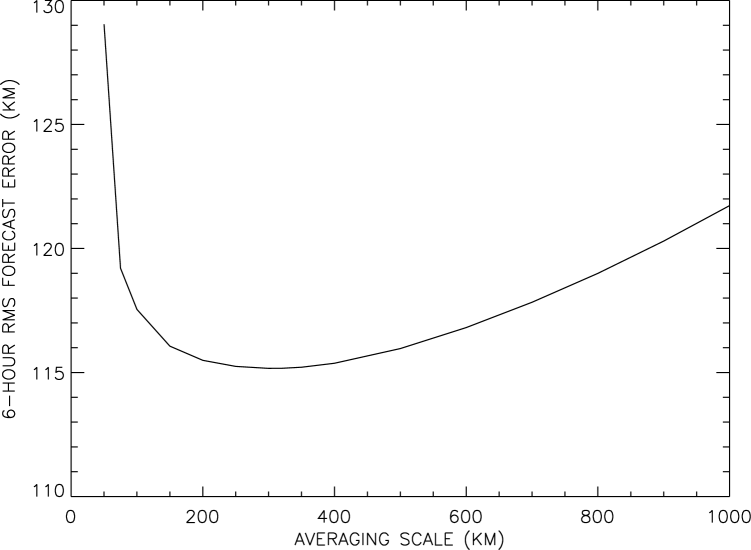
We can test our model for any value of the length-scale , and can calculate the value for the cost function in each case. The results of this exercise are shown in figure 2. We see that for very short length-scales the model does badly (gives large forecast errors) presumably because not enough data is being used to be able to estimate the likely hurricane displacements in an accurate way. Another way to say the same thing would be that the results are too affected by sampling error due to the effects of individual synoptic systems on the tracks of individual hurricanes. For very long length-scales the model also does not perform particularly well, presumably because the information being used includes information from far away, in regions where hurricanes move differently due to different climatological conditions.
The optimum value for the length-scale is around 300km, although the minimum is rather broad, especially on the higher length-scale side. This broad minimum seems to imply that we have more than enough data to determine the unconditional mean hurricane motion fairly accurately. This is presumably because there is a high density of data relative to the scales inherent in the shapes of the mean hurricane tracks, and so the variations in the shape of the mean hurricane tracks are well sampled. This is encouraging, and makes us think that our model is well fitted. It also suggests that there may be enough data to try and condition the shapes of the tracks on various covariates such as time of year, state of ENSO, state of NAO, intensity of the hurricane, etc. We will look at this in a future study. The risk of such conditioning is, of course, that one might overfit the model, and one would need to use appropriate tests to avoid that. By contrast, had the data been sparse, then the inclusion or exclusion of individual tracks by changes in the averaging length-scale would strongly affect the mean track and forecast error, leading to more structure in the forecast error function.
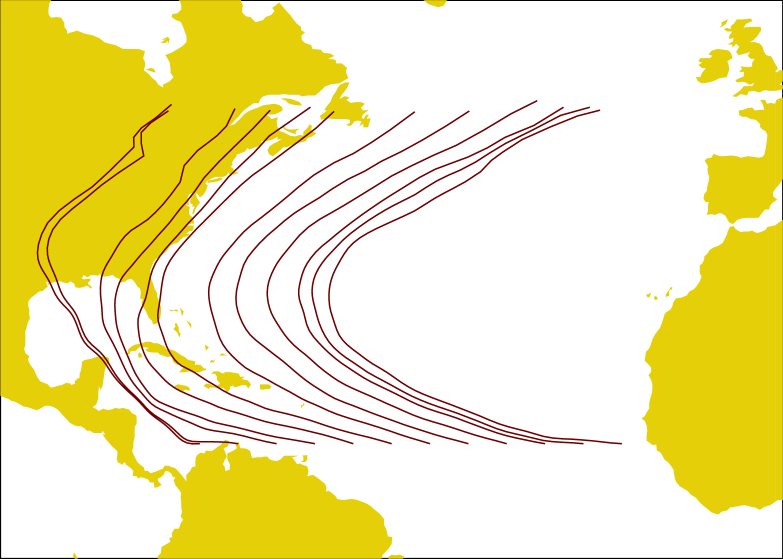
Having derived the optimum length scale we can calculate the mean hurricane track displacements at any point in the basin, and can integrate along these displacements to form ‘mean hurricane tracks’. The results of this are shown in figure 3. We have integrated these tracks from a line of points at 10oN, spaced at intervals of 10o. Because we are only modelling the unconditional mean motion of hurricanes, and not the variance, our tracks are entirely deterministic and don’t cross each other.
Figure 3 shows the characteristic curving of hurricane tracks, and little else. This characteristic shape can be explained as due to the local Hadley circulation, consisting of low pressure near the equator and high pressure near the tropic of capricorn. The mid and lower level tropospheric winds in this circulation are responsible for steering hurricanes, and the average circulation of these winds creates the curving shape of the mean hurricane tracks.
What if we were to use a length scale that is much shorter than the optimum? Results from using a length-scale of only 100km are shown in figure 4. We see that the modelled mean tracks are less smooth, presumably because they are now too closely constrained to individual historical storm tracks.
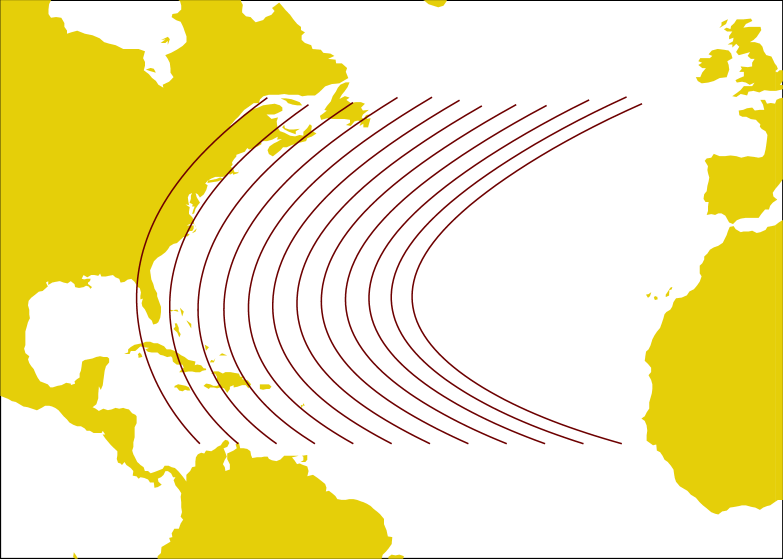
What if we were to use a length scale that is much longer than the optimum? Results from using a length-scale of 1000km are shown in figure 5. We see that the characteristic curving shape of hurricane tracks is rather smoothed out.
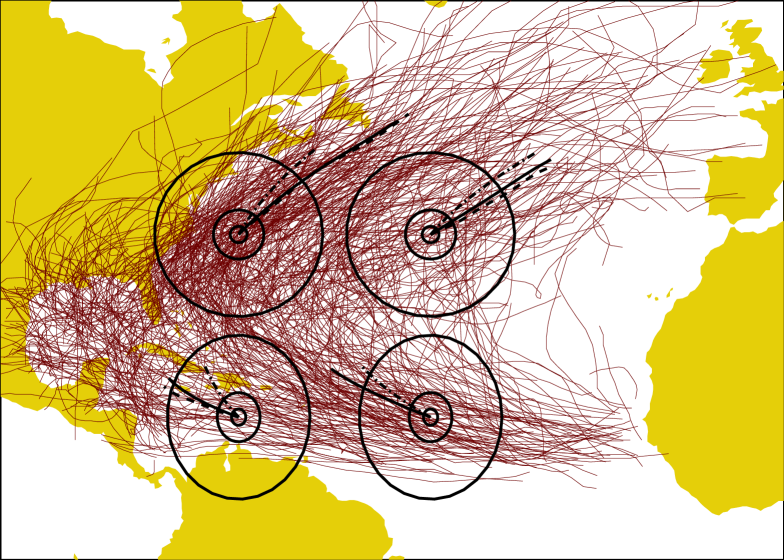
Figure 6 shows historical hurricane tracks (exactly as in figure 1) but with circles of radii 100km, 300km and 1000km at four points in the North Atlantic, to illustrate the size of the regions over which hurricane tracks are being averaged in the model. It also shows unconditional mean tracks derived using these three length-scales at each of these points (dashed lines for the 100km length-scale, solid lines for 300km and dot-dashed lines for 1000km). It seems to be possible to understand the differences between the mean tracks from the three different length-scales in some of the cases shown in figure 6. For instance, for the most southerly and westerly of the four points, the mean track derived from the 1000km length-scale lies to the right of the mean track derived from the shorter length-scales. This is perhaps because averaging using the 1000km length-scale includes tracks from north of Hispaniola that are curving northward more quickly than those from south of Hispaniola.
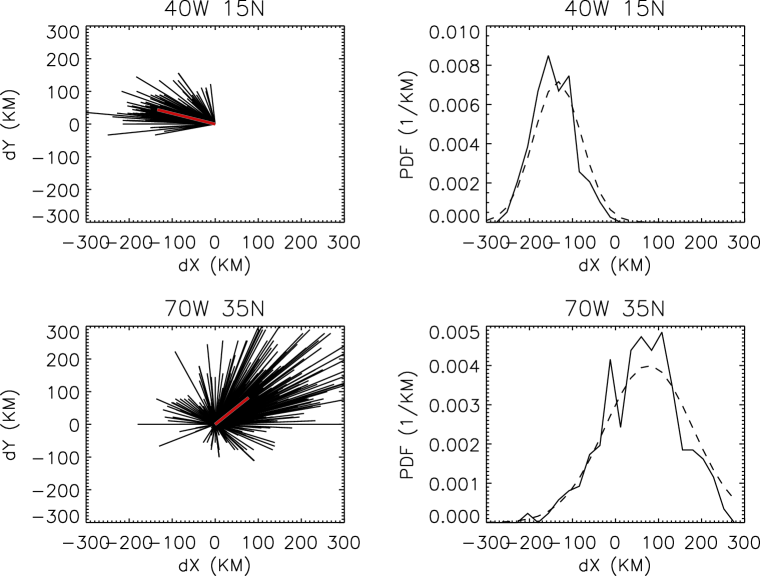
Finally, in figure 7, we show some diagnostics which give further insight into how the track model is working. The left hand panels show the displacement vectors from the historical record that lie within 300km of two selected locations in the North Atlantic. The red vector shows the vector generated by averaging the zonal and meridional components of these vectors separately (this averaging is not quite the same as the averaging process used in the model described above, but is very similar). The right hand panels show the distribution of zonal displacements for these vectors (solid line) along with a fitted normal distribution (dashed line). In these two cases we see that a normal distribution is not a bad model. In other locations the normal doesn’t perform as well, and testing more complex distributional models is a priority for further investigation.
5 Discussion
We have described the results of our first steps towards building a statistical model of hurricane tracks. At this point we have only considered how to model unconditional mean hurricane tracks, and we have not considered fluctuations around these mean tracks that would be caused by the synoptic situation of the day. We have shown how these mean tracks can be derived very simply using a simple semi-parametric model with just a single parameter. We calculate the optimal value for this parameter using a jackknife fitting procedure.
The method we use to derive the mean tracks seems to be a reasonably good scheme for summarising the mean behaviour of hurricane tracks, and we plan to apply it to various subsets of the full track set in order to investigate the effects of various conditioning factors such as time of year, intensity of the storm, state of ENSO and state of the NAO.
It may be possible to improve on our simple model for the unconditional mean tracks, perhaps by conditioning on time of year or intensity, or maybe by changing the precise form of the weighting function (i.e. by using , a top-hat, or similar). We plan to test this.
The next stage in the development of our model hierarchy will be modelling the fluctuations around the mean tracks. We also plan to apply our model to tropical storm tracks in other basins, and to extratropical storm tracks.
6 Legal statement
SJ was employed by RMS at the time that this article was written.
However, neither the research behind this article nor the writing of this article were in the course of his employment, (where ’in the course of their employment’ is within the meaning of the Copyright, Designs and Patents Act 1988, Section 11), nor were they in the course of his normal duties, or in the course of duties falling outside his normal duties but specifically assigned to him (where ’in the course of his normal duties’ and ’in the course of duties falling outside his normal duties’ are within the meanings of the Patents Act 1977, Section 39). Furthermore the article does not contain any proprietary information or trade secrets of RMS. As a result, the authors are the owners of all the intellectual property rights (including, but not limited to, copyright, moral rights, design rights and rights to inventions) associated with and arising from this article. The authors reserve all these rights. No-one may reproduce, store or transmit, in any form or by any means, any part of this article without the authors’ prior written permission. The moral rights of the authors have been asserted.
The contents of this article reflect the authors’ personal opinions at the point in time at which this article was submitted for publication. However, by the very nature of ongoing research, they do not necessarily reflect the authors’ current opinions. In addition, they do not necessarily reflect the opinions of the authors’ employers.
References
- Chu and Wang (1998) P Chu and J Wang. Modelling return periods of tropical cyclone intensities in the vicinity of Hawaii. Journal of Applied Meteorology, 39:951–960, 1998.
- Clark (1986) K Clark. A formal approach to catastrophe risk assessment and management. Proceedings of the Casualty Actuarial Society, 123(140), 11 1986.
- Darling (1991) R Darling. Estimating probabilities of hurricane wind speeds using a large-scale empirical model. Journal of Climate, 4:1035–1046, 1991.
-
Drayton (2000)
M Drayton.
A stochastic basin-wide model of Atlantic hurricanes.
2000.
24th Conference on Hurricanes and Tropical Meteorology.
http://ams.confex.com/ams/last2000/24Hurricanes/abstracts/12797.htm. - Emanuel et al. (2005) K Emanuel, Ravela S, Vivant E, and Risi C. A combined statistical-deterministic approach of hurricane risk assessment. Unpublished manuscript, 2005.
- Vickery et al. (2000) P Vickery, P Skerlj, and L Twisdale. Simulation of hurricane risk in the US using an empirical track model. Journal of Structural Engineering, 126:1222–1237, 2000.