Noise-induced Transition between Dynamic Attractors in the Parametrically Excited Magneto-optical Trap
Abstract
We have investigated noise-induced transition of atoms between double or triple phase-space attractors that are produced in the parametrically driven magneto-optical trap. The transition rates between two or three dynamic attractors, measured for various modulation frequencies and amplitudes, are in good agreement with theoretical calculations and Monte-Carlo simulations based on the Langevin equations. Our experiment may be useful to study nonlinear dynamic problems involving transitions between states far from equilibrium.
PACS numbers: 32.80.Pj, 05.45.-a
There have been much studies on fluctuation-induced transition between states that are in equilibrium or far from equilibrium. For equilibrium systems, after Kramers’ seminal work Kramers , many theories have been suggested Haenggi and tested in many different experiments: for example, optically trapped Brownian particles Simon ; McCann , analogue circuits Dykman , and semiconductor lasers Hales . Recently, there have been several experiments on far from equilibrium systems, such as Penning trap Penning , vibration-fluidized granular matter Norl , and Josephson junction Josephson . Theoretical works on calculation of the transition rates Dykman2 or the transition paths Freidlin , and analysis of the critical exponents Dykman3 have been performed. In particular, interesting phenomena including oscillatory behavior with respect to the noise intensity Stein or the phase Golding , and saddle-point avoidance Luchinsky have been also expected. However, except the Penning trap, the only quantitatively investigated experimental system was the analogue electrical circuit Luchinsky2 , which can be considered as analogue simulations. For the Penning trap, on the other hand, experiment was carried out within a very narrow parameter region: only near the bifurcation points.
In this Letter, we report on the experimental study of the noise-induced transition in the paramterically driven magneto-optical trap (MOT) which is a far from equilibrium system. In particular, we have investigated the transition in nearly full parameter regions from super-critical bifurcation points (dynamic double attractors) to sub-critical bifurcation points (dynamic triple attractors). For double attractors, we have measured the transition rates by observing directly the change of population difference between two oscillating wells at various modulation frequencies and modulation amplitudes. On the other hand, the transition between three attractors, which has never been probed experimentally to our knowledge, has been studied indirectly by measuring the populations in each well Dykman2 . We have also investigated the transition during one period of modulation and found no phase dependence of the transition rates Golding . All the experimental results are found in good agreement with theoretical calculations and Monte-Carlo simulations based on the Langevin equations, which describe well the quantum dissipation DCohen including spontaneous emission that is the origin of fluctuations of atomic motion in MOT.
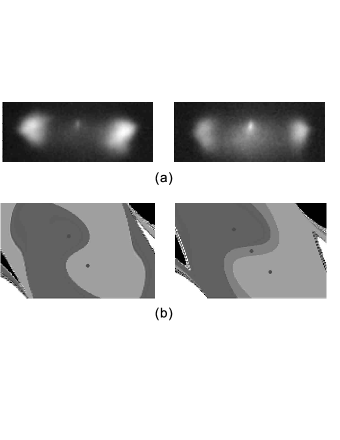
As reported in previous papers cnat , when the intensity-modulation frequency of the cooling laser is around twice the trap frequency between and , atoms are separated into two clouds [Fig. 1(a) Left] and oscillate in out-of-phase motion, which corresponds to the limit-cycle (LC) characterized by dynamic double attractors. Due to the nonlinearity of MOT, as is increased above but below , there appears an additional stable attractor at the center of the LC motion, called sub-critical bifurcation [Fig. 1(a) Right]. Given the modulation amplitude , the corresponding frequencies are, = , = , and = , where is the natural trap frequency of MOT, and is the threshold value of for parametric resonance to occur for a given damping coefficient .
Assuming no fluctuations of atomic motion, initial conditions of atomic position and velocity determine which attractors (represented by red dots) an atom ends up with. Figure 1(b) shows each region of two attractors (Left) and that of three attractors (Right). For example, if the initial condition of an atom lies in the light gray region, the atom approaches the attractor located in the same basin. In reality, however, there exist atomic fluctuating motions due to spontaneous emission, resulting in broadened distributions of atomic position and velocity near the stable attractors. For large diffusion (or spontaneous emissions), certain atoms may jump far from the original attractor and be transferred to another attractor through the unstable regions near the boundary. In this case, the shape of the atomic phase-space distribution resembles a dumbbell which has a narrow neck at the unstable point. The distribution represents the dynamic potential wells, as discussed in the static potential experiment McCann .
The transition rate can be characterized by the activation law, , which is the dynamic version of the Kramers’ equation. Here is the activation energy of each state and is the amount of diffusion which is proportional to the diffusion constant of MOT. In what follows we set and 2 for the stable states of two dynamic attractors and for the stationary state at the MOT center. As observed in the stationary position-space potentials, the transition rate increases as the diffusion increases or the activation energy decreases. Note that since all the nonlinear terms in the equations of motion of MOT have the same sign as the first order term, the activation energy is proportional to and .
Unlike the single electron in the Penning trap, there are more than 107 atoms in the initial MOT and each cloud of the LC motion under parametric excitation is almost equally populated. In order to monitor the transition between two dynamic attractors, it is needed to blow away one of the clouds because the atomic number transferred from attractor 1 to 2 is the same as that from 2 to 1. When atoms, say in attractor 1, are removed, one can observe some atoms in attractor 2 are transferred to 1 with time. Due to the two-way transitions the population difference decreases exponentially. For many particle systems the transitions can be described by the following simple rate equations,
| (1) |
where () is the population of the attractor 1 (2), is the trap loading rate, is the loss rate due to collisions by the background atoms, and () is the transition rate from the attractor 1 to 2 (2 to 1). Since and are small in our experiment (as discussed later), we neglect these terms and also assume due to the symmetry. Then the steady-state solution of the population difference (= ) is given by
| (2) |
where is the difference with one attractor (say, state) empty, or = 0.
Our experimental setup is similar to that described in previous work cnat , but with new features: we have used a photodiode array TF to measure the transition rates and used a resonant laser to blow away selectively one atomic cloud (say, ). The blowing laser was cylindrically focused at 5 mm left from the center of the LC motion. The intensity of the laser was over 5 times saturation intensity and it was turned on for 3 ms in order to remove only one atomic cloud.
Experimental results for double (triple) attractors are obtained at the intensity of ( ) and the detuning of -2.7 for the cooling laser along the longitudinal -axis, and the magnetic field gradient of 10 G/cm, where = 3.78 mW/cm2 is the averaged saturation intensity and = 5.9 MHz is the natural line width. The laser intensity and detuning along the transverse - and -axis are 0.63 and -3.0 , respectively. For these parameters, the measured trap frequency is 33.4 Hz (43.9 Hz, for triple states), and the detected damping coefficient is 45.4 s-1 (for triple states, 85.9 s-1), which are in good agreement with the simple Doppler theory. Note that the sub-Doppler nature of MOT is dramatically suppressed and thus neglected when the transverse laser detuning is slightly different from that of the -axis laser, as discussed in depth in our previous work TF .
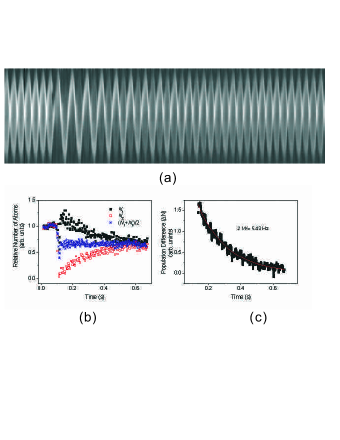
The typical data about the transition between dynamic double wells are presented in Fig. 2. Figure 2(a) shows a contour plot generated by the atomic absorption signals recorded on the 16 channel photo-diode array. The vertical axis represents the atomic position and the longitudinal axis the time evolution. In Fig. 2(a), large absorption (or large atomic number) is indicated by bright color. From the plot one can trace the oscillating LC attractors and measure the atomic number. It can be observed that one attractor is made empty at 7 half cycles from the left, which is then repopulated with time, as plotted in Fig. 2(b). Figure 2(c) presents the temporal variation of the population difference (), which clearly shows the exponential decay as expected in Eq. (2) where the decay rate is twice the transition rate. Note that the total number of atoms is nearly conserved during the transitions [asterisks in Fig. 2(b)], which justifies neglect of the loading rate and loss rate in Eq. (1). In reality, the loss rate of our MOT is 0.15 s-1 which is much smaller than the typical transition rates.
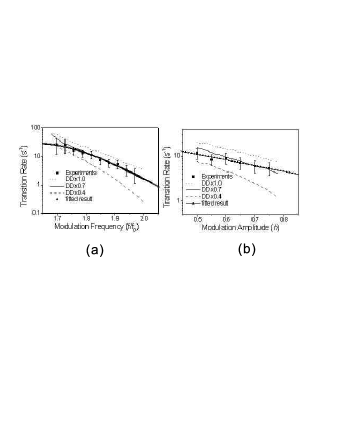
The experimental results in Fig. 3 were obtained by exponential fitting of Fig. 2(c) for (a) various modulation frequencies at and (b) modulation amplitudes at . The curves in Fig. 3 represent the Monte-Carlo simulation results obtained from simple Doppler equations based on two-level atom and random spontaneous emission. We have first calculated the trajectories of atomic motion of atoms initially in state and monitored the subsequent time evolution of the population of the two states. We have then obtained the transition rates by fitting Eq. (2). As can be observed in Fig. 3, the experimental results are in good agreement with the simulations when diffusion constant is 0.7 times DD, where DD represents the Doppler diffusion coefficient (Eq. (22) in Ref. OC04 ).
In the low damping regime, one can also find that the transition rates approximately vary around the bifurcation point as
| (3) |
where is the modulation frequency at the bifurcation point, and and are constants Dykman2 . The constant was obtained by direct calculation Dykman2 . The constant and the diffusion were used as fitting parameters. The consequent diffusion for our experimental conditions is 0.071(8), which are in the same order to the calculated value with simple Doppler theory Dykman2 . Here the coefficient is nonlinear coefficient of a term in the equation of motion of a parametrically-driven atom, which is presented as Eq. (7) in Ref. OC04 . The triangles in Fig. 3(a) and 3(b) represent the fitted results. Even though the calculations are mainly well applied in the limit and , we can see these fittings very well describe the experimental results.
Since and are of the same order in our experiment, we also have studied the time dependence of the transition during one period of parametric oscillation. By averaging the absorption signals over 20 times, we have obtained the population evolution during each period. The experiments were performed at and , with the same laser conditions and magnetic field gradient as above. The transition rate was 15.4 s-1, which was measured during three oscillation periods until the population difference became negligible. In particular, we have not found any phase dependence of the transition rates, which indicates that transitions occur constantly without any dependence of location of atomic clouds in phase space. Note that these results are very different from those observed in periodic driven systems Golding , which were studied only theoretically. Experimental results are also in very good agreement with simulations, which do not show any clear variation of the transition rates during one period.
For the case of dynamic triple attractors, direct observation of the transition is difficult in our setup. When , it is numerically observed that transition occurs only between one of the two dynamic states (1 or 2) and the stable state (0), with no direct transitions from 1 (2) to 2 (1). Moreover, unlike the double wells, the transition rates from state to 0 are not necessarily the same as from state 0 to (). Thus the method of just removing the state 1 and monitoring the time evolution of the population difference does not provide the necessary information of the relevant transition rates. Therefore we have studied the transition in the sub-critical region by using an indirect method of measuring the populations in each state. The ratios of the population (or ) to can be used to obtain the transition rates, that is, = =, where we have employed and . Note that for a larger modulation frequency, becomes larger than (or ) Dykman2 , which is confirmed in our experiment.
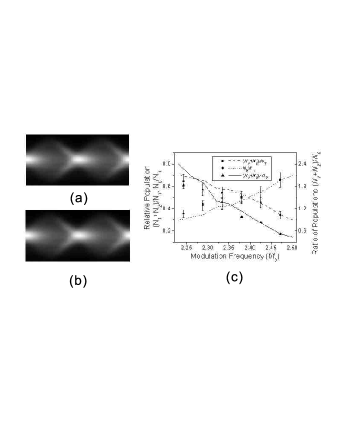
The experimental and simulation results for dynamic triple attractors are presented in Fig. 4. Figure 4(a) shows the motions of atomic clouds during single period of oscillation, which provides the population in each state. States 1 and 2 show out-of-phase oscillating motions, while state 0 stays at the center. Our simulations [Fig. 4(b)] have very similar results to the absorption image [Fig. 4(a)], with different spatial resolutions (1 mm for Fig. 4(a) and 0.1 mm for Fig. 4(b)).
The data of ( + )/ (filled boxes) and / (filled circles) in Fig. 4(c) are obtained by fitting the profiles of Fig. 4(a) at 0.58 phase. The dashed curves (( + )/) and dotted curves (/) are derived from Fig. 4(b) at 0.5 . Here ( = 0,1,2) is the population of the state and =++. The profile shows three peaks, representing three states, are fitted by triple Gaussian functions. Filled triangles (experiment) and solid curves (simulation) are just the ratios of + to , which also provides the ratio of the transitions rates (). One can observe is increased as increases, whereas and are decreased. It shows that the transition from state 1 (2) to state 0 becomes easier than that from 0 to 1 (2) as increases. These results are in good agreement with theoretical calculation where is the activation energy of state Dykman2 .
The parametrically driven MOT is an ideal experimental realization of dynamic double and triple attractors under the conditions far from equilibrium. We have investigated the noise-induced transition at various and from the super-critical to sub-critical bifurcation region. The results are well described by the Monte-Carlo simulations based on the Langevin equations and the simple Doppler theory. Note that our system may be important and useful to study nonlinear problems associated with transitions in far from equilibrium systems. One may also extend our system to the study of transitions between dynamic states due to non-symmetric oscillations that occur in more nonlinear situations Silchenko .
Acknowledgements.
This work was supported by the Creative Research Initiative of the Korea Ministry of Science and Technology. The research of H. R. Noh was financially supported by research fund of Chonnam National University in 2004.References
- (1) H. A. Kramers, Physica (Utrecht) 7, 284 (1940).
- (2) P. Hånggi, P. Talkner, and M. Borkovac, Rev. Mod. Phys. 62, 251 (1990).
- (3) A. Simon and A. Libchaber, Phys. Rev. Lett. 68, 3375 (1992).
- (4) L. I. McCann, M. I. Dykman, and B. Golding, Nature (London) 402, 785 (1999).
- (5) M. I. Dykman, P. V. E. McClintock, V. N. Smelyanskiy, N. D. Stein, and N. G. Stocks, Phys. Rev. Lett 68, 2718 (1992).
- (6) J. Hales, A. Zhukov, R. Roy, and M. I. Dykman, Phys. Rev. Lett. 85, 81 (2000).
- (7) L. J. Lapidus, D. Enzer, and G. Gabrielse, Phys. Rev. Lett. 83, 899 (1999).
- (8) G. D’Anna, P. Mayor, A. Barrat, V. Loreto and F. Norl, Nature (London) 424 909 (2003).
- (9) N. Grønbech-Jensen, M. G. Castellano, et. al. Phys. Rev. Lett 93, 107002 (2004); I. Siddiqi. et. al., cond-mat 0312553 (2003).
- (10) M. I. Dykman and M. A. Krivoglaz, Sov. Phys. JETP 50, 30 (1979); M. I. Dykman, C. M. Maloney, V. N. Smelyanskiy, and M. Silverstein, Phys. Rev. E 57, 5202 (1998).
- (11) A. D. Ventsel and M. I. Freidlin, Usp. Mat. Nauk. 25, 5 (1970) [Russ. Math. Surv. 25, 1 (1970)].
- (12) M. I. Dykman, B. Golding, and D. Ryvkine, Phys. Rev. Lett. 92, 080602 (2004).
- (13) R. S. Maier and D. L. Stein, Phys. Rev. Lett. 77, 4860 (1996).
- (14) V. N. Smelyanskiy, M. I. Dykman, and B. Golding, Phys. Rev. Lett. 82, 3193 (1999).
- (15) D. G. Luchinsky, et. al., Phys. Rev. Lett. 82, 1806 (1999).
- (16) D. B. Luchinsky, and P. V. E. McClintock, Nature (London) 389, 463 (1997); D. B. Luchinsky, P. V. E. McClintock, and M. I. Dykman, Rep. Prog. Phys. 51, 889 (1998).
- (17) D. Cohen, Phys. Rev. Lett. 78, 2878 (1997).
- (18) K. Kim, H. -R. Noh, Y. -H. Yeon, and W. Jhe, Phys. Rev. A 68, 031403(R) (2003); K. Kim, H. -R. Noh, H. J. Ha, and W. Jhe, Phys. Rev. A 69, 033406 (2004).
- (19) K. Kim, H. -R. Noh, and W. Jhe, to be published in Phys. Rev. A (2005); K. Kim, K. -H. Lee, M. Heo, H. -R. Noh and W. Jhe, submitted.
- (20) K. Kim, H. R. Noh, and W. Jhe, Opt. Commun. 236, 349 (2004).
- (21) A. N. Silchenko, S. Beri, D.G. Luchinsky, and P.V. E. McClintock, Phys. Rev. Lett. 91, 174104 (2003).