Prototype scintillator cell for an In-based solar neutrino detector
Abstract
We describe the work carried out at MPIK to design, model, build and characterize a prototype cell filled with a novel indium-loaded scintillator of interest for real-time low energy solar neutrino spectroscopy. First, light propagation in optical modules was studied with experiments and Monte Carlo simulations. Subsequently a prototype detector was set-up and the optical performances of several samples were measured. We first tested a benchmark PXE-based scintillator, which performed an attenuation length of and a photo-electron yield of . Then we measured three In-loaded samples. At an In-loading of , an energy resolution of and a spatial resolution of were attained for recoil electrons. The long-range attenuation length in the cell was and the estimated photo-electron yield . Light attenuation and relative light output of all tested samples could be reproduced reasonably well by MC. All optical properties of this system have remained stable over a period of .
keywords:
Solar neutrinos , Indium experiment , Indium loaded scintillator , Prototype detector , Optical performancesPACS:
29.40.Mc , 26.65.+t1 Introduction
The use of indium as a target for the real-time spectroscopy of low energy solar (pp, 7Be, CNO) has been thoroughly investigated in the past [1, 2, 3, 4] and reproposed in recent years [5, 6]. In the period 2001-2004 the feasibility study of an In-based solar neutrino detector has been the focus of the LENS project [7]. The results presented here have been carried out within the framework of this pilot phase.
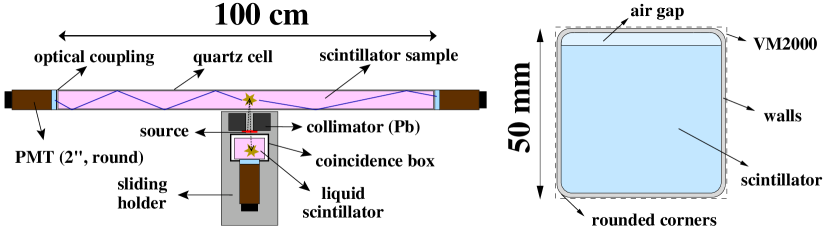
The detection would proceed via an inverse-EC reaction on 115In ( isotopic abundance), followed by the delayed de-excitation of the daughter isomeric state 115Sn∗ . The In target is dissolved in an organic liquid scintillator at the highest concentration compatible with adequate optical performances.
115In decays with , which translates to a specific activity of in In. The suppression of the backgrounds associated with the target activity requires a finely segmented detector. The basic envisaged unit is an optical module, or cell, filled with In-loaded scintillator and viewed by two photomultiplier tubes (PMTs), as shown in Fig. 1. The PMTs measure the energy deposited in the scintillator and, through signal timing at both sides, the position of the event along the cell longitudinal axis. There is no handle for the reconstruction of the transversal coordinates, therefore the cell cross-section must be chosen sufficiently small to control the background. The length is upper-limited by light attenuation in the module. The range considered for the cell dimensions is side, length.
In order to test thoroughly the detector concept, a pilot experiment [8] has been set-up at the LENS Low Background Facility (LLBF) [9], at the Gran Sasso underground laboratory. The pilot detector consists of a matrix of scintillator cells. Four of the 9 cells are filled with In-loaded liquid scintillators developed by us [10, 11, 12] and another group of the LENS collaboration [13].
In this paper we describe the preparation, modeling, optimization and final optical characterization of a prototype cell of an In-based solar neutrino detector. In Sec. 2 we report on experimental studies on the light “piping” in the cell. Sec. 3 describes our In-loaded liquid scintillator, with focus on its optical properties. Sec. 4 is devoted to the modeling of optics in the cell, and the results of preparatory Monte Carlo studies are presented. In Sec. 5 we describe the prototype setup and measurement campaigns. The results, including the crucial test of the long-term () stability of this system, are presented in Sec. 6. In Sec. 7 we give our conclusions and outlook.
2 Measurements of light piping
The background suppression in an indium solar neutrino experiment requires the unitary cell to have a small cross-section ( side). To limit the hardware costs, the unitary cell needs to be as long as possible. In such a geometry (Fig. 1), photons undergo many reflections before hitting the PMTs and even a small inefficiency can result in large light losses. These can degrade the detector energy and spatial resolution, which are the fundamental parameters toward background reduction.
Denoting R as the surface reflectance, we have estimated that with the original light intensity would drop to less than 1/2 at distance, thus preventing the construction of sufficiently long cells (i.e., of an affordable detector). For the validation of the detection concept it was necessary to check which level of piping efficiency can be met by using available technology.
We have experimentally investigated the reflection coefficients of two suitable piping mechanisms: total internal reflection (TIR) in a quartz prototype cell; specular reflectance (SR) in a pipe lined with a reflective foil. Quartz is the material chosen for the cells of the final LENS pilot detector, due to its low activity and chemical compatibility with organic solvents.
2.1 Total internal reflection
Total internal reflection from an optically denser to a less dense medium provides in principle a efficient piping for all impinging angles larger than , where ni,o are the refractive indices of the inner and outer media. However, because of surface imperfections the real reflectance is lower.
We have used a prototype quartz pipe to estimate the effective TIR reflectance in a scintillation module. The pipe is long, its section is square with rounded corners, with external dimension and quartz thickness. Materials and surface finishing are similar to those of the final LENS prototype cells (to describe in Sec. 5).
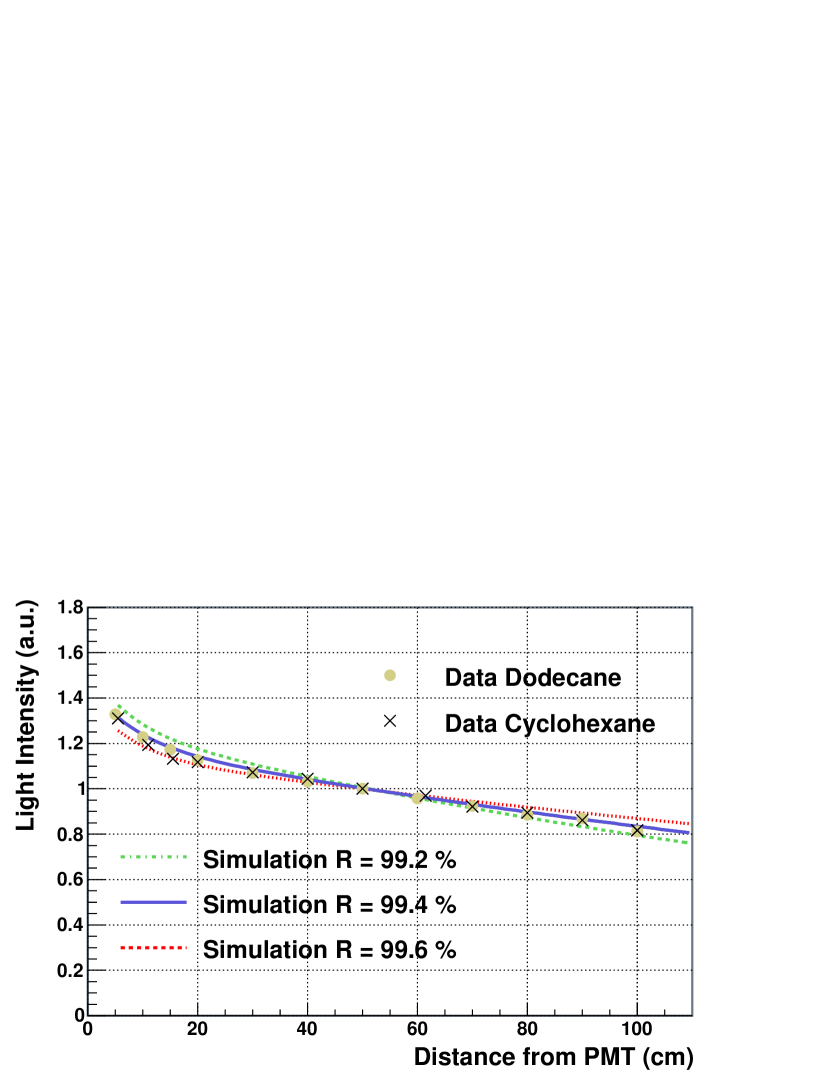
A drawing of the experimental setup is shown in Fig. 2. The quartz tube is coupled to a PMT on one side and open on the other side for filling and insertion of a light fiber, which is connected to a LED111The results of similar measurements carried out at are reported in [15]. The latter can be externally triggered to emit light in form of fast pulses. At the free side of the fiber a Teflon cap diffuses the LED light. The cell was filled with liquids to simulate a scintillator-like refractive medium. We have used “Uvasol” cyclohexane (), “Uvasol” ethanol () and “99+%” dodecane (), all showing excellent transparency in the UV-visible range. The light fiber can be deployed at various distances from the PMT and we measured the light intensity as a function of the distance.
Fig. 3 shows the results of the measurements and the curves we predict for three values of the TIR reflectance. The predictions are given by a photon-tracing MC simulation.
We observe that the two measurements using different filling liquids are consistent with each other. The data analysis is based on the comparison with the MC predictions (details in [15]). The result is:
| (1) |
The uncertainty () includes the statistical error (), and the systematic errors due to the approximations in the MC () and to the uncertainty of the attenuation length of quartz and liquids ().
2.2 Specular reflection by VM2000 foil
TIR is a very efficient piping mechanism, however has the disadvantage that a large fraction of the solid angle is not covered (, for in the liquid). SR can be nearly equally efficient at all angles, however the reflectance of conventional metal-coated mirrors is limited.
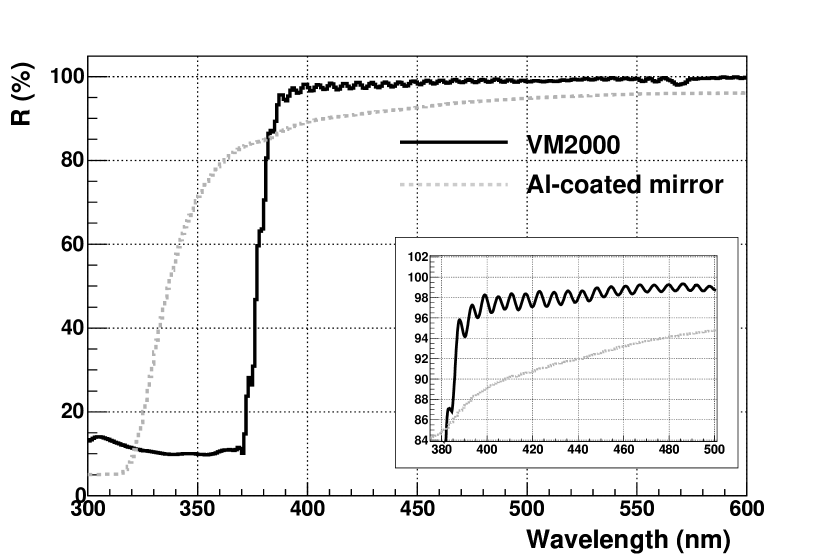
3M has recently issued the VM2000, a multi-layer reflective foil based on a novel technology [16]. We have measured the absolute reflectance of different samples of VM2000 using the V-W accessory of our Varian Cary 400 spectrophotometer.
Fig. 4 shows the result of a sample from a batch shipped by 3M in 2002222Older foils had significantly different spectra and an overall worse performance, see [15]. and, for comparison, the reflectance of a conventional Al-coated mirror. We found that this foil has for ( at ). However, the systematic error of the measurement () is too large with respect to the dependence of the response of an indium cell on R. Moreover, our equipment probes only one angle of incidence ().
For these reasons, the system used to investigate TIR has been adapted for the measurement of a SR-based cell: a long square profile of VM2000 was inserted into the quartz tube, so that the quartz internal surface was lined with reflective foils (Fig. 2). Data were taken with the pipe filled with air and liquids to test whether the optics of the foil is affected by the refractive index of the coupled medium, and to cross check systematics due to the absorption in the liquid. Data were analyzed by comparing with MC, and the result at is:
| (2) |
for foil either in liquid and in air. The error () includes the statistic uncertainty, the systematics deriving from the uncertainty in the shape and dimensions of the pipe, and as well the systematics associated with the MC-based analysis procedure. The result 2 is consistent with the V-W measurement at near-normal incidence, however it is more precise and gives a reflectance averaged over the foil surface and all angles of incidence.
2.3 Implications
Given the results of Eqs. 1 - 2, the design optimizing light piping in an indium solar neutrino experiment is a TIR-based cell externally wrapped with non-coupled VM2000 foil.
We have used the measured reflection coefficients to study the optics of a cell via MC simulations. The results, published in [15], indicate that with the aforementioned TIR/SR design, piping inefficiency would not be limiting as far as the attenuation length due to absorption in the scintillator is . This result was crucial to advance the LENS project in the pilot phase.
3 In-loaded scintillator
One approach initially explored in LENS for the production of In-loaded scintillators was to dissolve In as a carboxylate compound [6]. However, it turned out that indium has a much higher chemical reactivity to than to the carboxylic acids: begins to react with water to form hydroxy species even at pH 1 [14].
Hydrolysis is a severe problem toward the synthesis of a stable and robust In-loaded scintillator. The idea pursued at MPIK was to encapsulate the In atom in a stable molecule that preserves its identity in the organic solution. This was accomplished by using -diketones as ligand [10].
Several In -diketonates have been synthesized and studied. The -diketone finally chosen for the LENS prototype is the simplest one, acetylacetone (Hacac), and the In complex is in the form . The latter is produced as a white crystalline powder, purified by sublimation and finally dissolved in the scintillator base. We found the solubility of in most of the standard organic scintillator solvents (including PC and PXE) not to be sufficient for the demands of a neutrino detector. However, anisol ensures a higher solubility, with a limit In-loading of by weight [10].
3.1 Light yield
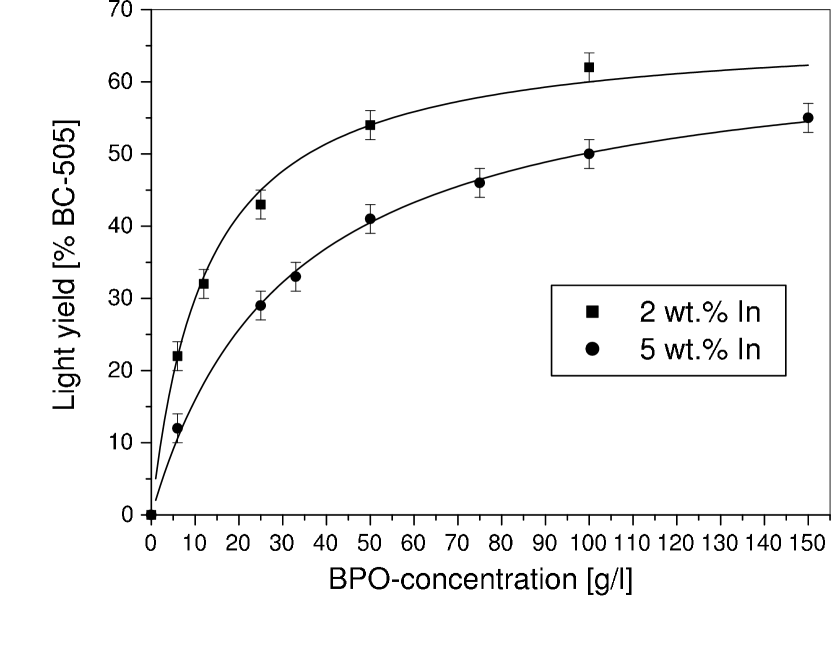
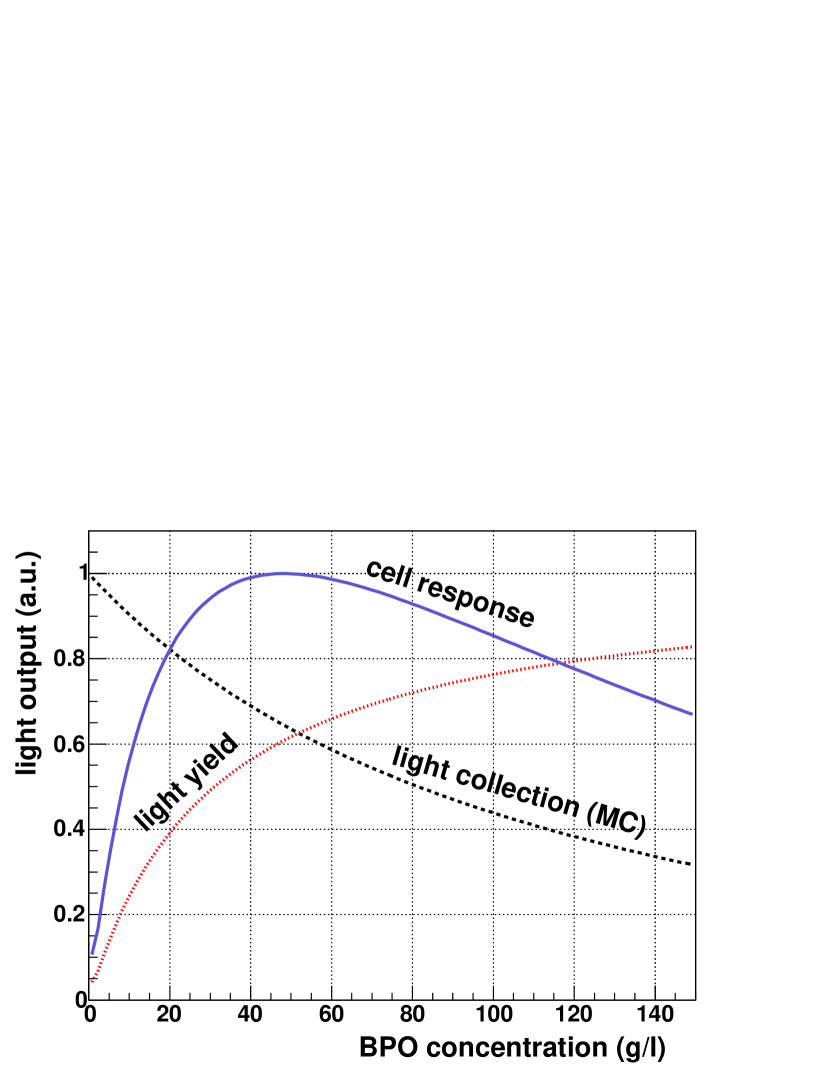
The In(acac)3 molecule has an absorption band that overlaps with the UV emission of anisol [11]. In(acac)3 gives no detectable fluorescence when excited at its absorption band [11], hence this molecule dissipates a part of the solvent excitation that would otherwise convert into scintillation light. The strategy to obtain good light yields (LY) is to enhance the [anisol fluor] pathway relative to the quenching [anisol In(acac)3] dissipation. The concentration of In(acac)3 is constrained by the demand of high In-loading, therefore the only handle for controlling the energy transfer is the choice of the fluor and its concentration. We found that the best results are given by BPO [2-(4-bi-phenyl)-5-phenyloxazole] [12, 18] and we observed that at high In-loading, the LY in a small sample increases monotonically with the BPO concentration, up to its solubility limit. The dependence of the LY on the fluor concentration is well explained by theoretical models of energy transfer and light quenching [12, 18]. Fig. 5 shows the LY versus the BPO concentration in two In-acac scintillator samples differing by In-loading. At the benchmark In-loading of , notable light yields are only obtained with fluor concentrations that are “unusual” in standard organic scintillators, as regards the use in large scale detectors.
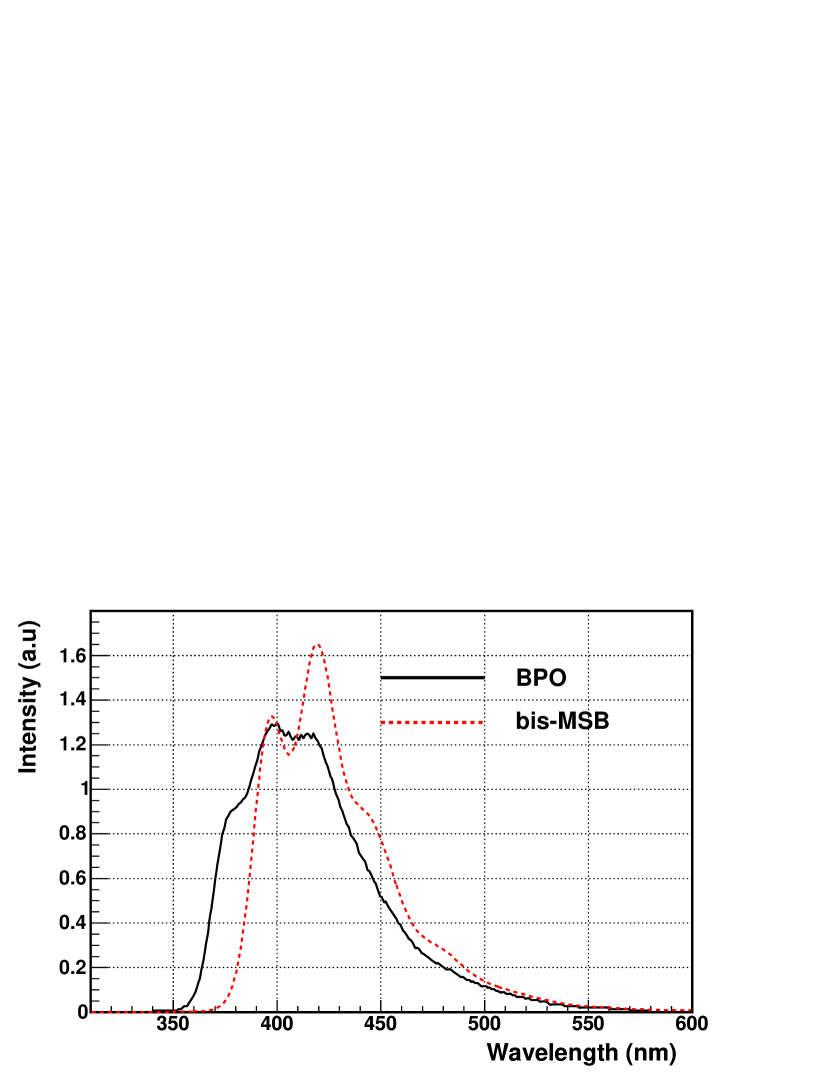
We also use bis-MSB [1,4-bis(2methyl-styryl)benzene]. The primary LY in BPO systems is nearly independent of its concentration [12, 18], however bis-MSB shifts the scintillation light in a wavelength region of higher transparency. Fig. 6 shows the emission spectra of the two fluorescing molecular systems dissolved in our scintillator.
3.2 Light attenuation
For application in a solar neutrino detector, the scintillator formulation has to maximize the photo-electron yield (PY) in a cell. In this case, light attenuation in the detector plays an important role.
We have measured by spectrophotometry the extinction coefficients of each scintillator component, as described in [10, 11, 18]. This information is combined with the concentration to calculate the partial attenuation length, , due to the solute. In our mixture the attenuation processes due to each component are independent of each other, hence the resulting global attenuation length is calculated as:
| (3) |
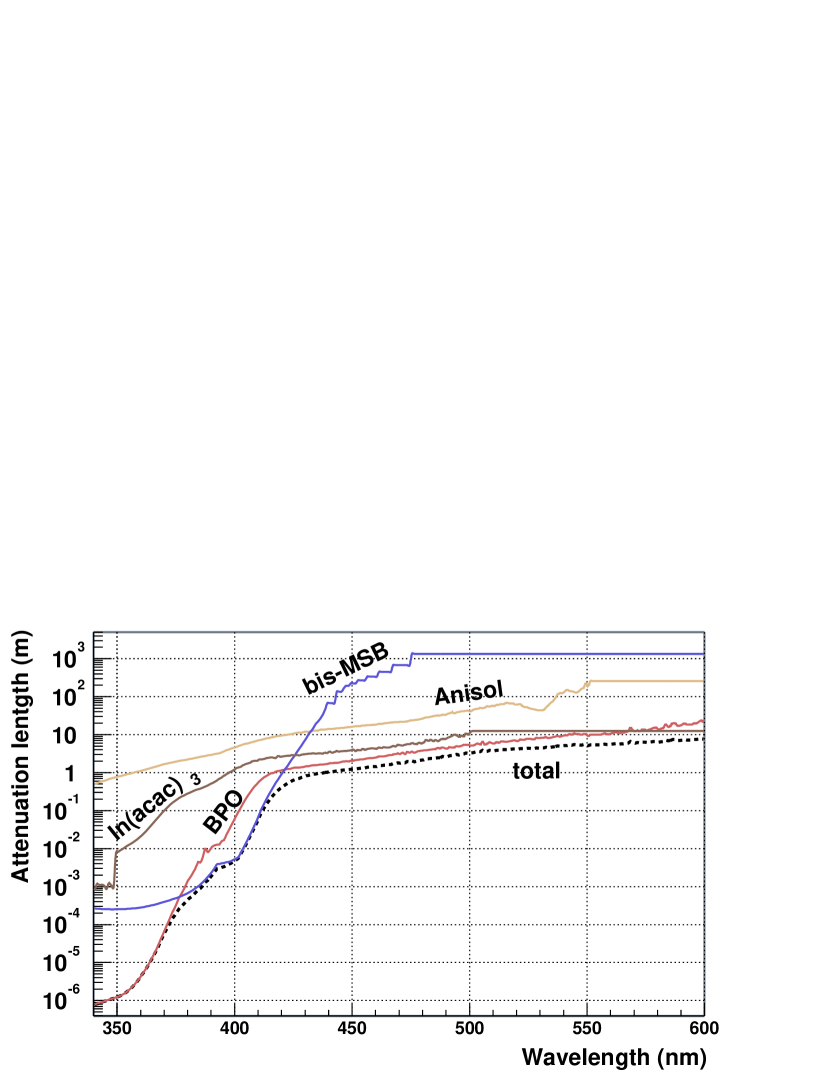
As an example, the partial and the total for the system [anisol / In(acac)3 (In 50 g/l) / BPO (50 g/l) / bis-MSB (100 mg/l)] are plotted in Fig. 7. At the reference wavelength of , the dominating contribution is due to BPO . Fluorimetric measurements have shown that BPO absorption for greater wavelengths than is not followed by re-emission and hence results only in a light loss333Several attempts to purify BPO gave no significant improvement of the transparency. [12, 18]. The purified In(acac)3 contributes , anisol and bis-MSB both . The resulting total attenuation length at is .
The conclusion is that reasonable detector performances can be obtained either with a more In-diluted scintillator (so that less fluor is needed), or with shorter cells than initially envisaged. The decision for the LENS pilot phase was the latter and hence the dimensions of the prototype cells were fixed to . The focus has then shifted to find the parameter area where the best compromise between primary LY and efficient light transport over distance is realized. This was accomplished by MC simulations.
4 Model of an In-loaded scintillator cell
We have developed an optical model of the detector implementing a detailed physical description of those features that we identified as crucial. This model has been used to write a photon-tracing MC of an In-loaded scintillator cell.
The MC implements a geometry that faithfully reproduces the actual In prototype cell, to be described later (shown in Fig. 10). The scintillator formulation is based on the aforementioned anisol/In(acac)3/BPO/bis-MSB mixture. We made the assumption that light is emitted according to the fluorescence spectrum of the last non-radiatively excited component. We have determined the nature of the donor-acceptor energy transfer as discussed in [11, 18]. We found that, for our concentration levels, the transfer anisol BPO is non-radiative, while BPO bis-MSB is predominantly radiative. As a consequence, we assume the BPO emission spectrum as the primary fluorescence (Fig. 6).
The basic interactions of optical photons in a medium are absorption, elastic scattering and inelastic scattering. In the latter case the photon is absorbed by a fluorescing molecule, which de-excites emitting a photon of longer wavelength. In our systems different chemical species are present and each one contributes to some or all of the above processes. At the spectrophotometer, absorption, elastic and inelastic scattering are indistinguishable, as they all result in removing photons from a collimated beam. Therefore, it is necessary to evaluate independently their relative probabilities. We have neglected elastic scattering, since it is sub-dominant in most cases. Consequently, the measured extinction is considered as the sum of absorption and inelastic scattering. A fluorescence quantum yield, , can be defined as the probability that an absorption is followed by a prompt re-emission. In Table 1 the values of used in our model are reported. We assume for anisol at all wavelengths because its emission spectrum has no overlap with the emission of BPO [11]. BPO is expected to have very high quantum yield, as the literature value for the similar PPO is [19]. However, we chose a more conservative , with cut-off at (see Sec. 3.2). For bis-MSB we use the literature [19] and our fluorimetric measurements for the cut-off [18]. and quartz do not show fluorescence in the visible, hence .
In our MC simulation all components interact with light independently of each other. The respective attenuation lengths are calculated from the concentrations and extinction coefficients, as in Fig. 7. The parameters in Table 1 are used to decide whether an interaction is an absorption or a wavelength shift. Light piping in the cell is simulated via TIR and SR using Eqs. 1 and 2. We fix the refractive index of scintillator, quartz and PMT window to 1.5. The PMTs are coupled to the cell ends with surface coverage (a disk inscribed in a square). For their sensitivity, the typical “green-enhanced” bialkali QE is chosen, and the values are downscaled of a factor 0.75 to take into account the reduced sensitive area and the collection efficiency. Light interaction with the PMTs is modeled as in [20].
The output of the MC is the photo-detection probability, which can be converted in absolute units by folding with the scintillator LY.
4.1 Scintillator optimization
One crucial question addressed by MC simulation is the determination of the optimal BPO concentration, for the given In-loading. For this analysis the bis-MSB concentration was fixed to , and BPO was varied.
Taking as reference parameter the light output for a source at the cell center, Fig. 8 illustrates the competition between LY and light transport. The best compromise is expected at BPO, which gives relative to BC505444The BICRON specification for BC505 is of Anthracene. The BC505 measured by us is of the Borexino mixture [22], reported as giving [24]..
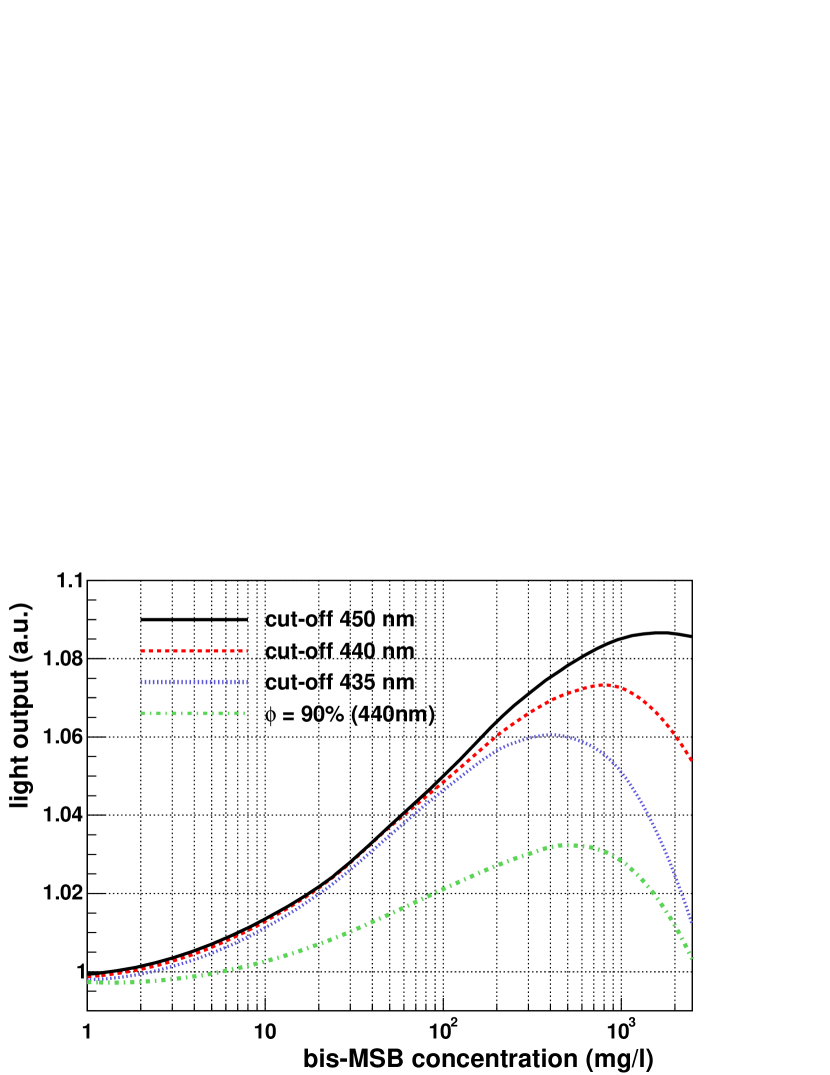
In a similar way, the effect of the variation of the bis-MSB concentration was studied via MC simulation. The results are shown in Fig. 9, for a fixed BPO concentration of and source at the cell center. The MC predictions are strongly model-dependent and the optimal bis-MSB concentration shifts to higher values along with the cut-off for re-emission and with . Using the best values from the literature and our measurements (Table 1), the optimal concentration is expected in the few to range, and should yield a relative increase of the light output with respect to the case of no bis-MSB. The bis-MSB concentration is therefore predicted to be a non-critical parameter. This is due to the fact that the BPO emission is already peaked at long wavelengths (Fig. 6) and that BPO can itself act as a wavelength shifter (WLS) in the range .
5 Prototype set-up and measurement campaigns
The prototype cell reported here is one of a set of 12 identical quartz modules built by MPIK for the LENS pilot experiment [8]. The raw profile tubes have been manufactured by the Heraeus Quartz Glas GmbH out of “synthetic quartz crystals”. Helma GmbH has welded the two side windows and manufactured two openings and stoppers for liquid filling/removal. The cells have been finally annealed at Heraeus.
The cell dimensions are , the section is square with rounding at the corners ( radius of curvature) and the wall thickness is . A air gap is left on top of the scintillator to avoid that this touches the stoppers of the filling openings.
5.1 Experimental technique
A system has been set up to measure the optical performances of the prototype cell, including light attenuation, energy and spatial resolution, PY. In order to test the detector response to the deposition of single known energies, the Compton-back-scattering (CBS) technique was implemented.
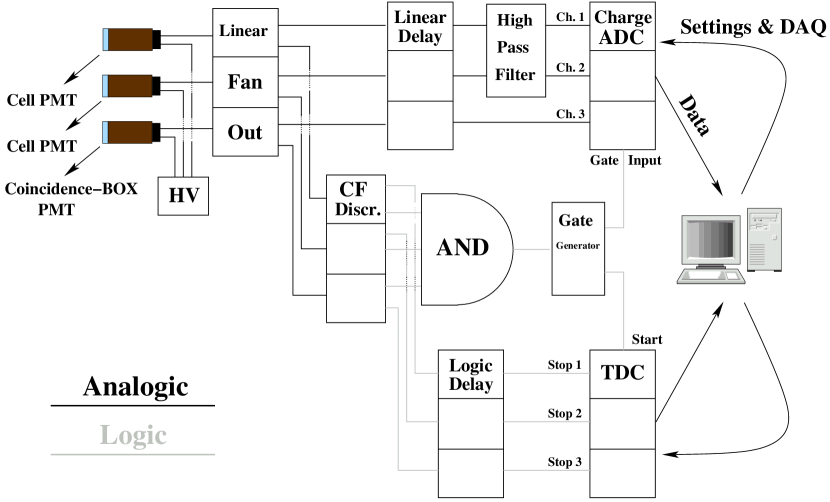
Fig. 10 shows a drawing of the experimental set-up. The cell is irradiated with a collimated source and the light pulses resulting from the energy deposited by the scattered electrons are measured in coincidence on both PMTs. An additional liquid scintillation unit is located on the back side of source and collimator, opposite to the cell. A three-fold coincidence can be set, which selects the events with simultaneous energy deposition in the cell and in the back-scattering box.
The logic scheme of the electronics is shown in Fig. 11. The PMTs used are the ETL9954B. Their analogical signals are doubled; one copy is discriminated and then used to form the trigger condition and the logic stop signals for a Time-to-Digital-Converter (TDC); the other copy is delayed of the time required for the system to trigger and then sent to an integrating charge-sensitive Analog-to-Digital-Converter (ADC).
In order to improve the S/B ratio of the CBS measurement, we apply event-by-event cuts. A large part of the backgrounds is removed by requiring that the energy in the coincidence box is and that the TDC spatial reconstruction of the event is consistent with the position of the irradiated volume.
Two sources have been utilized: 137Cs and 54Mn, which deliver CBS recoil electrons of and , respectively. These two energies are particularly significant for an In detector: the former is close to the energy of the second of the -tag () and is representative of the hard-Bremsstrahlung background [7]. The CBS of the 54Mn source has an energy similar to the total energy released by the -tag (). With these two sources it is possible to test directly how well the -tag can be resolved from background events in the range of the 115In end-point energy. This is one of the most crucial issues for the feasibility of an indium solar neutrino experiment [7].
5.2 Measurements
We have measured 4 scintillator samples, whose characteristics are reported in Table 2. We will refer to them using the same nomenclature in the table. After each cell filling the scintillator has been flushed with nitrogen for about one hour to sweep oxygen, which can decrease the LY and lead to chemical degradation.
5.2.1 Benchmark PXE cell
The PXE-based scintillator serves to study the detector performance in a benchmark case. The PXE comes from a batch used by Borexino in the CTF [21]. We measured the LY to be relative to BC505. The sample has been purified by us using a solid (neutral pH silica-gel) column plant as reported in [21]. The resulting attenuation lengths at various wavelengths are given in the first row of Table 3. In the range of the emission peak , therefore the measurement of this sample tests the optical integrity of the quartz cell and cross-checks the reflection coefficients given in Sec. 2, through comparison with the MC. Furthermore, assuming that no highly In-loaded scintillator would ever perform better than this sample, the PXE performances provide an upper limit for those of an In-cell in the considered design.
5.2.2 In-loaded cells
We have synthesized and purified several hundreds grams of In(acac)3 crystals for use in these optical measurements and for loading in the final LENS pilot detector at Gran Sasso. The three scintillator samples In-l, In-h1 and In-h2 have been prepared by subsequent additions of components to a common base. The measurement of the In-l sample aims at studying the cell performance in the lowest In-loading range that is considered of interest for a solar neutrino detector. The samples In-h1 and In-h2 have In-loading in the range targeted by LENS and are the base case for the pilot phase. Their BPO concentration was chosen based on the results of the MC studies presented in Sec. 4.1 and they only differ by the bis-MSB concentration. Table 3 reports the attenuation lengths of the three samples at various wavelengths.
6 Results
6.1 Benchmark PXE cell
Two sets of measurements have been performed:
-
1.
TIR light piping
-
2.
TIR plus VM2000 light piping
For the measurements 1 light was piped via TIR at the quartz/air and scintillator/air boundaries. For the second campaign a non-coupled VM2000 profile has been wrapped around the cell.
6.1.1 Light attenuation
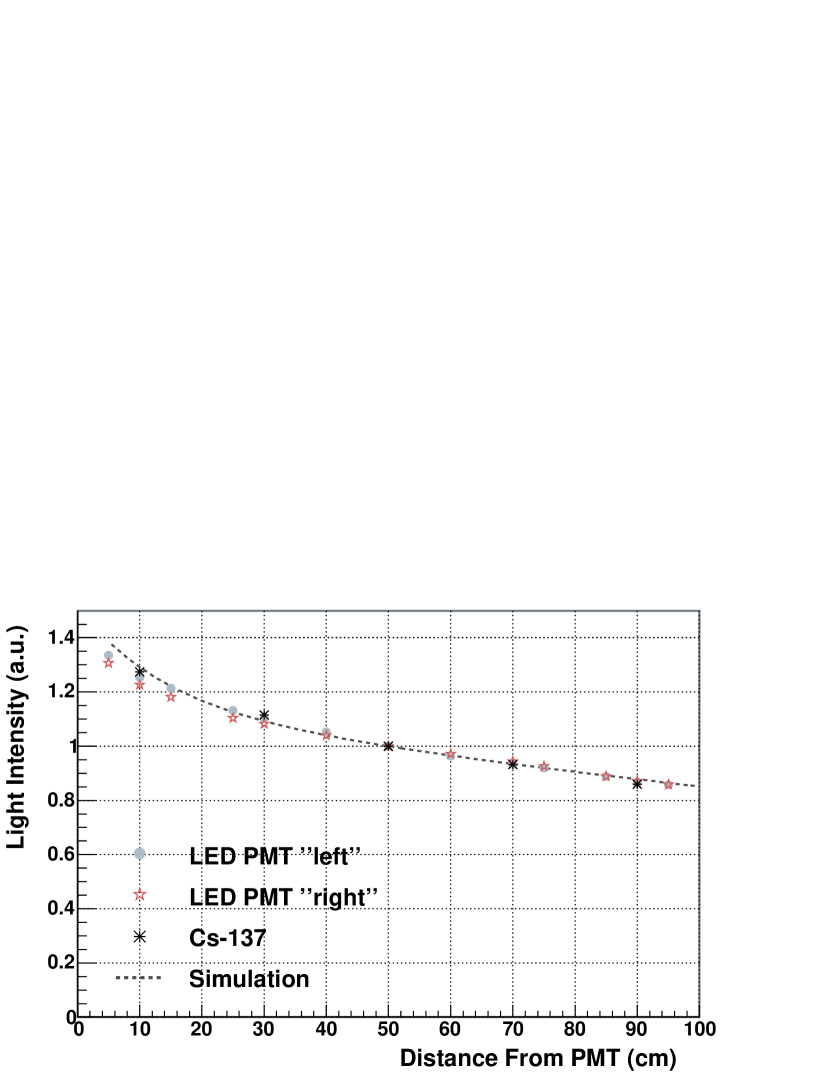
With the TIR cell the light attenuation curve has been measured by scanning the detector response to a collimated LED. The LED excites the scintillator fluors, which re-emit light isotropically. The resulting light attenuation curves are shown in Fig. 12. For comparison, the graphics also reports the data-points obtained with the CBS peak of the 137Cs source (measurement to be described later). The prediction of the MC simulation of the system is also shown in the figure.
No significant differences are observed in the attenuation curves measured by the two PMTs, as expected, and the CBS data are consistent with the LED measurement. A small departure between simulation and experiment is observed at short distances, where the simulation predicts a slightly faster attenuation555Since we compare the attenuation curves with each other upon normalization at the cell center, the fact that the simulation stays above the data at short distance simply means that light is expected to be attenuated faster in this range.. However, in the rest of the curve MC and data are in good agreement.
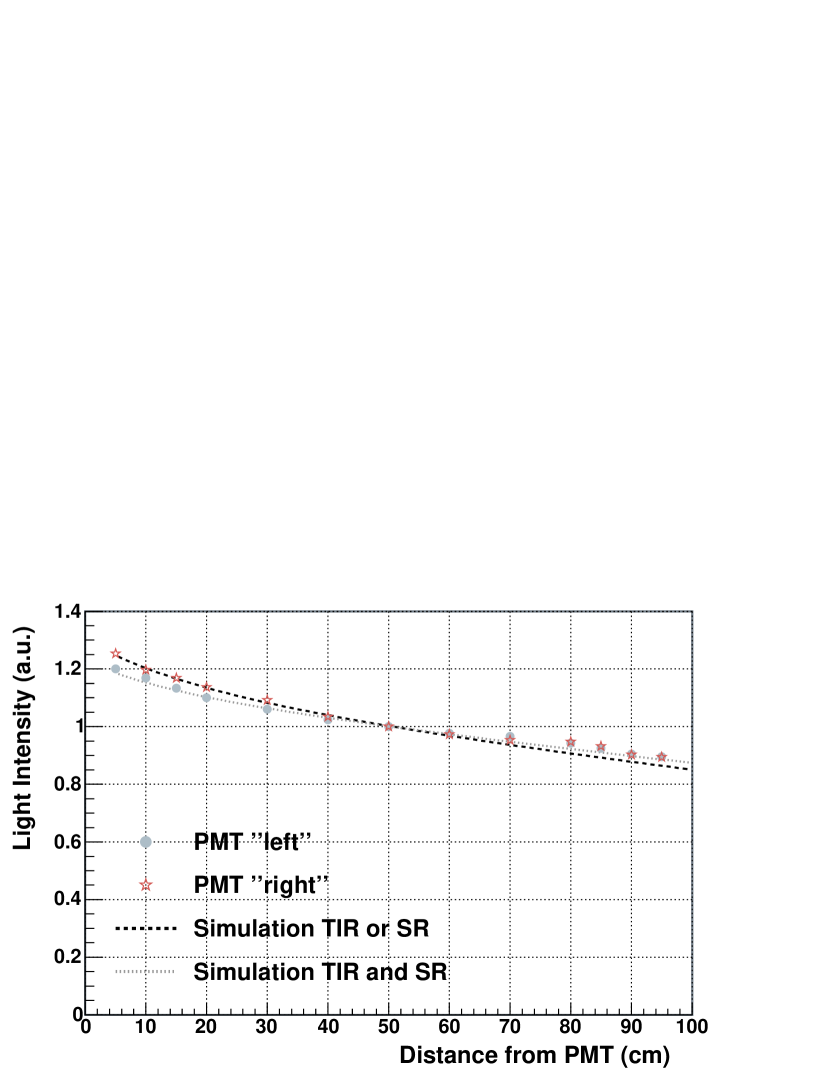
For the cell wrapped with reflective foil, the light attenuation curve could not be measured with the external LED, since the transparency of the VM2000 is very poor. The cell has been irradiated with the collimated 137Cs source and the system operated in simple two-fold coincidence mode, to select all Compton interactions in the cell. The position of the Compton-edge was used to estimate the relative light intensity. The resulting attenuation curves are shown in Fig. 13.
The measurements of the two PMTs are in slight disagreement in the initial part of the curves, probably due to a slow drift of the gain of one PMT. There is however good agreement for .
The predictions of two MC simulations are also reported in the figure. Two limit cases are shown, which are defined “TIR or SR” and “TIR and SR”. In the former, light reflects either via TIR or SR, depending whether or . “TIR and SR” assumes that all the light lost by TIR at has the opportunity to be reflected by the foils. This results in an effective for . Light diffusion at the interfaces is not considered.
We fitted the attenuation curves with a double exponential function:
| (4) |
where is the distance of the closest data point (here ). The fit returns two effective attenuation lengths ( and ), the weights at the reference distance ( and ) and the uncertainties for those parameters. The ratio gives the fraction of the intensity measured by the PMT at that is attenuated with a attenuation length. Most important for this study is the longer attenuation component, , which characterizes light attenuation at a distance from the PMT where geometrical effects and short-range light-loss mechanisms have decayed out.
The analysis of the experimental and simulated curves of Figs. 12 and 13 is given in Table 4. In the case of TIR piping, about of the light detected from distance propagates in the cell with an effective attenuation length of . The simulation predicts similar parameters. This means that the physics of light propagation in the cell is well understood and no light loss mechanisms beside the known ones are present.
For the cell wrapped with VM2000 foil with weight , significantly better than the performance of TIR alone. This result disfavors the “TIR or SR” scenario: for this case, the effective attenuation length should not improve, as the VM2000 would simply pipe light outside the TIR acceptance, however with a lower efficiency than TIR (cf. Eqs. 1 and 2).
The longitudinal scan of the cell response allows calibrating the TDC. The channel-to-position scale is linear with good approximation. From the width of the TDC distributions we deduce that a single LED event originating photo-electrons (estimated from the width of the ADC distribution) can be reconstructed with a spatial resolution of .
6.1.2 CBS measurements
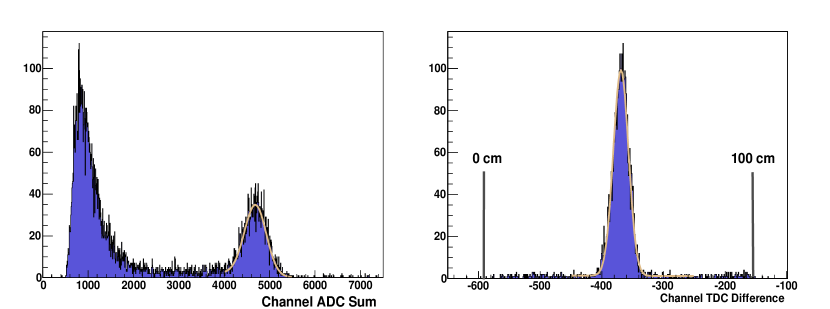
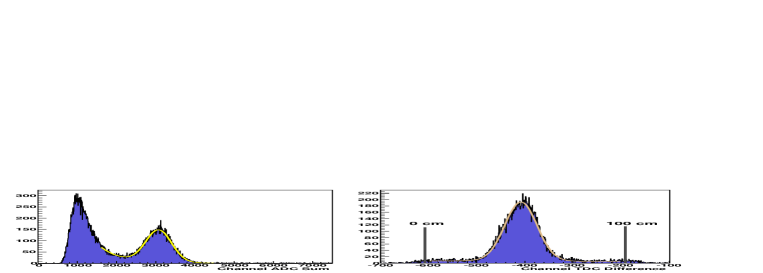
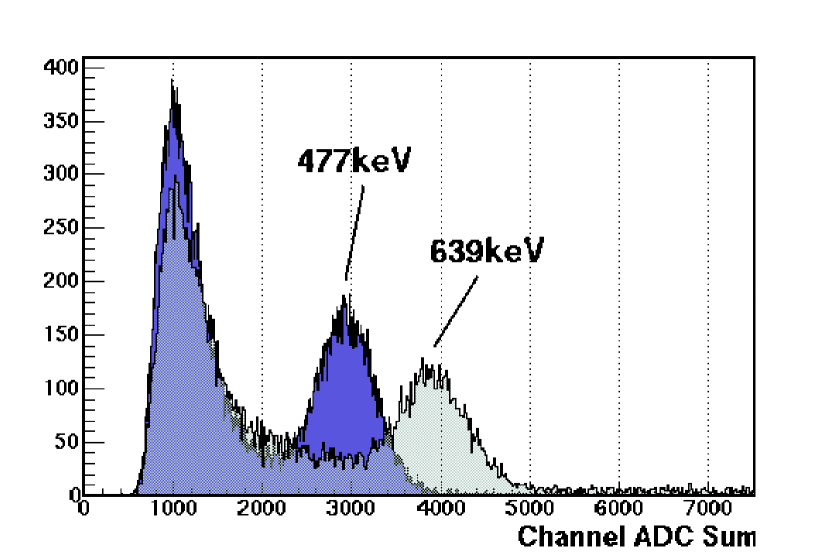
The ADC and TDC spectra of a 137Cs CBS run for the cell wrapped with VM2000 are shown in Fig. 14. The energy spectrum after cuts shows a nearly Gaussian CBS peak, with a modest background contamination on the left side of the peak. The latter is sufficiently small to allow a precise determination of the energy resolution by fitting with a Gaussian plus an asymmetric background. The TDC spectrum obtained by selecting only the events in the CBS energy window has a prominent Gaussian peak corresponding to the source position.
The results of the analysis of ADC and TDC CBS data for both measurements of the PXE sample are reported in Table 5. At 477 keV, the energy resolution is for TIR piping, for mixed TIR/SR piping, nearly constant over the cell length. At the same energy, the spatial resolution is and for the TIR and TIR/SR cells, respectively, source at center; it gets slightly worse at the cell ends.
6.1.3 Photo-electron yield
We will consider first the measurement of the TIR cell. The detector energy resolution gives an indication of the PY. If it is assumed that the width of the CBS peak is dominated by the statistical fluctuations in the average total number of pe, , we find at , source at center. This would translate to pe/MeV. Repeating the calculation for each PMT leads to and .
However, the energy resolution is not expected to be purely statistical. In order to estimate independently the PY, we have calibrated the system by measuring the response to a spe. For this calibration the LED has been used. The light intensity was tuned to a sub-Poisson regime (), so that the probability to measure events with more than one pe is negligible. The trigger was synchronized with the external LED trigger signal and a amplification stage was introduced.
The result of the calibration is: and . The calibration of the “right” PMT is more precise due to a better peak/valley ratio of the spe response.
The estimation of the number of pe based on this calibration is consistent with the energy resolution. Therefore we conclude that in this regime the detector resolution is dominated by the statistical fluctuations of the number of pe.
For the TIR/SR cell, the energy resolutions of the 137Cs and 54Mn CBS lines correspond to a limit and , respectively. The spe calibration gives an average of at , translating to . Therefore energy resolution and spe calibration are also in this case in agreement with each other.
Table 6 summarizes the analysis of the PY based on the CBS measurements and the spe calibration. The results of the MC are also reported. The MC predicts more than twice as much light as measured. This discrepancy must be understood, since the feasibility of an In experiment depends dramatically on the detector energy resolution. This question will be addressed again in Sec. 6.3.
We observe that the use of the VM2000 foil improves the light collection of more than a factor 2. This shows that the foil serves not only to pipe the light outside the TIR acceptance, but also compensates the non ideal geometry of the quartz cell (rounded corners) and other “TIR leakages”. This effect is well described by our model: the MC predicts , depending on the assumed scenario. The experimental value is .
6.2 Indium-loaded cells
The measurements with PXE have shown that the prototype cell works properly and that the VM2000 wrapping increases the PY of a factor of . Consequently this design was also chosen for the indium measurements.
6.2.1 Light attenuation
Due to the lower energy resolution, the Compton edge smears into a shoulder and no clear peak is observed. For this reason, we preferred to perform the scan of the cell with CBS measurements.
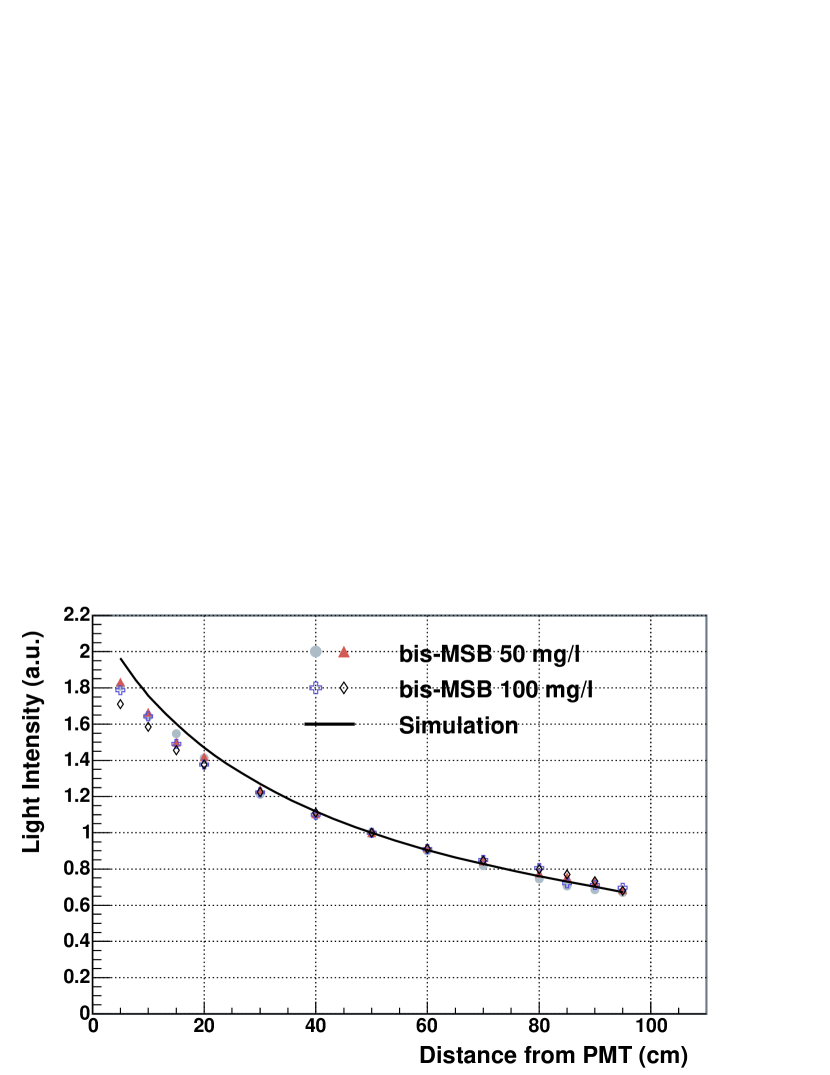
The results for the In-h1 and In-h2 samples are shown in Fig. 15 together with the MC-predicted light attenuation curve. No significant differences are observed in the attenuation of the two samples. The simulation reproduces very well the long-range behavior of the experimental curves, whereas it predicts a slightly faster light attenuation at . This means that this detector performs better than expected at short distance, and as expected at long distance.
The results of the fit of experimental and simulated curves for all In samples are given in Table 7. The high-loading samples give for of the light. The experimental finding that they exhibit very similar attenuation is also predicted by the MC. The longer of the simulations is misleading: it simply results from the smaller weight of the long-range component ( and anti-correlate in the fit). The In-l sample has a slightly better performance, as expected.
6.2.2 CBS measurements
6.2.3 Photo-electron yield
The estimations of the PY are given in Table 9 The values derived from the spe calibrations are in this case significantly higher than those based on the energy resolution, probably because for a low number of pe the departure of the energy resolution from the statistical limit is more important. The light at the cell center is for all In-loaded samples less than 1/3 of PXE. The difference of LY gives a factor and the lower transparency explains the rest. In fact, the MC predicts a similar ratio as observed.
6.2.4 Long-term stability
We have re-measured the optical properties of the prototype cell months after the first campaign (sample In-h2). During this time the cell has been stored in darkness, at room temperature (no temperature control) and exposed to air (sealed in nitrogen atmosphere, however the air-tightness of the module was not tested). The results of light attenuation, energy resolution and PY are presented in Table 10. The results are overall consistent with our first determination (Tables 7, 8 and 9). The large error of the long-range attenuation length is due to the fact that less points have been probed, however for all measured positions the ratio is well consistent with the results of Fig. 15. The energy resolutions of the single PMTs and the spe calibration indicate a slightly higher light output, which we however consider not significant, taking into account the systematic uncertainties related to the re-building of the electronics and the new optical coupling of the PMTs (not included in the quoted errors). We conclude that neither the transparency, nor the LY of the scintillator have degraded during a period of .
6.3 Summary and discussion
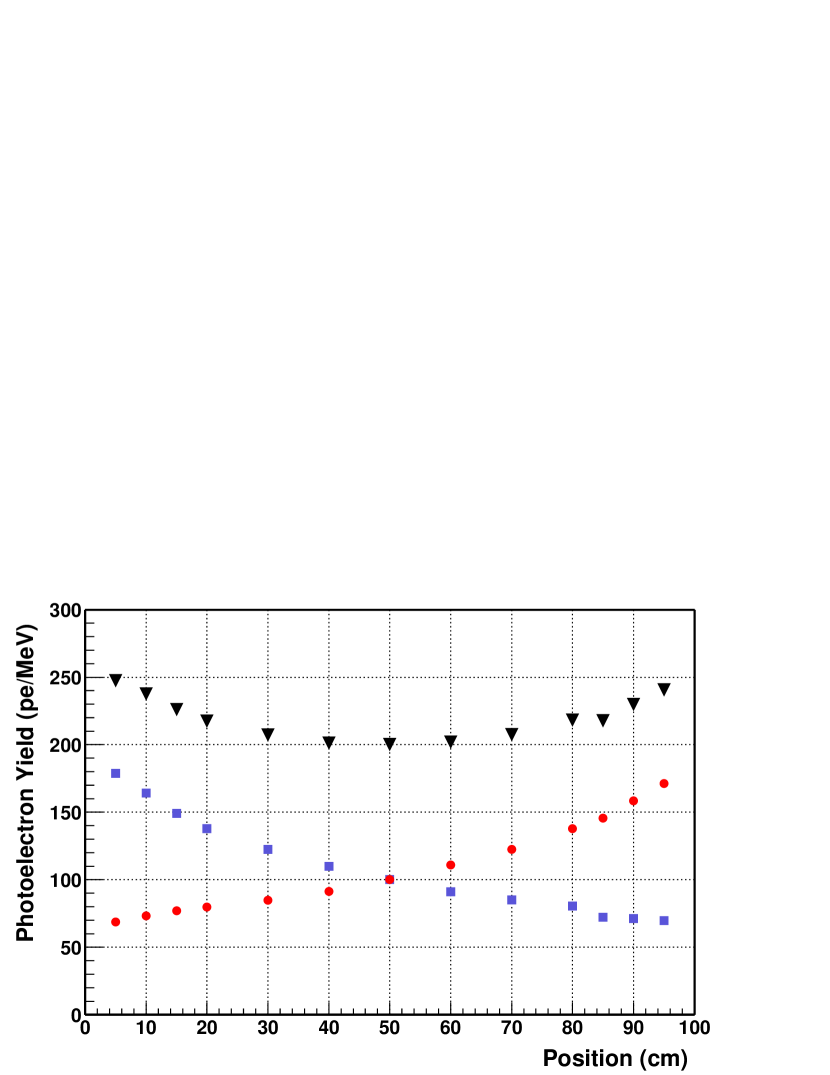
The measurements of PY and light attenuation are brought together in Fig. 17, which shows the absolute detector performance as a function of the source position for the In-h2 sample (which has a similar composition as the sample we filled in the Gran Sasso pilot detector).
In Fig. 18 the CBS spectra of two runs of similar statistics are superimposed, one with the 137Cs source, the other with 54Mn (In-h1 sample). The figure gives an idea of how well the MPIK LENS prototype would energetically resolve an event in the upper range of the -background () from the delayed -tag . The resolution of these two events is the crucial parameter for the feasibility of an In solar neutrino experiment. With the results presented in this paper, at In-loading those two energies are apart, where is given by the sum in quadrature of the standard deviation of the single lines. For example, if a cut is set at the -tag energy minus , the probability that a background event with survives the cut, considering only the deposited energy, is . A detailed Monte Carlo analysis of the signal to noise ratio has been carried out within the LENS collaboration [23]. It has shown that the suppression of the In -Bremsstrahlung background to an adequate level requires an energy resolution at of a factor of better than that reported here.
In Fig. 19 all the measurements of spatial resolution have been displayed as a function of the number of pe. The spatial resolution can be parametrized by a function , where is the number of pe and a constant. The fit gives . The scatter of the data with respect to the fit function is large, however the parametrization gives a useful “rule of thumb” to predict the detector spatial resolution for a wide range of cases with better than precision.
The last column of Tables 6 and 9 reminds us that more than a factor 2 of light is missing according to the MC predictions. The fact that the simulations reproduce reasonably well the experimental light attenuation curves demonstrates that the discrepancy in the PY is not related to light losses “on the way” to the PMTs. This is supported by the observation that the experimental deficit relative to the MC is roughly constant. It is possible that the PMTs utilized have an effective photocathode coverage smaller than the specification, or that the PMTs are less sensitive in a broad outer photocathode area, compared to the center. This explanation is corroborated by the results of the LNGS-INR group of the LENS collaboration, which has measured at Gran Sasso an identical quartz prototype cell filled with an In hydroxy-carboxylate scintillator [13]. They have used PMTs, which ensure full coverage of the cell ends. Their reported results [25] are in agreement with our MC expectations.
7 Conclusions and outlook
In this paper we have described the work carried out at MPIK to design, model, build and characterize a prototype cell of an indium solar neutrino detector filled with a novel In-loaded scintillator developed by us (In-acac).
As a first step toward the validation of the experimental concept, we have experimentally demonstrated that light-piping via total internal reflection on quartz and specular reflection by 3M-VM2000 mirror foil is adequate for a fine segmented detector.
We have then predicted by Monte Carlo the expected optical performances of an In-acac cell as a function of the scintillator composition, in order to optimize the formulation at any given indium concentration.
After this preparatory phase, we have set up a prototype cell and a system to measure the detector optical performances. A benchmark PXE-based scintillator has shown an effective long-range attenuation length of and a photo-electron yield of . These results give the experimental upper limit of the potential of an In-based solar neutrino detector in the considered implementation.
Subsequently, three different In-loaded samples have been measured. At an indium concentration of , the energy resolutions was and the spatial resolution , both for recoil electrons. The long-range attenuation length in the cell was and the photo-electron yield .
For all samples, the measured light attenuation was in good agreement with the prediction of our MC simulation, and the light output as well, after normalization by an experimental quality factor of . This means that we can reliably predict the performance of this detector for any choice of the scintillator composition.
For our base-case In-loading of , we found that the energy separation between the In end-point and the -signature is of the order of . According to Monte Carlo studies of the full-scale detector, this is not yet sufficient to guarantee an adequate signal/background ratio. However, we believe that there is still room to increase the light output by simply improving the match of the PMT surface to the cell end. Unfortunately, the attenuation length we measured (which is fluor-dominated) would limit the length of the unitary cell to .
The long-term stability of any metal-loaded scintillator is one of the crucial issues for the feasibility of a neutrino detector. We have demonstrated the our system is stable and robust. This scintillator did not show any degradation of its optical performance for a period of , in spite of the very high indium concentration and storage in an unprotected environment. This result is of great interest not only for a solar neutrino detector, but also for loading of Gd in a novel liquid scintillator, to use in upcoming reactor anti-neutrino detectors [26].
A prototype cell filled with a scintillator similar to the In-h2 sample reported here has been installed in the LLBF, as a part of the LENS pilot experiment at Gran Sasso [8]. The background above the 115In end-point was measured and the rate resulted only of a factor of higher than in high-purity benchmark PXE cells.
Acknowledgments
We would like to thank the technical support of our mechanical and glassblowing workshops, especially F. Kleinbongardt, P. Mögel and E. Borger for their help in the realization of the light piping measurements and of the prototype set-up. The contribution of notable amounts of BPO fluor from our Russian colleagues, Dr. Leonid Bezrukov and group is acknowledged. We also thank all the members of the LENS collaboration for stimulating and helpful discussions. C. Buck thanks the Graduiertenkolleg, Ruprecht-Karls-Universität Heidelberg, for fellowship support.

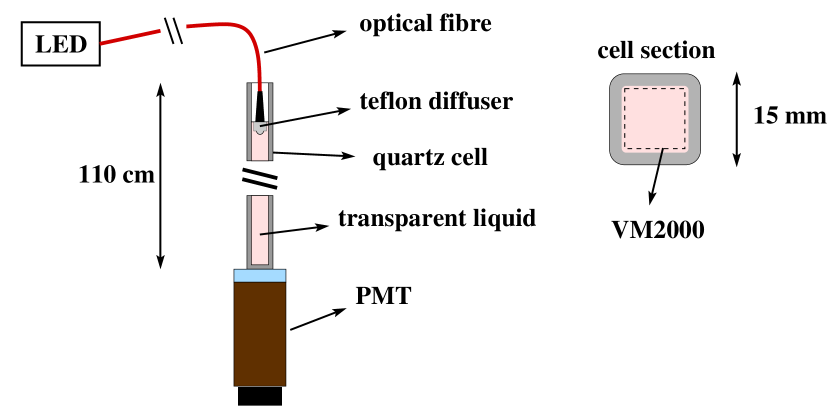
Right: section of the cell. All shown geometrical features are implemented in the MC simulations.
Left: distribution of the total charge, calculated by summing the ADC values of the two PMTs.
Right: distribution of the time difference between the two PMTs for the events around the CBS peak. The TDC signals corresponding to the ends of the cell are indicated by the two vertical segments.
Left: distribution of the total charge, calculated by summing the ADC values of the two PMTs.
Right: distribution of the time difference between the two PMTs. The TDC signals corresponding to the ends of the cell are indicated by the two vertical segments.

| Anisol | In(acac)3 | BPO | bis-MSB | Quartz | |
|---|---|---|---|---|---|
| Name | solvent | In | Fluor | WLS | LY |
|---|---|---|---|---|---|
| (g/l) | (g/l) | (mg/l) | (%) | ||
| PXE | PXE | 0 | 2 | 20 | 83 |
| In-l | anisol | 20 | 27 | 50 | 44 |
| In-h1 | anisol | 44 | 47 | 50 | 42 |
| In-h2 | anisol | 44 | 47 | 100 | 42 |
| (nm) | 380 | 400 | 410 | 420 | 430 | 440 | 450 | 500 | |
|---|---|---|---|---|---|---|---|---|---|
| (cm) | PXE | 0.25 | 5.2 | 78 | |||||
| (cm) | In-l | 0.09 | 0.99 | 13 | 76 | ||||
| (cm) | In-h1 | 0.08 | 0.93 | 12 | 55 | 88 | |||
| (cm) | In-h2 | 0.05 | 0.50 | 6.6 | 43 | 83 |
| source | piping | |||
| cm | cm | |||
| LED | TIR | |||
| 137Cs | TIR | |||
| MC | TIR | |||
| 137Cs | TIR/SR | |||
| MC | TIR/SR† | |||
| MC | TIR/SR§ |
| En | piping | x | ||||
|---|---|---|---|---|---|---|
| (keV) | (cm) | (%) | (%) | (%) | (cm) | |
| 477 | TIR | 10 | ||||
| 477 | TIR | 30 | ||||
| 477 | TIR | 50 | ||||
| 477 | TIR | 70 | ||||
| 477 | TIR/SR | 10 | ||||
| 477 | TIR/SR | 30 | ||||
| 477 | TIR/SR | 50 | ||||
| 639 | TIR/SR | 50 |
| piping | resolution | calibration | MC | |
|---|---|---|---|---|
| (pe/MeV) | (pe/MeV) | (pe/MeV) | MC | |
| TIR | ||||
| TIR/SR |
| (cm) | (cm) | ||
| In-l | |||
| In-h1 | |||
| In-h2 | |||
| MC In-l | |||
| MC In-h1 | |||
| MC In-h2 |
| Sample | En | ||||
|---|---|---|---|---|---|
| (keV) | (%) | (%) | (%) | (cm) | |
| In-l | 477 | ||||
| In-h1 | 477 | ||||
| In-h1 | 639 | ||||
| In-h2 | 477 |
| Sample | resolution | calibration | MC | |
|---|---|---|---|---|
| (pe/MeV) | (pe/MeV) | (pe/MeV) | MC | |
| In-l | ||||
| In-h1 | ||||
| In-h2 |
| Date | calibration | |||||||
|---|---|---|---|---|---|---|---|---|
| (cm) | (cm) | (%) | (%) | (%) | (cm) | (pe/MeV) | ||
| Oct 04 | ||||||||
| Aug 03 |
References
- [1] R.S. Raghavan, Phys. Rev. Lett., 37 (1976), 259
- [2] L. Pfeiffer, A.P. Mills, R.S. Raghavan, E.A. Chandross, Phys. Rev. Lett., 41 (1978), 63
- [3] A.G.D. Payne, N.E. Booth, Nucl. Instr. Meth. A, 288 (1990), 632
- [4] Y. Suzuki, K. Inoue, Y. Nagashima, S. Hashimoto, T. Inagaki, Nucl. Instr. Meth. A, 293 (1990), 615
- [5] F.X. Hartmann and S. Schönert, reported by F. von Feilitzsch, Proceedings of the 5th Int. Top. Workshop at LNGS on Solar Neutrinos, edited by V. Berezinsky and F. Vissani (03/2001), 388
- [6] R.S. Raghavan, hep-ex/0106054 (2001)
- [7] C. Buck, et al., Nucl. Phys. B (Proc. Suppl.), 118 (2003), 450
- [8] I. Barabanov, et al., proceedings of the XXI International Conference on Neutrino Physics and Astrophysics “Neutrino 2004”, to appear in Nucl. Phys. B (Proc. Suppl.).
- [9] D. Motta et al., Nucl. Phys. B (Proc. Suppl.), 118 (2003), 451
- [10] C. Buck, F.X. Hartmann, S. Schönert, U. Schwan, J. Radioan. Nucl. Chem., 258 (2003), 255
- [11] C. Buck, F.X. Hartmann, T. Lasserre, D. Motta, S. Schönert, U. Schwan, J. Luminesc., 106 (2004), 57
- [12] C. Buck, F.X. Hartmann, T. Lasserre, D. Motta, S. Schönert, U. Schwan, in preparation for submission to Chem. Phys. Lett.
- [13] C. Cattadori, et al., LNGS/EXP-06/04-September 2004, submitted to Radiation Chemistry and Physics, and C. Cattadori, et al., LNGS/EXP-07/04-September 2004, submitted to Radiation Chemistry and Physics.
- [14] F.X Hartmann, C. Buck, T. Lasserre, D. Motta, S. Schönert, U. Schwan, in preparation for submission to Nucl. Instr. Meth. A
- [15] D. Motta, Feasibility Analysis and Prototype Measurements of a Novel Approach for the Real-Time Spectroscopy of Low Energy Solar Neutrinos, Dissertation, University of Heidelberg (2004)
- [16] M.F. Weber et al., Science Vol., 287 (2000), 2451
- [17] K. Bernlöhr, et al., Astropart. Phys., 20 (2003) 111
- [18] C. Buck, Development of Metal-Loaded Liquid Scintillators for Future Detectors to Investigate Neutrino Properties, Dissertation, Universität Heidelberg, 2004
- [19] I.B. Berlman, Handbook of fluorescence spectra of aromatic molecules, Second edition, Academic Press, New York, 1971
- [20] D. Motta, S. Schönert, Nucl. Instr. Meth. A, in press (physics/0408075)
- [21] H.O. Back, et al. (Borexino collaboration), submitted to Nucl. Instr. Meth. A, physics/0408032
- [22] Borexino collaboration (G. Alimonti et al.), Astrop. Phys., 16 (2002), 205
- [23] J-P. Meyer, LENS internal note, 2003
- [24] F. Elisei, et al., Nucl. Instr. Meth. A, 400 (1997), 53
- [25] C.M. Cattadori et al., LENS internal communication, 2003
- [26] F. Ardellier, et al., Letter of Intent for Double-CHOOZ: a Search for the Mixing Angle Theta13, hep-ex/0405032