Superfluidity of Dense 4He in Vycor
Abstract
We calculate properties of a model of 4He in Vycor using the Path Integral Monte Carlo method. We find that 4He forms a distinct layered structure with a highly localized first layer, a disordered second layer with some atoms delocalized and able to give rise to the observed superfluid response, and higher layers nearly perfect crystals. The addition of a single 3He atom was enough to bring down the total superfluidity by blocking the exchange in the second layer. Our results are consistent with the persistent liquid layer model to explain the observations. Such a model may be relevant to the experiments on bulk solid 4He, if there is a fine network of grain boundaries in those systems.
pacs:
PACS: 05.30.Lq, 71.10.+x, 64.30.+t, 02.70.LqThere is a long history of experiments of helium absorbed in porous media carried out to probe the response of superfluidity to disorder reppy . Recently, Kim and Chan reported the observation of a supersolid Helium phase, in porous Vycor chan1 and in bulk solid 4He chan2 . A supersolid al-leg-chest is a proposed phase of a quantum system in which long-range crystalline order and superfluidity coexist. We focus here on the measurements of the Helium-Vycor system.
The occurrence of supersolid behavior in Vycor, a disordered porous glass, could be understood from the properties of Vycor. One explanation is that the complex Vycor geometry stabilizes mobile defects which then undergoe BEC at low temperatures 0.2K. However, since the phenomenon is observed in bulk solid 4He it is not the Vycor pores that are essential. Although, Kim and Chan pressurized their cell to 60 Bars, substantially above the estimated freezing pressure for helium in Vycor of 40 bars, even if most of the helium is solid, it is not clear if there remains a liquid film (the persistent liquid layer or PLL) near the Vycor-helium surface. The film could arise from the mismatch of lattice parameters as the density of 4He varies from the center of the pores to their surface.
Even though there have been many experimental studies of helium in Vycor, there have been few microscopic calculations of the detailed microscopic structure of this system. Here we report on a model of the helium-Vycor system and calculate its properties with the Path Integral Monte Carlo(PIMC) method pimc . PIMC can calculate exact thermodynamic properties of bosonic systems such as 4He at non-zero temperature by sampling the thermal density matrix , with and the Hamiltonian. An explicit expression for the density matrix is obtained by expanding into a path and approximating the higher temperature density matrices. Bose statistics are obtained by symmetrizing the density matrix . PIMC proved accurate in studying properties in the normal liquid, superfluid and crystal phase pimc . In contrast to methods based on trial wavefunctions, in PIMC only the Hamiltonian enters, so no biases are made on the structure of the many-body system.
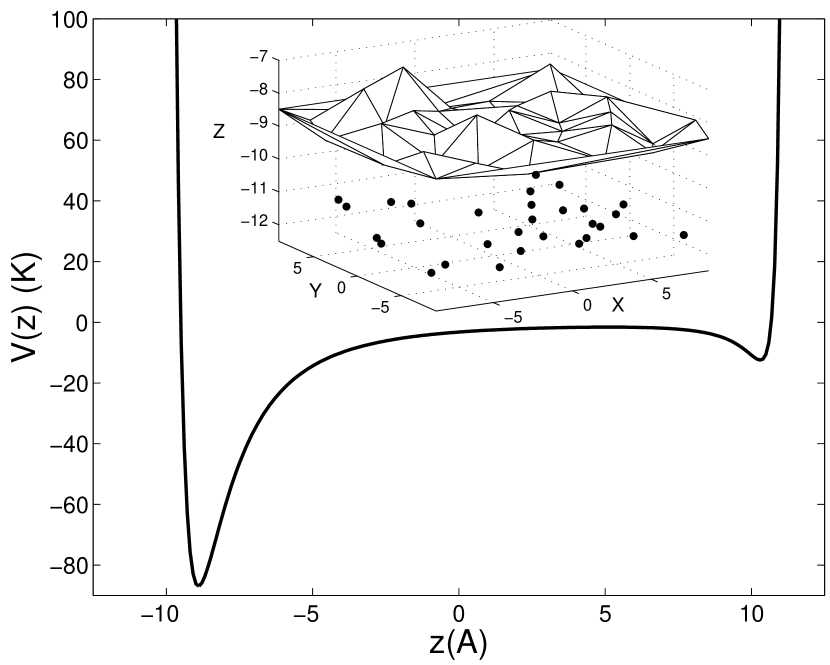
Vycor’s complex geometry is difficult to simulate directly. Under the transmission electron microscope, Vycor shows interconnected pores with diameters between 60Å and 80Å and a length of 300Å, with a narrow distribution of pore sizes. Current simulation techniques treating all the atoms with PIMC are unable to simulate even a single pore (containing roughly 30000 atoms). It is thought that above the freezing pressure (40 bars) a 4He crystal will occupy the center of a pore brewer . Previous PIMC calculations have found that a perfect crystal will not have a superfluid response at long wavelength C181 . Making this assumption, we study only the region near the surface of a pore and model it with the slab geometry: our simulation cell is periodic in both the x and y directions. In the negative z-direction there is a wall, representing bulk Vycor on top of which are placed Vycor “particles” in random positions 1 Å above the flat Vycor surface. These particles serve to make the surface rough and break translational invariance. In the positive z-direction is a wall which models bulk solid Helium at a pressure of 62 bars(see Fig. 1) .
The main input to PIMC is the interaction potential between various particles. We assume that the Helium-Helium interaction is given by the Aziz aziz potential which has been used within PIMC to study numerous other properties of helium and gives energies accurate to about 1% of the bulk binding energy. The potential between helium and the upper wall was derived by integrating an approximate LJ 6-12 potential ( and ) over the volume (cell 1) resulting in a LJ (3-9) potential.
We also assume helium-Vycor surface interaction is a LJ (3-9) potential pot : . Since Vycor glass, SiO2, should behave similarly to MgO Vycorpot , we pick the well depth to be , and the range of the attraction, . In order to pin the helium crystal in the xy plane and model the roughness of the Vycor, we add Vycor “particles” in random positions 1 Å above the wall. The interaction between the helium atoms and the Vycor particles is determined by demanding that a complete layer of the particles give the same LJ (3-9)potential. Experiments levitz show that the roughness in Vycor is on the scale of 0.8nm, not very different from what we have assumed. Figure 1 shows the wall potential and the surface roughness.
We set the helium density to match the experimental conditions by adjusting the number of helium atoms and the total area in the xy plane so that the helium density in the topmost layer matches that of solid 4He at a target pressure close to 62 bars. We start the simulation with 221 atoms placed in 7 layers in an hexagonal closed packed solid phase. Each layer contains 30 atoms except for the first layer placed at the strongly attractive Vycor wall potential (Fig. 1). We have performed extensive simulations with two geometries, denoted as Cell 1 (221 He atoms with a box Å) and Cell 2 (221 atoms with a box Å). Cell 1 is roughly stress free, while Cell 2 provides us with a way to look at the model under anisotropic stress.
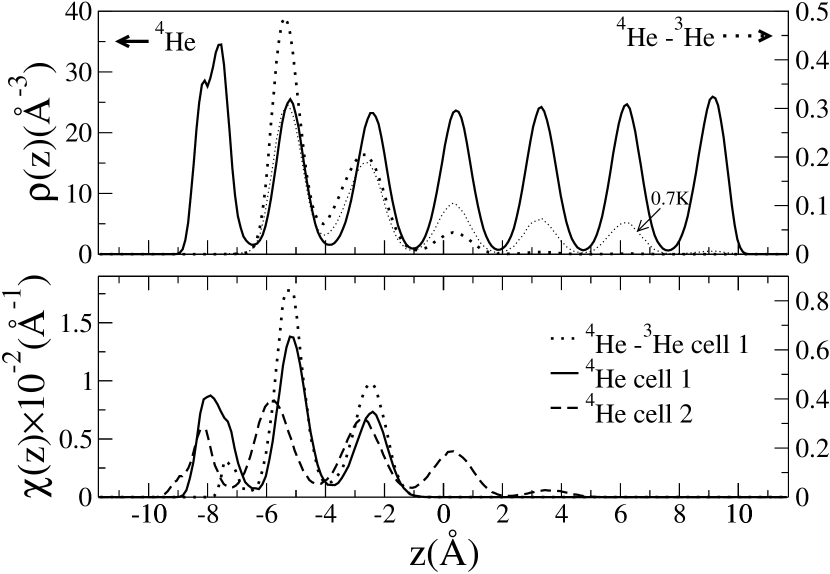
The density in the z-direction (see Fig. 2) shows a distinct layered structure of 4He. The density increases as we approach the Vycor wall because of the stronger attraction of the potential well. The Vycor particles distort the shape of the density peak in the first layer because there are binding sites at different values of . We find a perfect crystal is stable in the upper portion of the cell with a lattice constant of 3.55 Å in cell 1 and 3.45 Å in cell 2, at the target pressure of 62 bars. We estimate the pressure by calculating the density per layer from fig. 2 and comparing it with the experimental equation of state state .
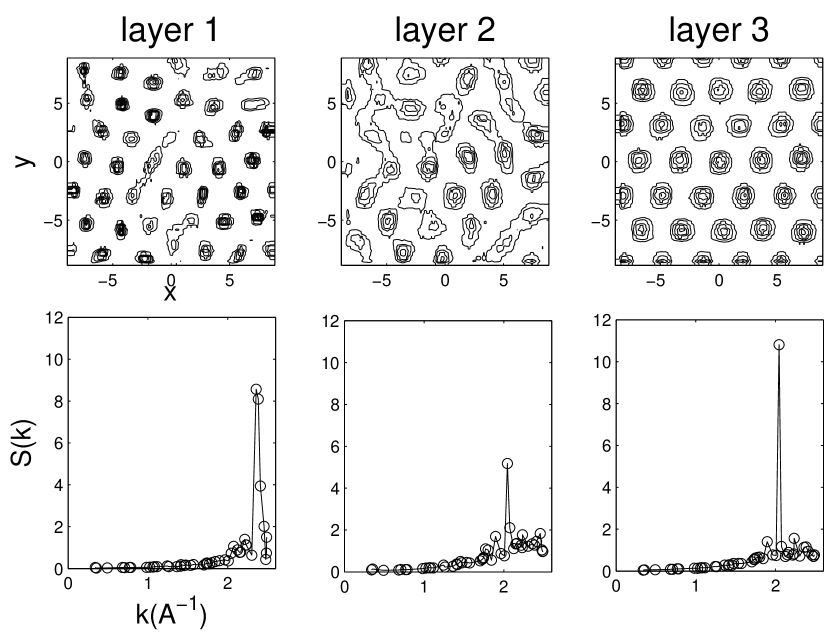
We determine the spatial ordering within a layer with the structure factor in the x-y direction
| (1) |
where is the Fourier transform of the density within layer and . We can see the signature of a solid from the peak of around =2.04Å-1 as shown in fig. 3 for cell 1; the peak clearly shows an hexagonal structure for layers three and above. The density profiles within a layer at the top of the figure confirm this interpretation. However, not all of the layers are solid. In fact, layer 1 is solid-like with the helium atoms well-localized but with their mean positions determined by the underlying disorder. Layer 2 is more disordered, and the atoms are out of register with the first layer. Because the second layer density is lower, the atoms are much less localized and, as we shall see, are able to become superfluid. Layers three and above are quantum solids, mostly free of defects. This is relatively independent of pressure, because of the strong Vycor potential shown in Fig. (1). We note that recent neutron scattering experiments wallacher support the co-existence of solid-like and liquid-like layers at these pressures.
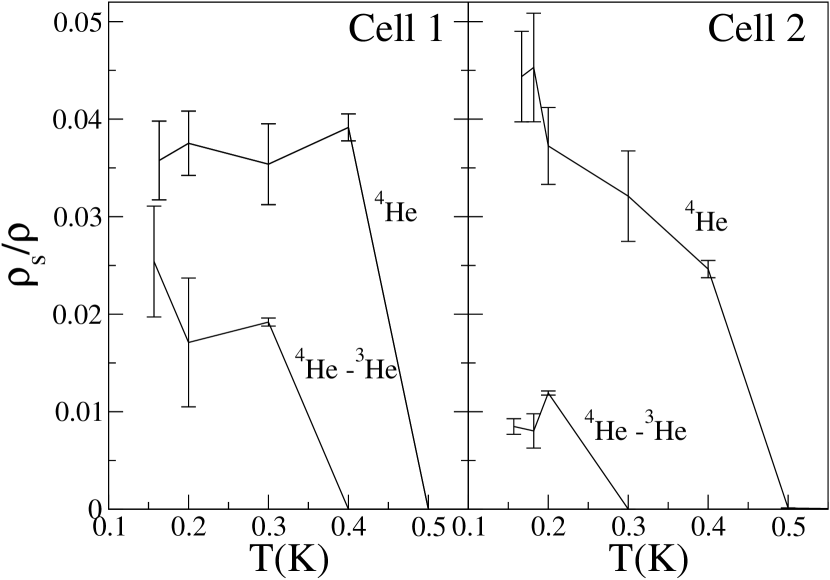
The superfluid fraction is computed in PIMC from the mean squared winding number pimc4 , where is the number of Helium atoms and ; the sum is over particles , and time slices . The superfluid fraction increases as we lower the temperature as shown in fig. 4 and approaches values of about 4% below 0.3 K.
To find the spatial distribution of the superfluid density, we divide the winding number estimator into local contributions that sum to the total superfluid density eric . The superfluid density as a function of the distance above the Vycor wall is:
| (2) |
In fig. 2, we show for T=0.2K in cell 1. One can see the layered structure of the density. Layer 2 has the largest superfluid component. Layer one contributes because some atoms sit close to layer 2. Layer 3 is also active. The superfluid response goes to zero above layer 3. However, this decay is slower in cell 2 where the two additional layers (4 and 5) still contribute to .
To compare with experiment we must make two corrections; first that our model has a larger fraction of atoms near the Vycor surface than experiment, and second that our cell has no tortuosity: the experimental path length for a superflow is greater than the straight line distance. We correct for the difference in Vycor surface area by assuming that the superfluidity is confined to a finite distance above the Vycor so that the effective number of atoms that do not respond to the moving boundaries is: where is the Vycor surface area (actually the surface area of the mobile layer). We find that the maximum number of superfluid atoms per unit area is: . Then for a Vycor sample with experimental surface area per unit volume of the relative superfluid response would be where is the experimental Vycor sample pore fraction, is the tortuosity, and is the solid number density. Using the experimental parameters of Vycor, we would predict a measured superfluid fraction of . In fact, Kim and Chan measure a value two times smaller than this. One important effect missing in our calculation is that the supercurrents must tunnel through various weak links, an aspect not present in our calculations because of the limited extent of the cell in the x-y directions. In addition, we have not taken the thermodynamic limit, though it is not obvious how to do this without a better model of the Vycor. We also note that the model is lacking important aspects of disorder, for example, that induced by the curvature of the pore and possible grain boundaries between the pores. Given these uncertainties, Kim and Chan’s measured values are well within the range expected from our calculations.
Recent experiments day do not find any indication that the liquid layer can flow in response to a pressure gradient. It is possible that there is an “insulating” (e.g. defect-free, see below)layer of solid 4He which forms at the surface of the Vycor samples and blocks the superflow.
Kim and Chan also studied the effect of 3He impurities on the measurement of the superfluid density. Accordingly, we replaced a single 4He with a 3He atom. (Note that we do not need to consider fermi statistics for a single fermion). This corresponds to roughly 0.3% concentration of 3He (assuming our cell size is of the pore). Experimentally, this concentration was enough to destroy any “supersolid” response. With local moves the system was slow to reach equilibrium: we used a move that swapped the identity of the impurity with a random 4He atom. PIMC with the new procedure quickly reached equilibrium.
The impurity, being lighter than 4He, has a larger kinetic energy and hence a larger atomic volume. This extra space is available in the second liquid-like layer. Also, the 3He atom does not exchange with the 4He and thus reduces the superfluid density in its neighborhood. The density profiles show that the 3He impurity preferentially goes to the same site where the superfluidity is maximized (Fig. 2). At higher temperatures, it tunnels to other layers with an excitation energy of 0.8K. As the temperature is lowered, two competing effects take place. The 4He atoms nearest to the Vycor surface exchange resulting in superfluidity. However, the 3He atom migrates towards the most superfluid layers, hence reducing the superfluid response and a shift towards a lower transition temperature, see fig. 4. It is plausible that in a larger cell, an even smaller concentration of 3He could pinch off the winding exchanges (or supercurrent) by going to choke positions not present in our small cell, thus giving better agreement with the experimental findings of a critical 3He concentration of 0.1%.
Kim and Chan chan1 mention two pieces of evidence to argue against the liquid film interpretation. First, the observed temperature dependance of the superfluid density is unlike that of films. However, the films under pressure are totally enclosed within a solid and they are not like films forming an interface between a solid and a vacuum; as we have seen, there are low energy excitations giving rise to pronounced temperature effects, not present in the later case. Also, the connectivity whether primarily 2D or 3D, of these solid-enclosed films could be different; it is likely that they are gossamery, as opposed to the robust films resulting when the pores are only partially filled. The second effect mentioned by Kim and Chan is the poisoning by small amounts of 3He. This does not happen in free films because the 3He atom is above the plane of the 4He film in a delocalized state and thus is not effective in preventing 4He exchanges.
The liquid-layer scenario can be used to give insight into the other porous media and bulk helium experiments. Let us assume that the observed superfluidity is due to surface superfluidity as proposed by Burovski at al. burovski and that the helium microcrystals are roughly spherical with a diameter of , giving a surface to volume ratio of . Arguing as before, to obtain the observed 2% superfluid response of bulk 4He, we must have that where is the superfluid density per unit area at the crystal interfaces. It is reasonable to expect that is considerably larger than at the interface between helium and Vycor, since the pressure exerted by the silica increases the density and hence decreases the mobility of the helium atoms. Let us assume that there are 2 complete superfluid layers at the interface giving . Given that the grain boundaries are larger and less fractal, we might expect that . Using the experimental for bulk 4He, we find the average grain size, . It is quite likely that 3He will stabilize the grain boundaries, thus explaining how such a small concentration of 3He can affect the response. Such speculation need to be confirmed by performing experiments on much better crystals and measuring the density and the sizes of grains.
Our results show superfluidity is localized in specific layers of 4He above a Vycor surface. We obtain a superfluid response about 2 times what is observed, but the difference is likely due to the very small simulation cells we used that do not have the full range of the random disorder and crystal defects. We also found that 3He impurities gravitate to the same spatial locations as the superfluid density, thus poisoning the effect. Based on these simulations, the persistent liquid layer interpretation of the Kim-Chan experiment seems not to be ruled out. Further studies with larger cells and more realistic disorder are needed to firm up these conclusions and to see if this mechanism, when involving grain boundaries, could give rise to the phenomena in bulk solid helium.
Thanks for assistance from J. Kim, M. Chan and M. Cole. This work was supported by NSF and the fundamental physics program at NASA (NAG-8-1760). Computer time has been provided by NCSA and the F. Seitz Materials Research Lab. (US DOE DEFG02-91ER45439 and NSF DMR-03 25939 ITR), at the U. of Illinois Urbana-Champaign.
References
- (1) M. H. W. Chan, A. W. Yanof, and J. D. Reppy, Phys. Rev. Letts. 32 1347 (1974).
- (2) E. Kim and M. H. Chan, Nature 427, 225 (2004).
- (3) E. Kim and M. H. Chan, Science 305, 1941 (2004).
- (4) A. F. Andreev and I. M. Lifshitz, Sov. Phys. JETP 29, 1107 (1969); A. J. Leggett, Phys. Rev. Lett. 25, 1543 (1970); G. V. Chester, Phys. Rev. A 2, 256 (1970).
- (5) D. M. Ceperley, Rev. Mod. Phy. 67, 279 (1995).
- (6) D. F. Brewer, J. Rajendra, N. Sharma, A. L.Thomson and Jin Xin, Physica B 165 & 166, 551 (1990).
- (7) D. M. Ceperley and B. Bernu, Phys. Rev. Letts. 93, 155303 (2004).
- (8) R. A. Aziz, Alec R. Janzen and M. R. Moldover, Phys. Rev. Lett. 74, 1586 (1995).
- (9) M. W. Cole, T. T. Tsong, Surf. Sci. 69, 325-35 (1977).
- (10) C. H. Anderson and E. S. Sabisky, Phys. Rev. Lett. 24, 1049 (1970).
- (11) P. Levitz, G. Ehrest, S. K. Sinha and J. M. Drake, J. Chem. Phys. 95, 6151 (1991).
- (12) A. Driessen, E. van der Poll and I. F. Silvera, Phys. Rev. B 33, 3269 (1986).
- (13) E. L. Pollock and D. M. Ceperley, Phy. Rev. B. 36, 8343 (1987).
- (14) D. Wallacher, M. Rheinstaedter, T. Hansen and K. Knorr, J. Low. Temp. Phys. 138, 1013 (2005).
- (15) E. W. Draeger and D. M. Ceperley, Phys. Rev. Lett. 90, 65301 (2003).
- (16) J. Day, T. Herman, and J. Beamish, Phys. Rev. Letts. 95 035301 (2005).
- (17) E. Burovski, E. Kozik, A. Kuklov, N. Prokofev and B. Svistunov, Phys. Rev. Letts. 94, 165301 (2005).