Development and operation of a pixel segmented liquid-filled linear array for radiotherapy quality assurance
Abstract
A liquid isooctane (C8H18) filled ionization linear array for radiotherapy quality assurance has been designed, built and tested. The detector consists of 128 pixels, each of them with an area of 1.7 mm 1.7 mm and a gap of 0.5 mm. The small pixel size makes the detector ideal for high gradient beam profiles like those present in Intensity Modulated Radiation Therapy (IMRT) and radiosurgery. As read-out electronics we use the X-Ray Data Acquisition System (XDAS) with the Xchip developed by the CCLRC.
Studies concerning the collection efficiency dependence on the polarization voltage and on the dose rate have been made in order to optimize the device operation. In the first tests we have studied dose rate and energy dependences, and signal reproducibility. Dose rate dependence was found lower than 2.5 % up to 5 Gy min-1, and energy dependence lower than 2.1 % up to 20 cm depth in solid water. Output factors and penumbras for several rectangular fields have been measured with the linear array and were compared with the results obtained with a 0.125 cm3 air ionization chamber and radiographic film, respectively. Finally, we have acquired profiles for an IMRT field and for a virtual wedge. These profiles have also been compared with radiographic film measurements. All the comparisons show a good correspondence. Signal reproducibility was within a 2% during the test period (around three months). The device has proved its capability to verify on-line therapy beams with good spatial resolution and signal to noise ratio.
1 Introduction
Nowadays the verification of radiotherapy treatments in most of the hospitals is performed through air or solid state ionization chambers. These chambers are mechanically displaced to obtain beam profiles. IMRT techniques require detectors able to verify and to monitor the clinical beams with high spatial resolution and fast response. Furthermore, the dose rate at any point must be integrated over the entire exposure, limiting the use of typical ionization chambers. IMRT verification with radiographic films (RGFs), radio-chromic films (RCFs) or electronic portal imaging devices (EPIDs) provide a high spatial resolution. However, RGFs need a chemical processing and over-respond to low energy scattered photons (Sykes et al1999, Martens et al2002), RCFs present response non-uniformity (Niroomand-Rad et al1998) and calibration of EPIDs is a difficult task, which complicates high precision dosimetry with all of these devices. Segmented anode ionization chambers, like those presented in Martens et al(2001), Belletti et al(2001) and Eberle et al(2003), and diode arrays (Jursinic and Nelms 2003) are an alternative. Although faster verification procedures are possible with these devices, none of them achieve a millimeter range spatial resolution.
In this paper we present the design, the operation principles and the first tests of a 128 pixel linear array whose aim is to obtain a profile in a single beam shot with enough resolution to make mechanical displacement unnecessary. Each pixel has an area of 1.7 mm 1.7 mm. The active medium is a 0.5 mm thick isooctane layer, which is encapsulated between two printed circuit boards. We used a standard liquid isooctane from Merk111Merk Uvasol quality grade isooctane, with a purity 99.8%. No further purification, in order to obtain an ultra-pure liquid, has been made. Non polar liquids are becoming and alternative to air and solid state semiconductors in radiotherapy detectors due to their tissue equivalent behavior, their sensitivity and their small directional dependence. Liquid filled ionization chambers are currently used in radiotherapy both for dosimetry, as shown by Wickman and Nyström (1992) and Wickman et al(1998), and portal imaging as in the device of van Herk and Meertens (1988). One of the most commonly used liquids is isooctane (2,2,4 trimethylpentane). This non-polar liquid has a quite constant stopping power ratio to water in a very wide energy spectrum (less than 3% variation from 0.1 MeV to 20 MeV) and also its intrinsic mass density allows to achieve a spatial resolution in the millimeter range for therapy beams.
2 Detector description
2.1 Detector design
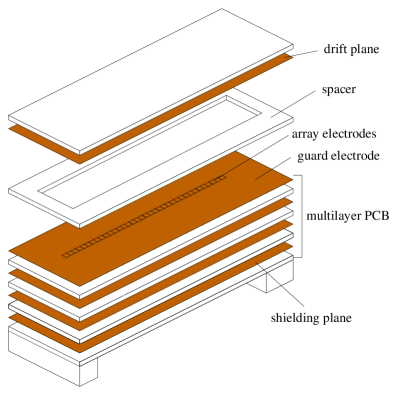
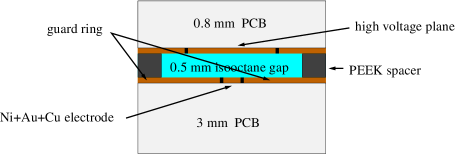
The linear array has been constructed using two printed circuit boards (PCB) that surround a 0.5 mm thick isooctane layer. The isooctane gap is provided by a PEEK222Poly Ether Ether Ketone spacer. The chamber walls were fabricated using FR4 fiber glass epoxy. The upstream wall has a 0.8 mm thickness and contains the high voltage plane. The downstream one is a four layer PCB with a 3 mm thickness. The top layer contains the Cu+Ni+Au anode segmented in 128 pixels. Each electrode has an area of 1.5 mm 1.5 mm and is surrounded by a guard electrode biased to +2 V. The pitch is 1.7 mm, and so the linear array consists of 128 cells of 1.7 mm 1.7 mm 0.5 mm giving a total active length of 21.6 cm. The internal layers contain metallic strips that carry out the ionizing charge produced in the liquid to one of the device sides, where the detector is connected to the read-out electronics. In the bottom layer was deposited a 35 m thick Cu clad to shield the strips from external noise. The high voltage electrode dimensions (250 mm 15 mm) are larger than the sensitive area in order to guarantee a high electric field uniformity in the active volume. Figure 1 shows a scheme of the detector layout, and figure 2 shows the detector cross section. The total dimensions of the assembled device are 350 mm 70 mm 4.5 mm.
2.2 Read-out electronic system
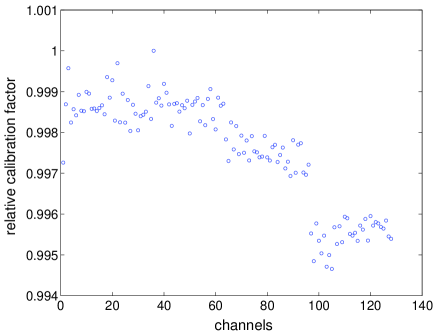
The X-ray Data Acquisition System (XDAS) has been used as read-out electronic. This system is provided by the company Electron Tubes Ltd., and it is based on the Xchip developed by the CCLRC. It consists of a modular system in which each board has 128 read-out channels, and up to 63 boards can be serially connected, giving a maximum of 8064 readout channels. The main characteristics of the XDAS system are showed in table 1. For this application we only use one board (128 channels). The response of each read-out channel has been studied using a Thevenin current source. The mean sensitivity of the channels is 42726 ADC counts per pC. The relative non-uniformity in the response of the channels (figure 3) is lower than 0.6 %.
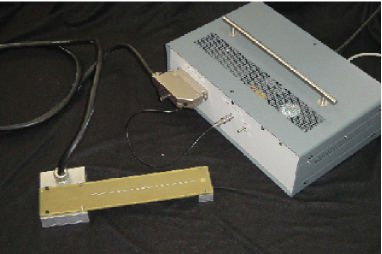
The XDAS system together with the DC power supplies and a high voltage generator were mounted into a metallic box (the electro-meters station) to protect them from external noise and also to make a manageable device. This portable unit is placed close to the detector and outside of the direct beam. It is connected to the detector through a 3 meter double shielded cable, and to a PC standard serial and parallel ports for digital control and read-out. Figure 4 shows a photo of the assembled device.
-
integration period 0.01 ms to 0.5 s sub-samples 256 max. signal to noise ratio 30000:1 readout rate 5 MB/s max. non-linearity 0.1 % A/D conversion 14 bit data output 16 bit dimensions 101 mm 164 mm
3 Principles of operation
3.1 Initial recombination
When ionizing radiation interacts with a medium ionizes electron-ion pairs along its track. Electrons released from molecules thermalize at a distance , where the electron and the positive ion are still bounded by the Coulomb interaction. This causes the recombination of a fraction of the primary ionization pairs produced, which is called initial recombination. These effects are much more relevant in liquids than in gases due to the fact that mass density of liquid hydrocarbons is almost three orders of magnitude higher than density of gases at normal conditions, and then is much smaller. The amount of electron-ion pairs escaping initial recombination per 100 eV of absorbed energy is denominated the free ion yield and is denoted as . The initial recombination, and thus the , depends on the liquid properties, on its temperature, , an on the external electric field, , (Onsager 1938), but does not on the dose rate. For low electric field values ( V mm-1) the rises approximately linear with the electric field:
| (1) |
The constant must be measured for a correct absolute dosimetry, but is well approximated by (Mozumder 1974, Pardo et al2004), where is the called Onsager field. Here and are the relative dielectric constant of the liquid and the dielectric constant of the vacuum respectively, is the Boltzmann constant and is the electron charge.
3.2 Volume recombination and ion collection efficiency
-
(m3 s-1 V-1)(a) 3.510-8 (m3 s-1 V-1)(a) 2.310-8 (m3 s-1)(a) 5.410-16 (b) 0.32 (20 0C) 1.94 (20 0C) (V mm-1) 1.74103 (20 0C) (a)Determined measuring the temporal development of the read-out signal in a pulsed beam. The mobilities reported by several authors for non ultra-pure isooctane are in the range 1-410-8 m3 s-1 V-1, probably due to different contamination in the liquids. (b)From Pardo et al(2004).
The electrons that have escaped from initial recombination flow due to drift and diffusion, and this made possible the interaction between ions from different tracks, which causes the volume recombination. Volume recombination depends on the liquid properties, on the electric field, on the dose rate and also on the form in which the dose is delivered (i.e. pulsed or continuous radiation).
Actual clinical linear accelerators delivered the dose in high ionization pulses of a few s duration and several ms period. The beam dose rate is modulated varying the pulse period.
If the pulse period, , is higher than the charge carriers drift time in the liquid, i.e. when
| (2) |
the collection efficiency will not depend on the period (i.e. on the dose rate). In equation (2) denotes the lower mobility. In this case we can apply the theory of Boag (1950). This theory assumes the negative charge is carried by ions and also neglects space charge effects and recombination during the pulse. The theory has been experimentally tested by several authors (see for example Johansson et al1997), and within it the collection efficiency is given by,
| (3) |
with
where is the amount of charge released by the radiation in the liquid and escaping initial recombination per unit volume and pulse, is the liquid layer thickness, is the polarization voltage, and are the mobilities of positive and negative charge carriers and is the volume recombination constant, which for a low permittivity non-polar liquid can be expressed as (Debye 1942),
| (4) |
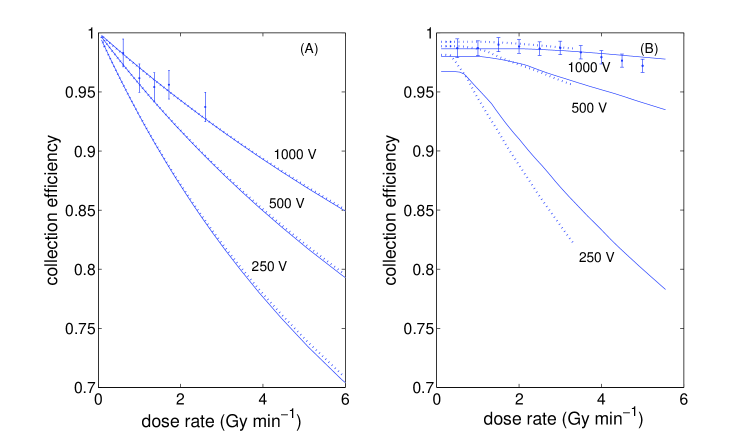
We use a numerical simulation to calculate the collection efficiency of the detector irradiated by a pulsed beam using the parameters of table 2. We considered the pulse period of a Siemens Primus accelerator placed in the Hospital Clinico Universitario de Santiago, which is related to the monitor unit rate as
where is expressed in seconds and is the monitor unit rate expressed in MU min-1.
Figure 5 shows the computed detector collection efficiencies. In figure 5(a) the dose rate is modulated varying the source-detector distance (SDD). The pulse period verify equation (2) and then the Boag theory can be applied. There is a good correspondence between the simulation, the Boag theory and the experimental points (for a 1000 V operation voltage). In figure 5(b) the distance is constant and the dose rate is modulated changing the accelerator monitor unit rate (up to 300 (500) MU min-1 for the 6 (15) MV beam). We can see that in the upper part of the curves there is not dependence on the dose rate. This is due to in this region the pulse period is higher than the charge carriers drift time. Due to this fact, the collection efficiency does not go to 1 when the dose rate goes to 0, because the zero dose rate limit is achieved taking . In the constant part of the curves the results obtained with the simulation are very close to those computed from the Boag theory. For example, for the 15 MV beam, with a 1000 V polarization voltage, the simulated collection efficiency at low dose rates is %, very close to the experimentally measured ( %, although due to accelerator dose rate oscillations the experimental results have important uncertainties as we can see in figure 5(b)) and to the computed from the Boag theory ( 98.7%). For the 6 MV beam with the same voltage the simulated value is % and the the computed from the Boag theory is %. Only in the case of overlapping of charges ionized by different pulses will the collection efficiency depend on the dose rate. In this case the Boag theory cannot be applied. In figure 5(b) we can see a quite good agreement between the experimental points, for the 15 MV beam and with a 1000 V detector polarization voltage, and the simulation.
From figure 5 we can conclude that the recombination is higher when there is not pulse overlapping and the dose rate is modulated changing the SSD. The maximum detector response non-linearity depends on the charge collection efficiency variation between low and high dose rates. Thus, a higher non-linearity is expected when the dose rate is modulated in this way.
4 First tests of the device
4.1 Experimental set-up
The first tests of the device were performed using a Siemens Primus accelerator placed in the Hospital Clínico Universitario de Santiago. For this accelerator a MU is defined as 1 cGy at the maximum depth (1.6 cm for 6 MV and 3 cm for 15 MV) in a water phantom for a 10 cm 10 cm field and SSD=100 cm. Measurements were performed in a home-made solid water phantom. The detector operation voltage was 1000 V and the XDAS integration time was 10 ms. Unless mentioned otherwise, the SSD was 100 cm.
Comparative measurements of OFs and energy dependence have been made with a 0.125 cm3 air ionization chamber (PTW, Freiburg, Germany, type 31010). Penumbras and profiles measurements were compared with RGFs measurements. In some cases we used a 0.015 cm3 PinPoint chamber (PTW, Freiburg, Germany, type 31006) which has a 2 mm diameter.
4.2 Pixel response calibration
To study the pixel response homogeneity the detector was inserted in the phantom at a 2 cm depth and irradiated with 10 cm 10 cm 6 MV photon shots, each one delivering 50 MU at a 100 MU min-1 rate. Between each shot the detector was displaced 1.7 mm with a micro-metric linear stage in order to compare the read-out signal of each pixel in the center of the field. The maximum relative deviation in the response was 6 %. The non-homogeneity is due to different response of each XDAS read-out channel (studied in subsection 2.2.) and to small inhomogeneities in the gap and the pixel area. These effects have been corrected in all the following measurements.
4.3 Read-out signal linearity with the dose rate
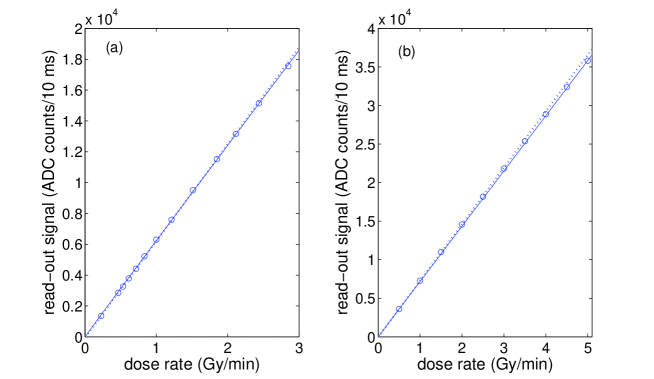
Figure 6 shows the read-out signal in the central pixel of the device plotted against the dose rate, when the detector was irradiated by a 10 cm 10 cm 15 MV photon beam. The detector is placed in the phantom at a 4 cm depth. In the first case, figure 6(a), the monitor unit rate was 100 MU min-1 to avoid the superposition of charge carriers ionized by different pulses, and the dose rate was modified changing the SSD from 130 cm to 60 cm. In the second case, figure 6(b), the SSD was 100 cm and the dose rate was modified varying the accelerator MU rate from 50 MU min-1 to 500 MU min-1 in 50 MU min-1 steps.
It is common to fit this relationship to the empirical expression of Fowler and Attix (1966)
| (5) |
where is the read-out signal, is a parameter for the detector sensitivity and a parameter related to the non-linearity of the detector response. We obtain in the first case, and in the second case, which implies a small non-linearity in both cases. The linear fit of the lower dose rate points shows 1.5 % deviation from linearity in the first case (at 2.9 Gy min-1) and 2.1 % in the second (at 5 Gy min-1).
4.4 Photon beams profiles
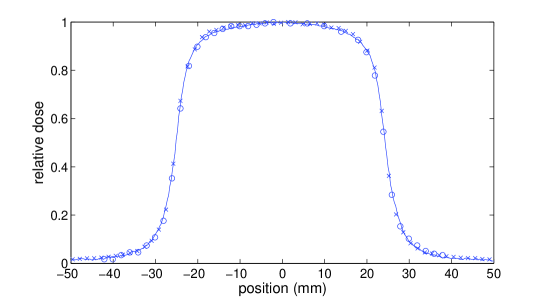
Figure 7 shows a profile of a 15 MV 5 cm 5 cm at 5 cm depth in solid water, measured with our linear array, with the PinPoint chamber (displaced with the linear stage in 2 mm steps) and with RGF. All the profiles show a good correspondence.
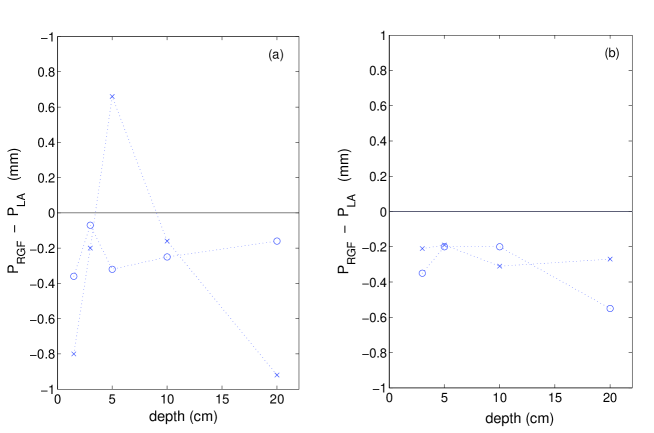
To study possible systematic deviations in the penumbras measured with the linear array, several 90 %-10 % and 80 %-20 % penumbras of photon beams were measured. The studied fields were 5 cm 5 cm at 3 cm, 5 cm, 10 cm and 20 cm for 15 MV, and at 1.5 cm, 3 cm, 5 cm, 10 cm and 20 cm for 6 MV in the solid water phantom. The MU rate was 100 MU min-1 in all cases. For each configuration penumbras from linear array profiles were determined through quadratic interpolation, and the average of the left and the right penumbras was considered. The results were compared with RGF measurements. We use RGF despite its energy dependence because this effects does not affect too much the penumbra measurements, at least at moderate depths and field sizes (Martens et al2002), and it provides a high spatial resolution. Differences between measurements of both detectors are plotted in figure 8. We can see that penumbras measured with the linear array are broader, in general, than those measured with RGF. Typical uncertainties of the points plotted in figure 8 are around 0.2 mm and 0.4 mm for 80 %-20 % and 90 %-10 % respectively, and then most of these differences are compatible with zero.
4.5 Output factors
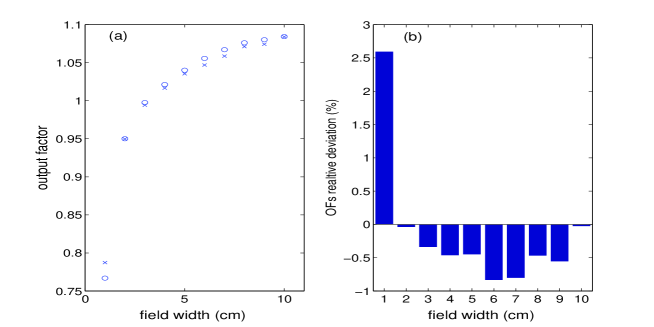
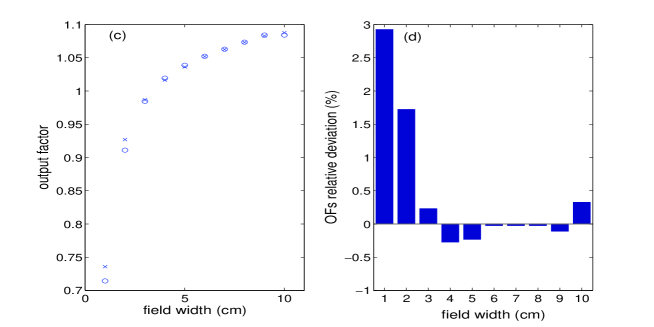
Output factors (OFs) are defined as the ratio of the dose at a given depth for a given field size to the dose at the same depth for the reference field size. OFs for several rectangular fields were measured with the central pixel of the linear array and compared with the OFs measured with the reference detector. The length of the field was 10 cm and the width was varied between 10 cm and 1 cm in 1 cm steps. A 5 cm 5 cm was taken as reference field. The accelerator MU rate was 100 MU min-1. The depth was 5 cm for 6 MV and 10 cm for 15 MV in the solid water phantom. As reference detector we used the 0.125 cm3 chamber, except for the narrowest field where we used the 0.015 cm3 chamber due to its smaller sensitive volume.
Figure 9 shows the OFs measured with the linear array, the reference detector, and their relative deviation. The linear array seems to over-respond to narrow fields both for 6 MV and 15 MV (up to 2.9 % for the 1 cm width 15 MV field). However for the smaller fields the OFs uncertainty is large due to the positioning uncertainty and the difference between the sensitive volume of both detectors. For wider fields the linear array presents an under-response (around 0.5 % and 0.1 % for 6 MV and 15 MV respectively). This behavior has been observed and studied in a similar detector by Martens et al(2001) who found that is related with the effect of the electrode metalization.
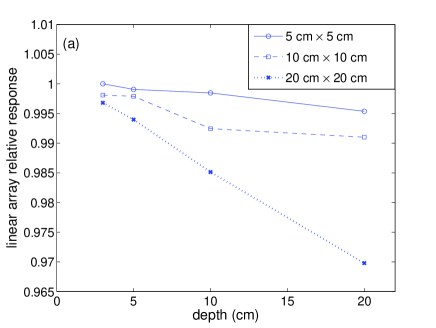
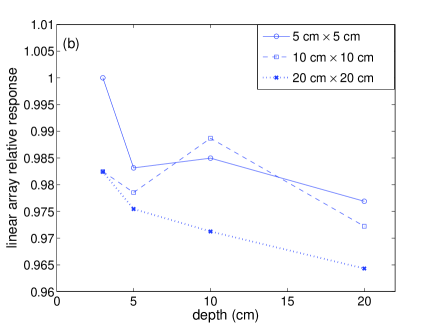
4.6 Energy dependence and effect of the field size.
To study the dependence on the energy spectrum of the incident radiation and the influence of the irradiated area on the read-out signal, measurements were performed for 6 MV and 15 MV at several depths and for several field dimensions. The results were compared with the data obtained with the 0.125 cm3 chamber. Figure 10 shows the ratio of the linear array measurements to those of the reference detector. The ratio was normalized to unit for a 5 cm 5 cm field at 3 cm both for 6 MV and 15 MV. The relative uncertainties of the normalized data plotted in the figure are around 0.5 %. From this figure it is clear that the relative signal decreases when the field size increases as was expected from the OFs measurements. In addition the linear array underrresponds when the depth is increased. This under-response is up to 2.7 % for 6MV and up to 2.5 % for 15 MV, and again can be related with the metallization of the electrodes (Martens et al2001).
4.7 Measurement of an IMRT and virtual wedge profiles
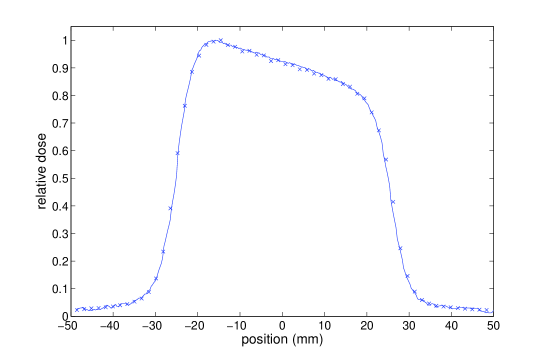
The detector can be used for the verification of virtual wedges. A profile of a 450 virtual wedge for a 15 MV 10 cm 10 cm, delivering a total of 200 MU, has been acquired with the linear array and RGF. The results are compared in figure 11, with a maximum difference of 3% and an average difference less than 1 %.
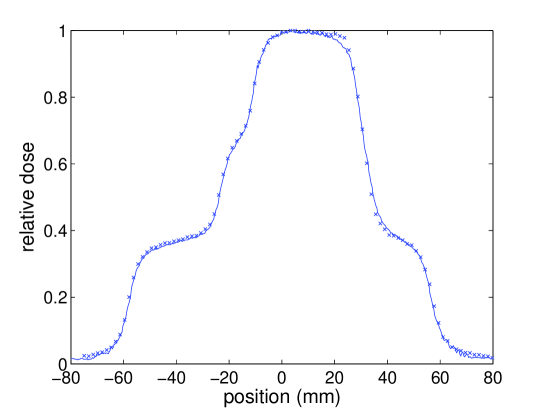
Also a profile of an IMRT field which consists of four segments, each one delivering 50 MU, was acquired. Each segment delivered 50 MU. The linear array and RGF results are compared in figure 12. The maximum difference is 3 % while the average difference is again less than 1 %.
4.8 Signal reproducibility
The signal reproducibility was studied along the test period (around three months). All equivalent measurements were within a 2 %. An important fraction of this deviation is due to temperature dependence, which has not been studied. Liquid-filled devices relative read-out signal dependence on temperature is around 10-3 per degree due to the temperature influence on initial recombination (Mozumder 1974, Wickman et al1998).
5 Conclusions
The response of each linear array pixel is very linear with the dose rate (2.1 % deviation at 5 Gy ). A correction factor has to be applied to each pixel due to the low inhomogeneity in the XDAS response, and to small inhomogeneities in the gap and the pixel area. OFs measurements deviates less than 1 % from those measured with the reference detector for field widths from 2 cm to 10 cm (2 cm to 10 cm) for 6 MV (15 MV). For the narrower fields the deviation is less than to 3 %, but for this narrow fields the positioning uncertainty is high, and the difference between the active volume of a linear array pixel and the reference detector can affect the OFs measurements. The energy dependence is lower than 2 % (for depths up to 20 cm and field sizes from 5 cm 5 cm to 20 cm 20 cm). Despite this dependence is not very large, it has to be taken into account when using the detector at high depth.
The detector has measured with accuracy several beam profiles and penumbras, and also IMRT and virtual wedge treatments. The small pixel size of the device combined with the fast and sensible XDAS read-out system allow a faster verification of these fields with a very good spatial resolution (even in regions of high dose gradient) and signal to noise ratio, making mechanical displacement unnecessary and showing its utility for high-precision relative dose measurements.
In addition, the detector can be used for absolute dose measurements. The and its dependence with the electric field have been studied together with the charge losses due to volume recombination. Considering these effects, the absolute dose can be obtained from the read-out signal. Studies concerning the temperature dependence, the influence of the detector walls in the absolute dose deposited in the medium, the dose calibration and also the long term stability of the device will be the scope of further work.
References
References
- [1]
- [2] [] Belletti S, Cirio R, Cocuzza L, Degiorgis P G, Donetti M, Madon E, Marchetto F, Marletti M, Marzoli L, Peroni C, Trevisiol E and Urgesi A 2001 Pixel segmented ionization chamber for therapeutical beams of photons and hadrons Nucl. Instrum. Methods A 461 420-1
- [3]
- [4] [] Boag J W 1950 Ionization measurements at very high intensities: 1. Pulsed radiation beams Br. J. Radiol. 23 601-11
- [5]
- [6] [] Debye P 1942 Reaction rates in ionic solutions Trans. Electrochem. Soc. 82 265-72
- [7]
- [8] [] Eberle K, Engler J, Hartmann G, Hofmann R and Hörandel J R 2003 First tests of a liquid ionization chamber to monitor intensity modulated radiation beams Phys. Med. Biol. 48 3555-64
- [9]
- [10] [] Fowler J F and Attix F H 1966 Solid state integrating dosimeters Radiation Dosimetry vol 2 (New York: Academic) 241-90
- [11]
- [12] [] Johansson B, Wickman G and Bahar-Gogani J 1997 General collection efficiency for liquid isooctane and tetramethylsilane in pulsed radiation Phys. Med. Biol. 42 1929-38
- [13]
- [14] [] Jursinic P A and Nelms B E 2003 A 2-D diode array and analysis software for verification of intensity modulated radiation therapy delivery Med. Phys. 30 870-9
- [15]
- [16] [] Martens C, De Wagner C and De Neve W 2001 The value of the LA48 linear ion chamber array for characterization of intensity-modulated beams Phys. Med. Biol. 46 1131-48
- [17]
- [18] [] Martens C, Claeys I, De Wagner C and De Neve W 2002 The value of radiographic film for the characterization of intensity-modulated beams Phys. Med. Biol. 47 2221-34
- [19]
- [20] [] Mozumder A 1974 Effect of an external electric field on the yield of free ions. I General Results from the Onsager theory J. Chem. Phys. 60 4300-4
- [21]
- [22] [] Niroomand-Rad A, Blackwell C R, Coursey B M, Gall K P, Galvin J M, McLaughlin W L, Meigooni A S, Nath R, Rodgers J E and Soares C G 1998 Radiochromic film dosimetry: Recommendations of AAPM Radiation Therapy Committee Task Group 55 Med. Phys. 25 2093-2115
- [23]
- [24] [] Onsager L 1938 Initial recombination of ions Phys. Rev. 54 554-7
- [25]
- [26] [] Pardo J, Franco L, Gómez F, Iglesias A, Lobato R, Mosquera J, Pazos A, Pena J, Pombar M, Rodríguez A and Sendón J 2004 Free ion yield observed in liquid isooctane irradiated by rays. Comparison with the Onsager theory Phys. Med. Biol. 49 1905-14
- [27]
- [28] [] Sykes J R, James H V and Williams P C 1999 How much does film sensitivity increase at depth for larger field sizes? Med. Phys. 26 329-30
- [29]
- [30] [] van Herk M and Meertens H 1988 A matrix ionization chamber imaging device for on-line patient setup verification during radiotherapy Radiother. Oncol. 11 369-78
- [31]
- [32] [] Wickman G and Nyström H 1992 The use of liquids in ionization chambers for high precision radiotherapy dosimetry Phys. Med. Biol. 37 1789-812
- [33]
- [34] [] Wickman G, Johansson B, Bahar-Gogani J, Holmström T and Grindborg J E 1998 Liquid ionization chambers for absorbed dose measurements in water at low dose rates and intermediate photon energies Med. Phys. 25 900-7
- [35]