Optical response of strongly coupled metal nanoparticles in dimer arrays
Abstract
The optical responses of structured array of noble-metal nanoparticle dimers immersed in a glass matrix are investigated theoretically, motivated by the recent experimental observation of the splitting of the surface plasmon bands in silver arrays. To capture the strong electromagnetic coupling between the two approaching particles in a silver dimer, the spectral representation of the multiple image formula has been used, and a semiclassical description of the silver dielectric function is adopted from the literature. The splitting of plasmon resonance band of the incident longitudinal and transverse polarized light is found to be strongly dependent on the particle diameter and their separation. Our results are shown in accord with the recent experimental observation. Moreover, a large redshift for the longitudinal polarization can be reproduced. The reflectivity spectrum is further calculated for a dilute suspension of dimer arrays.
pacs:
78.67.Bf, 78.40.-q, 71.45.GmI introduction
The optical properties of small metal clusters embedded in a dielectric medium have attracted extensive attention in recent years. Kreibig95 ; VMShalaev ; Olivier02 ; Yu1997pre ; Shalaev98 The studies have been developed into many new applications in nanostructure enhanced spectroscopies such as surface-enhanced Raman scattering and single-target molecule detection, VMShalaev ; Katrin97 ; Sheldon00 with near-field observation on length scales smaller than the wavelength of light. It is known that strong absorption of light occurs at certain frequencies due to the collective motions of the conduction electrons in metal called the surface plasmon resonance, as well as to the inter-band transition of electrons in deeper levels. The plasmon resonant frequency depends strongly on the size and the geometry of the particles, Jin01 ; Aizpurua03 ; Olivier02 ; Mock02jpc as well as on the dielectric function of metal and the surrounding medium. Moskovits02 The studies are significant theoretically because these factors lead to characteristic charge confinement and strong local field enhancement. YGu02 On the other hand, these properties are also of practical importance in the context of future electronic and optical device applications.
For isolated spherical particles with a diameter much smaller than the wavelength of light (), the interactions between light and metal lead to an homogeneous but oscillating polarization in the nanoparticles, resulting in a resonant absorption peak in the visible part of the optical spectrum. The plasmon resonances in more complex structures of nanoparticles such as concentric spherical particles, which are the spherical analog of planar multilayer heterostructures, can be more complicated. These resonances are due to the hybridization of free plasmons, which can be pronounced depending on the geometry of the particles. Halas02 ; kwyu97 ; Oldenburg99 For nanoparticle ensembles like metal clusters, however, the electromagnetic coupling between neighboring particles shifts the plasmon absorption bands. Ausloos80 ; Ausloos82 For instance, a nanoparticle chain can be utilized for building optical waveguides in the nanoscale. Stefan02 ; Pieter03 ; Romain04 These structures exhibit lateral mode confinement smaller than the optical diffraction limit, which cannot be achieved with conventional waveguides nor with other novel technologies such as photonic crystals or plasmonic stripe waveguides.
In the linear arrays of nanoparticles, the optical response can generally be anisotropic, because the interparticle coupling depends on whether incident light is polarized longitudinal or transverse to the chain axis. This is also one of the underlying principles of optically dichroic glass. Nowadays, structured nanoparticle array can be easily made by electron-beam lithography Stefan02prb or other fabrication techniques. Penninkhofa03 On the theoretical side, finite-difference time-domain (FDTD) simulation methods can accurately reproduce the spectroscopic properties of plasmon waveguides and optical pulse propagation in these structures as well. Pieter03 Nevertheless, theoretical investigations by the full solution of Maxwell’s equations are complicated due to the coupling between plasmons of different modes. Although there are already some fruitful discussions, Halas97 ; Stroud04 it is intrinsically a many-body interaction problem. Generally, two types of electromagnetic interactions between particles can be distinguished: near-field coupling and far-field dipolar interaction depending on the range of interactions concerned. For particle separation larger than the wavelength of light, the far-field dipolar interactions with a dependence dominate. Much work has focused on these far-field interactions between metal nanoparticles and their possible applications in optoelectronic materials. However, relatively little is known about the nature and the properties of the near-field interactions of closely spaced metal nanoparticles, which is the object of the present work. The present work is related to earlier studies of FDTD by Oliva and Gray,Oliva03 experiment and simulation by Su et al.,Su03 the finite elements method by Kottmann and Martin,Martin01 as well as the pioneering works of the discrete dipole approximation (DDA) method by Hao and Schatza Schatz04 , who all discovered that the interparticle spacing in the particle dimers is crucial to their properties.
In this paper, we will use the multiple-image method YuCPC00 and Bergman-Milton spectral representation Bergman ; Bergman79 for a dimer of two approaching particles JPHuang02 to investigate the optical extinction and reflectance spectrum of structured arrays of noble-metal nanoparticles, motivated by the recent experimental observation of the splitting of the surface plasmon resonance bands for polarizations in the arrays. Stefan02prb ; Penninkhofa03 By taking into account the strong coupling of two approaching particles in a dimer, we will show that the redshift as large as eV into the near-infrared regime observed in experiment Penninkhofa03 can be understood. The resonant peak broadening and splitting for different polarizations can be predicted from our calculations, and the results for the reflectance spectrum are also presented.
The rest of the paper is organized as follows. In the next section, we review the general spectral representation of two approaching particles. In Sec. III, we examine the normal-incidence extinction spectrum and reflectance spectrum of a silver dimer array immersed in a glass matrix, which is followed by discussion and conclusion in Sec. IV
II Formalism
First we review some formulae similar to those appeared in Ref. 32, however, in a much different context. Considering an isolated spherical metal particle in a lossless isotropic dielectric matrix with real permittivity , the complex permittivity of the metal particle is , where is the frequency of the external electric field , and will be discussed in detail afterwards. In this case, the dipole moment induced inside the particle is
| (1) |
where
| (2) |
is the dipole factor, which defines the polarizability of the particle against the host and is related to extinction coefficient directly, is the diameter of the particle. To account for the multipolar interaction between a pair of particles (i.e., a dimer) with spacing (center-to-center distance ), we use the multiple image formula. YuCPC00 When the dimer is subjected to an unpolarized field, the average of the total dipole moment of one particle is given by
| (3) |
where is the angle between the dipole moment and the line joining the centers of the two particles. Here and are the longitudinal and transverse dipole moment, respectively, JPHuang02
| (4) |
where satisfies the relation . Now the new dipole factors ( and ) of a particle in the dimer can be extracted for the longitudinal and transverse field case, respectively. Using the spectral representation, Bergman we have
| (5) |
with the complex material parameter
| (6) |
where
| (7) |
In case of unpolarized field, the averaged dipole factor can be derived directly from Eq. (3), Eq. (II) and Eq. (II), namely,
| (8) |
Eq. (II) (or Eq. (8)) is an exact transformation of the multiple image expression, YuCPC00 and consists of a set of discrete poles and , which deviates from (pole of an isolated spherical particle). In particular, the longitudinal and transverse poles and shift asymmetrically to different sides from . That is, an unpolarized field can excite all poles at both sides. The poles almost collapse to that of an isolated sphere ( and ) if , indicating that the multipolar interaction is negligible. However, when the two particles approach to each other and finally touch, the longitudinal (transverse) poles decrease (increase) far from . Thus, in this case, one should take into account the effect of multipolar interactions [see Fig. 5 in Ref. 32 for details].
The complex dielectric function is crucial to the optical properties of metal-dielectric systems. Kreibig95 For noble metals, it can generally be described by the free electron Drude-Lorentz-Sommerfeld model plus an additive complex contribution from interband transition, i.e., . A complicated function of the dielectric dispersion of Ag takes the form
| (9) |
which could be adopted to approximate the measured dielectric function over a wide wavelength range. Moskovits02 In Eq. (9), may be negative. The sum over Lorentz functions and the constants are meant to reproduce the interband and all other non-Drude contributions to the dielectric function. Lorentz functions are chosen because it is known that must obey the Kramers–Kronig relations. However, in the frequency range of interest (ev), Penninkhofa03 a modified Drude model is easier to describe the dielectric response of Ag: Pieter04
| (10) |
with plasmon resonant frequency rad/s and with the high-frequency limit dielectric function , static dielectric function . These values were fitted out to be in good correspondence with the literature values. Johnson72 ; Moskovits02 And the collision frequency in the material is assumed to be related to the particle diameter around nm by Peters00
| (11) |
with bulk Fermi velocity m/s, room temperature electron mean free path nm. For nm, ; for nm, . These results show that the mean free path of an electron in a nanoparticle is reduced compared to its bulk value due to inelastic collisions with the particle surface. The values are taken in our latter calculations of different metal-dielectric systems, and compared to the two experimental samples, within which the diameters of Ag nanoparticles were in the span of nm. Peters00 ; Penninkhofa03 Note that determines the linewidth of the resonant peak. In the diameter range under consideration, Eq. (11) is safe Molina02 and indicates that a smaller particle diameter leads to a wider resonant peak. We are not intended to quantitatively compare with the experimental data of Ref. 22, otherwise, we would be restricted to a somewhat more rigid size-dependent dielectric function, for example, as Westcott et al.Halas02 Nevertheless, the local dielectric treatment is satisfactory as Hao and Schatz pointed out that the significant effects of size-dependent dielectric responses come to appear for particles with diameter less than nm.Schatz04
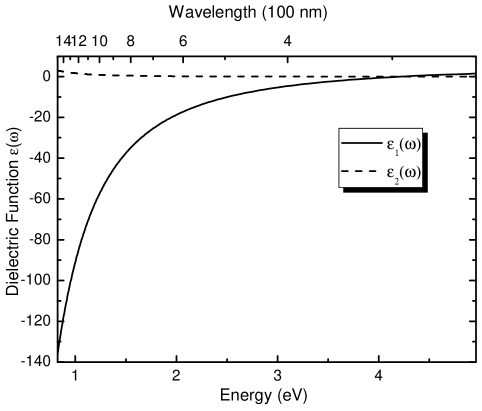
Let us use and to denote the real and imaginary part of the dielectric function obtained by Eq. (10), respectively, that is . Fig. 1 shows and versus light wavelength in the span of nm (i.e. photon energy around eV). A negative is guaranteed for the proper phase relation between the external field and particle polarization. The dielectric function changes slightly when the particle diameter decreases from nm to nm [not shown in Fig. 1], however, the resonant line shape is very sensitive to , i.e. the particle diameter [see Sec. III]. ensures that the plasma resonance is in quasi-static regime, so phase retardation is negligible, effects of higher multipoles can also be neglected for isolated spherical particle, which means that dipole plasmon resonance dominates. Kreibig95
III Numerical Results
Now we consider an array of silver dimer immersed in a glass matrix of refractive index 1.61, with the spacing between the two particles in a dimer being less than their diameter (). Any two dimers are assumed to be far away enough, so the dimer-dimer interaction can simply be at far-field approximation, which is neglected in our calculation for simplicity. In the particle diameter regime around nm, dipole absorption contribution dominates the scattering effect, although dipole scattering increases and dipole absorption fades away for increasing particle sizes. Kreibig95 So in the quasi-static regime, the extinction coefficient of a well-dispersed collection of small particles is mainly contributed by absorption, with absorption cross section proportional to Im(). Angel93 ; Kreibig95 The complex value expressions of dipole factor in Eq. (2), Eq. (II) and Eq. (8) lead to different resonant peaks at different frequencies. To calculate optical extinction, is taken for well-dispersed (isolated) nanoparticles, while () is adopted for an array of dimers.
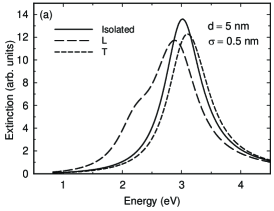
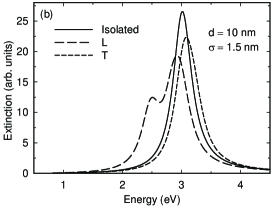
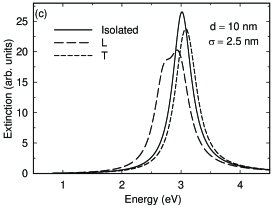
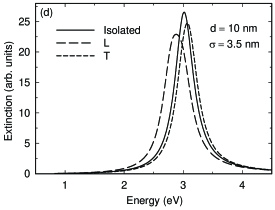
Figure 2 shows the optical extinction spectra of an array of dimers with particle diameter nm, spacing is nm and nm, respectively. For comparison, solid curve is plotted for the extinction spectrum of isolated silver particles. The surface plasmon resonant peak is located around nm (eV), which is in agreement with the first ion-exchanged sample irradiated by Mev Xe in Ref. 22. The sample contains randomly dispersed silver nanocrystals and the resonant band is polarization independent. Long-dashed curves and medium-dashed curves in Fig. 2 are the extinction spectra for the array of dimers with illumination light polarized in the longitudinal and transverse direction, respectively. It is clear that the plasmon resonance band for longitudinal polarization is redshifted with respect to that of isolated particles, whereas the plasmon resonance band for transverse polarization is blueshifted. These were also observed in the experiment. Penninkhofa03 In detail, after the sample was subsequently irradiated by Mev Si with fluences up to /cm2, clear alignment of Ag nanocrystals was observed along the ion-beam direction. Additionally, farther redshift and blueshift occur when decreasing the spacing of the two nanoparticles in a dimer from nm to nm [see Fig. 2]. That is, a stronger electromagnetic coupling induces further band shifts. YGu02
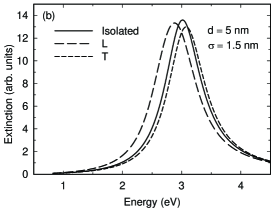
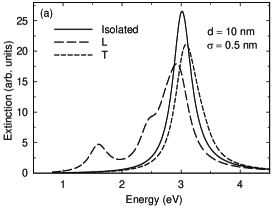
Similarly, an array of dimer with a larger particle diameter nm are investigated in Fig. 3, for different spacing , , and nm. Splitting of the resonant peak for both the longitudinal and transverse polarized light can also be observed. However, a second resonant band appears as the two particles in the dimer approach to each other. The second peak position is around nm (close to eV) when spacing decreases to nm [see Fig. 3(a)], this is in good agreement with the experimental observation of the second sample in Ref. 22. For this sample, growing and more compact alignment of the silver nanocrystals are assumed to happen in response to higher Si ion fluences irradiation (up to /cm2), and much higher irradiation fluences induces much larger splitting of the resonant band for both the longitudinal and transverse polarizations. In fact, all of these are also obtained from Fig. 3. In principle, even in the quasi-static regime, there are different causes of multipeak behavior of optical spectra: (1) the splitting of the dipole mode owing to nonspherical particle shapes, (2) the excitation of higher multipole modes in irregularly shaped clusters as a result of inhomogeneous polarization (In this case, number of resonances strongly increases when the section symmetry decreases), (3) the enhanced excitation of multipoles due to image interactions for spheres. Multipeak structures can also be produced by appropriate spectra, and may be damped away if is sufficiently large. But as Fig.1 shows, the model dielectric function resulting from experiments of silver nanoparticles doesn’t exhibit these behaviors, so we are confident that the multipeak behavior observed in the sample is substantially due to the strongly coupling between the two particles in a dimer (i.e. (3)), because no obvious identical irregular shape can be seen for the samples. Penninkhofa03
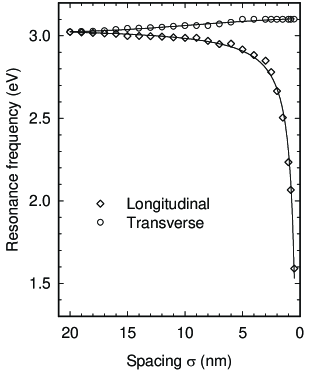
The largest shift of resonant peak of the dimer array is shown for the longitudinal and transverse field cases in Fig. 4, at nm. The figure shows the farthest shifting of the peak positions versus spacing . The results are obtained by first calculating the extinction spectra with different in the range of nm, and then finding out the position of resonant peak at the longest (shortest) wavelength for the longitudinal (transverse) polarization. Large shifting is obvious only when , and this can also be understood from the spectral representation in the insert of Fig. 5(b), which demonstrates that the spectral poles collapse to when tends to be larger than nm. Within the spacing of , the redshift for the longitudinal polarization (diamond) is obviously stronger than the blueshift for transverse polarization (circle). The large splitting is due to both the dipole mode coupling (collective excitation mode) and the excitation of multipole modes by image interactions.
We also note that the main resonant peak is narrower in Fig. 3 than that in Fig. 2, which is mainly ascribed to the different intrinsic damping efficient concerning the particle diameter. The narrowing of the resonant peak for increasing particle diameter was also observed in the experiments. Penninkhofa03 Note that no obvious peak shifting is observed in the experiments for isolated particles after their growing.
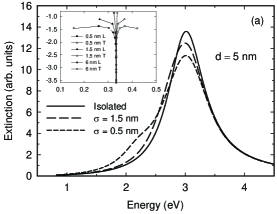
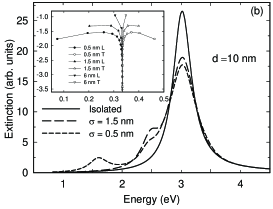
It is instructive to investigate the optical extinction properties of the array of dimers for an unpolarized light. We take the average of the longitudinal and transverse dipole factor, i.e. Eq. (8) to obtain the extinction spectra. Results are shown in Fig. 5 for the two different cases of particle diameter nm and nm, respectively. Corresponding poles and residues of to 10 in the spectral representation are given in the inserts. It can be clearly seen that extinction spectra still change when particles aggregate into structured array from a well-dispersed assemble, even though the illumination light keeps unpolarized. This is due to the asymmetric coupling in different topology of the field distribution inside and in the vicinity of the particles. YGu02 Note that the shifting tendency of plasmon-resonance band could be related to the pole deviating from . For specific spacing, say, nm, the pole of of the dimer with large particles [see insert in Fig. 5(b)] is further away from 1/3 than that with small particles [see insert in Fig. 5(a)]. Equivalently, there is a corresponding resonant peak appearing [Fig. 5(b)] at long wavelength regime for the case of large particles (nm), whereas no obvious peak appearing [Fig. 5(a)] for the case of small particles (nm). Theoretically, the discrete terms in the spectral representation should generate a series of resonant bands, but they are generally very close and superpose to each other, so it is hard to resolve them. In many cases the effect is broadening of the resonance only, so the plasmon modes remain spectrally unseparated.
For interest, we compare the reflectivity spectra for the different cases. In the dilute limit, the effective dielectric function of the composite is given by kwyu93 ; Yuen97
| (12) |
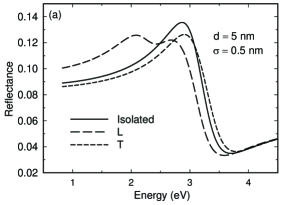
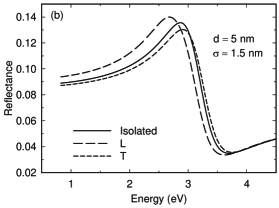
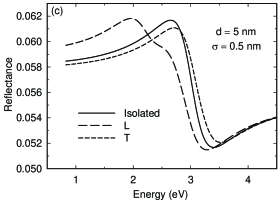
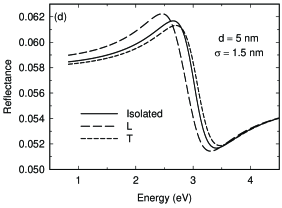
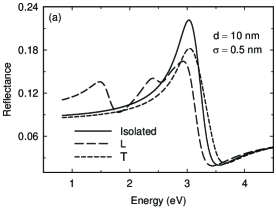
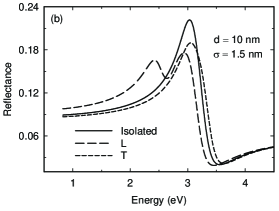
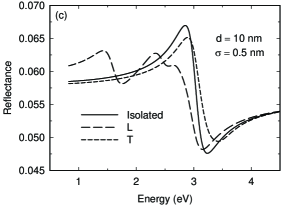
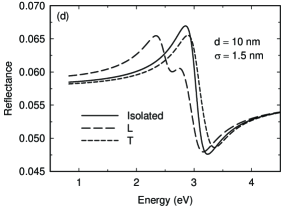
where p is the volume fraction of the silver particles. Reflectance at normal incidence is .kwyu97 Fig. 6 and Fig. 7 are plotted as the reflectance versus photon energy of the illumination light for the different arrays discussed above, with particle diameter and nm respectively. Volume fraction [see Fig. 6(a), (b) and Fig. 7(a), (b)] and [see Fig. 6(c), (d) and Fig. 7(c), (d)] are taken in the calculations. We can see slight shift of the reflectivity spectra for light with longitudinal and transverse polarization as compared to the case of isolated particles [solid curves in Fig. 6 and Fig. 7]. Reflectance decreasing in low-frequency regime is notable when spacing decreases [see Fig. 6(a), (c) and Fig. 7(a), (c)]. A large fluctuation in response to longitudinally polarized light is observed in the case of the larger particles with a small spacing [long-dashed curves in Fig. 7]. Meanwhile, increasing the volume fraction of the metal nanoparticles leads to the descending main peak of the reflectivity spectra. But note that the order of the absolute value of reflectance is different for the two different volume fraction. These are also ascribed to the very strong electromagnetic coupling between the nearby particles and the strongly enhanced local field.
IV discussion and conclusion
Here a few comments on our results are in order. Firstly, the tail going up of the extinction spectra in Ref. 22 is ascribed to the absorption of the matrix itself, see the reference measurement for a Ag ion exchanged sample that was irradiated with Si only. It does not show a plasmon absorption band and is colorless, because there were no silver nanocrystals formed. We didn’t take it into account in our calculation of the extinction spectrum. Furthermore, the experimental spectra are broader than our results, this is due to particle size distribution and coupling of particles in a chain through many-body interaction although we show that two-body interaction contributes little when particles are far away with spacing larger than their diameter.
In the present work, we are concerned with the multipolar interaction between particles, i.e., we focus mainly on the dimerization effect. In doing so, we could neglect the non-local effects in the present classical treatment. It is believed that the significant effects of size-dependent dielectric responses come to appear for particles with diameter less than 5 nm.Schatz04 Although near adjacence may enhance nonlocal contribution, our calculation results depend on the spacing-diameter ratio , rather than the absolute value of . That is, the spacing in use is scaled by the particle size, if regardless of the retardation effect. So we also didn’t consider the suppression of the dielectric confinement due to quantum penetration effects with very small interparticle gaps. We should worry about retardation effects when the particles size becomes large.
Due to strong coupling in the dimer, the enhanced excitation of multipoles of the electric field that occurs in the vicinity of the dimer appears, which is responsible for the excitation of spectrally distinct higher order plasmon modes, such as the quadrupole plasmon-peak feature around 900nm. Crosstalk between adjacent dimers is expected to have a negligible effect on the optical spectra since it takes place via far-field scattering of the individual nanoparticles with a distance dependence of , whereas near-field interactions of adjacent particles in each dimer show a dependence and dominate at small distances, which is captured by our multiple image model.
Maier et al. used a coupled dipole model in a particle chain and predicted a value of of the ratio of peak shifts of the longitudinal collective modes to peak shifts of the transverse collective modes, which is smaller than experiment value . Stefan02prb We believe that if one takes into account the multiple image interactions in the nanoparticle chain, the theoretically calculated value will be increased. Work are under progress in this way.
We can take one step forward to include the nonlinear characteristics of noble metal particles. For instance, based on Eq. (12), we could derive the effective third-order nonlinear susceptibility and then the nonlinear enhancement may be studied by taking into account multipolar interactions. Regarding nonlinear enhancement due to dimerization, we can formulate some equations, based on, say, Yuen and Yu. kwyu97 It is also interesting to apply the present theory to the polydisperse size case, in which the two particles have different diameters.
V acknowledgement
This work was supported by the RGC Earmarked Grant.
References
- (1) U. Kreibig and M. Vollmer, Optical Properties of Metal Clusters (Springer, Berlin, 1995).
- (2) V. M. Shalaev (Ed.), Optical Properties of Nanostructured Random Media (Springer, Berlin, 2002).
- (3) J. Tominaga and Din P. Tsai (Eds.), Optical Nanotechnologies: The Manipulation of Surface and Local Plasmons (Springer, Berlin, 2003).
- (4) K. P. Yuen, M. F. Law, K. W. Yu and Ping Sheng, Phys. Rev. E 56, R1322 (1997).
- (5) V. M. Shalaev and A. K. Sarychev, Phys. Rev. B 57, 13265 (1998).
- (6) K. Kneipp, Y. Wang, H. Kneipp, Lev T. Perelman, I. Itzkan, R. R. Dasari, and M. S. Feld, Phys. Rev. Lett. 78, 1667 (1997).
- (7) S. Schultz, D. R. Smith, J. J. Mock and D. A. Schultz, Proc. Natl. Acad. Sci. USA 97, 996 (2000).
- (8) R. Jin, Y. W. Cao and C. A. Mirkin, K. L. Kelly, G. C. Schatz and J. G. Zheng, Science 294, 1901(2001).
- (9) J. Aizpurua, P. Hanarp, D. S. Sutherland, M. Käll, G. W. Bryant and F. J. García de Abajo, Phys. Rev. Lett. 90, 057401 (2003).
- (10) J. J. Mock, M. Barbic, D. R. Smith, D. A. Schultz and S. Schultz, J. Chem. Phys. 116, 6755 (2002).
- (11) M. Moskovits, I. Srnová-šloufová and B. Vlčková, J. Chem. Phys. 116, 10435 (2002).
- (12) Y. Gu and Q. H. Gong, J. Phys: Condens. Matter 14, 6567 (2002).
- (13) S. L. Westcott, J. B. Jackson, C. Radlo and N. J. Halas, Phys. Rev. B 66, 155431 (2002).
- (14) K. P. Yuen and K. W. Yu, J. Phys: Condens. Matter 9, 4669 (1997).
- (15) S. J. Oldenburg, J. B. Jackson, S. L. Westcott and N. J. Halas, Appl. Phys. Lett. 75, 2897 (1999).
- (16) J. M. Gérardy and M. Ausloos, Phys. Rev. B 22, 4950 (1980).
- (17) J. M. Gérardy and M. Ausloos, Phys. Rev. B 25, 4204 (1982).
- (18) S. A. Maier, P. G. Kik and H. A. Atwater, Appl. Phys. Lett. 81, 1714 (2002).
- (19) S. A. Maier, P. G. Kik and H. A. Atwater, Phys. Rev. B 67, 205402 (2003).
- (20) R. Quidant, C. Girard, J. C. Weeber and A. Dereux, Phys. Rev. B 69, 085407 (2004).
- (21) S. A. Maier, M. L. Brongersma, P. G. Kik and H. A. Atwater, Phys. Rev. B 65, 193408 (2002).
- (22) J. J. Penninkhof, A. Polman, L. A. Sweatlock, S. A. Maier, H. A. Atwater, A. M. Vredenberg and B. J. Kooi, Appl. Phys. Lett. 83, 4137 (2003).
- (23) D. Sarkar and N. J. Halas, Phys. Rev. E 56, 1102 (1997).
- (24) S. Y. Park and D. Stroud, Phys. Rev. B 69, 125418 (2004).
- (25) J. M. Oliva and S. K. Gray, Chem. Phys. Lett. 379, 325 (2003).
- (26) K. H. Su, Q. H. Wei, X. Zhang, J. J. Mock, D. R. Smith and S. Schultz, Nano Lett. 3, 1087 (2003).
- (27) J. P. Kottmann and O. J.F. Martin, Opt. Express 8, 655 (2001).
- (28) Encai Hao and George C. Schatz, J. Chem. Phys. 120, 357 (2004).
- (29) K. W. Yu and Jones T.K. Wan, Comput. Phys. Commun. 129, 177 (2000).
- (30) D. J. Bergman, Phys. Rep. 43, 377 (1978).
- (31) D. J. Bergman, Phys. Rev. B 19, 2359 (1979).
- (32) J. P. Huang, K. W. Yu and G. Q. Gu, Phys. Rev. E 65, 021401 (2002).
- (33) P. G. Kik, S. A. Maier and H. A. Atwater, Phys. Rev. B 69, 045418 (2004).
- (34) P. B. Johnson and R. W. Christy, Phys. Rev. B 6, 4370 (1972).
- (35) D. P. Peters, C. Strohhöfer, M. L. Brongersma, J. van der Elsken and A. Polman, Nucl. Instr. and Meth. B 168, 237 (2000).
- (36) R. A. Molina, D. Weinmann and R. A. Jalabert, Phys. Rev. B 65, 155427 (2002).
- (37) A. Rubio and L. Serra, Phys. Rev. B 48, 18222 (1993).
- (38) K. W. Yu, P. M. Hui and D. Stroud, Phys. Rev. B 47, 14150 (1993).
- (39) K. W. Yu and K. P. Yuen, Phys. Rev. B 56, 10740 (1997).
Figure Captions
Figure 1: Complex dielectric function of silver particles obtained from Eq. (10). Parameters: nm, others given in the context.
Figure 2: Extinction spectra for an array of dimer with particle diameter nm, at two different spacing . The polarization of the incident light is longitudinal (long-dashed curve) or transverse (medium-dashed curve) to the axis of the dimer. For reference, solid curve is the extinction spectra of isolated and well-dispersed particle collection.
Figure 3: Splitting of the extinction spectra for an array of dimer with particle diameter nm, at four different spacing . Others the same as in Fig. 2.
Figure 4: The resonant peak splitting for an dimer array of diameter nm as the spacing decreases from nm to nm. The lines are guides to the eye.
Figure 5: Unpolarized light extinction spectrum for an array of dimer with particle diameter nm and nm respectively, at different spacing . Inserts in each panel are the poles and residues of the spectral representation.
Figure 6: Normal incidence reflectivity spectra for an array of dimer with particle diameter nm for different spacing , taking volume fraction [(a) and (b)] and [(c) and (d)] respectively.
Figure 7: Normal incidence reflectivity spectra for an array of dimer with particle diameter nm. Others the same as in Fig. 6.