Present address: ]FOM Institute for Atomic and Molecular Physics (AMOLF), P.O. Box 41883, 1009 DB Amsterdam, The Netherlands
Quantitative analysis of directional spontaneous emission spectra from light sources in photonic crystals
Abstract
We have performed angle-resolved measurements of spontaneous-emission spectra from laser dyes and quantum dots in opal and inverse opal photonic crystals. Pronounced directional dependencies of the emission spectra are observed: angular ranges of strongly reduced emission adjoin with angular ranges of enhanced emission. It appears that emission from embedded light sources is affected both by the periodicity and by the structural imperfections of the crystals: the photons are Bragg diffracted by lattice planes and scattered by unavoidable structural disorder. Using a model comprising diffuse light transport and photonic band structure, we quantitatively explain the directional emission spectra. This work provides detailed understanding of the transport of spontaneously emitted light in real photonic crystals, which is essential in the interpretation of quantum-optics in photonic band-gap crystals and for applications wherein directional emission and total emission power are controlled.
pacs:
42.50.Nn, 42.70.Qs, 78.67.Hc, 42.50.Ct, 42.25.Fx, 81.05.ZxI Introduction
Photonic crystals attract much attention both in academia and in industry because they offer exciting ways of manipulating photons Soukoulis01 . Periodic variations of the refractive index in photonic crystals on a length scale of the wavelength of light cause optical Bragg diffraction and organize the photon dispersion relation in bands, analogous to electron bands in semiconductors Bykov75 ; Yab87 ; John87 . Frequency windows, called stop bands, appear in which there are no modes for certain propagation directions. Photonic structures already serve as a base for controlling the propagation of light. Of even greater interest are three-dimensional (3D) photonic crystals that summon novel opportunities in the case of a photonic band gap (PBG) - a frequency range where no modes exist at all. The existence of a gap in the density of photonic modes leads to novel quantum-optical phenomena such as spontaneous emission inhibition and light localization Bykov75 ; Yab87 ; John87 ; Vats02 ; Yang03 .
Control over the radiative decay rate of spontaneous emission is of keen interest for applications, and therefore emission properties of sources such as atoms, dyes, and quantum dots are intensively investigated. According to Fermi’s ‘Golden Rule’, this decay rate is proportional to the local radiative density of states (LDOS) that counts the number of electromagnetic modes wherein photons can be emitted at a specific location of the source. In 3D photonic crystals pronounced variations of the LDOS with frequency are predicted even in the absence of a PBG Sprik96 ; Busch98 , which give rise to angle-independent variations of the total emission. Recently LDOS effects on spontaneous emission have been experimentally demonstrated: Using inverse opals photonic crystals considerable variations of the emission rates in large band widths were obtained in both continuous-wave (cw) total-emission power experiments Koenderink02 and in time-resolved lifetime experiments Lodahl04 . While lifetime experiments provide a direct measurement of decay rates, it is important to quantitatively interpret concomitant emission spectra, for instance, to confirm that light sources inside the crystal are probed. Cw experiments, on the other hand, rely on a comparison of angle-integrated spectra with a homogeneous medium. In the latter case a complete understanding of all angle-dependent effects, that is, Bragg diffraction on the propagation of light is crucial. In this paper such a quantitative analysis is presented.
In contrast to decay rates, emission spectra of sources embedded in photonic crystals are strongly directional Bog97 ; Blanco98 ; Megens99 ; Vlasov00 ; Schriemer01 ; Lin02 . Particular frequency ranges of the spectra are suppressed in certain directions forming stop bands, whose center frequencies and the widths are described by the photon dispersion relation. Besides Bragg diffraction, which is an effect of the order of the periodic structure, light propagating inside the structure also feels disorder: polydispersity, roughness and misarrangements of the building blocks Koenderink04 . This unavoidable disorder affects the interference-induced properties of photonic crystals. Previous work on the effect of disorder on spontaneous emission includes the realization that disorder determines the depth of stop bands Megens99 ; Schriemer01 . Furthermore, the first observations of enhanced emission in the range of first and second-order stop bands were also related to disorder-induced redistribution of emitted photons Bechger04 . While the propagation of light from external light sources has been studied in great detail Koenderink02b ; Galisteo03 ; Koenderink03 , a quantitative explanation of the behavior of light emission from internal sources has lacked sofar.
Here we present strongly frequency-dependent angular distributions of spontaneous emission from a laser dye in polystyrene opals and from quantum dots in titania inverse opals in the frequency range around the first-order Bragg diffraction (L-gap). We compare the data to a theoretical model that unifies effects of structural disorder and photonic crystal properties Koenderink03 . Angle-dependent internal reflection due to the photonic gaps plays a key role in our model. The theory quantitatively explains both the enhancement and the reduction of light along certain propagation directions that were observed experimentally. The excellent agreement confirms that the propagation of light in a photonic crystal is well understood for frequencies around the L-gap. Furthermore, we show that by analyzing the exit emission distributions, one can reveal stop bands in the quantum dot spectra. Such an analysis should be carefully performed before any quantum-optical experiments since it unambiguously proves the effect of the photonic crystal on emission. We finally discuss the applicability of photonic crystals for improvement of the emission efficiency of light sources.
II Experimental details
II.1 Samples
We have studied emission from dyes in polystyrene opals and from quantum dots in titania inverse opals. The polystyrene opals are fcc crystals of close-packed polystyrene spheres prepared from a colloidal suspension by self-assembly. The titania inverse opals are fcc structures of close-packed air spheres in a solid matrix of TiO2. Details of the preparation and characterization of the opals and inverse opals can be found in Ref. Wijnhoven01 . We have studied polystyrene samples with lattice parameters a = 178 3 and 365 5 nm and 8 titania samples with lattice parameters a = 370, 420, 500, 580, and 650 10 nm. All samples have typical dimensions of 2x2x0.2 mm3 and contain high-quality domains with diameters larger than 50 m. These domains have flat faces normal to the 111 crystal axis, which is evident from SEM images. The other crystalline axes are randomly oriented.
The polystyrene opals were doped with the laser dye Rhodamine 6G (R6G) by soaking them for 30 minutes in a dilute solution mol/l) of the dye in ethanol. Afterwards the samples were rinsed in ethanol and dried to remove the dye from the sample surface. To estimate an upper bound to the density of the dye, we assume that the infiltrating solution completely fills the air voids in the opals, and that, in the process of drying, the dye molecules distribute uniformly on the surfaces of the spheres inside the opals. Knowing the volume of the air voids in each unit cell of the opals () and the dye concentration, we arrive at no more than 10 dye molecules per unit-cell inner surface inner-area (for opals with lattice parameter a = 365 nm). While this surface density increases linearly with the lattice parameter , the average distance between the dye molecules remains more than 2 orders of magnitude away from the typical intermolecular distances where reabsorption and energy-transfer processes could play a role Lakowicz . Before emission experiments, we performed a selective bleaching bleaching of the dye at the surface of opal photonic crystals in order to ensure that the emission is recorded only from the bulk of the crystal, and not from the crystal surface Megens99 . The whole surface was illuminated for up to 1 hour by an intense laser beam at the Bragg angle for the pump frequency. At this angle the pump intensity decreases exponentially with depth, which implies that the dye bleaches within the first few crystal layers. However, our experimental results were found to be almost independent of the amount of bleaching, thus indicating that emitters in the bulk of the photonic crystals provide the dominating contribution to the measured emission intensity.
The titania inverse opals were infiltrated for 24 hours with a colloidal suspension of ZnSe-coated CdSe quantum dots Dabbousi97 ; Donega03 in a mixture of chloroform and butanol. Afterwards the samples were rinsed in chloroform and dried. The concentration of the infiltrating solution was mol/l. We used the same estimation in order to get the maximum number of quantum dots per unit cell in the inverse opals. For samples with the largest lattice parameter = 650 nm, this concentration is 15 quantum dots per unit cell and is sufficiently low to avoid energy-transfer processes and reabsorption. In order to minimize oxidation and contamination of the quantum dots, the inverse opals were infiltrated with the quantum dots in a nitrogen-purged glove box and held in a sealed chamber under a 1.7 mbar nitrogen atmosphere during the optical measurements. No bleaching at the surface layers could be performed for the quantum dots, however a detailed analysis of the angular emission data (see below) demonstrates that light emission from the quantum dots from the bulk dominates.
II.2 Experimental set-up
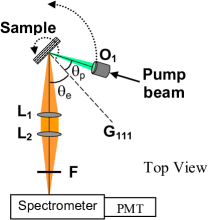
Figure 1 shows the experimental set-up used to measure emission from light sources inside photonic crystals. The sources inside the crystal are excited by a cw Ar-ion laser ( nm) with the power at the sample around 10 W. At this pump power, we do not observe any effects of bleaching of the dye during the emission experiments. To focus the pump beam on the sample surface a fiber-coupled microscope objective is used. The beam is focused to a spot of about 30 m in diameter at an incident angle relative to the surface normal, usually . In order to acquire emission spectra as a function of the detection angle relative to the surface normal, the sample is mounted on a rotation stage. The surface normal is parallel to the 111 reciprocal lattice vector G111. In order to illuminate the same area irrespective of , the fiber-coupled objective () is mounted on the same rotation stage as the sample. In this way, the angle of incidence between the pump beam and the surface normal is kept constant. The advantage over previous experiments, where the sample was rotated with respect to both the pump and detection beams, is that the absolute intensity of the angle-dependent spectra can be reliably compared. The position of the pump spot on the sample is monitored with a microscope. The emitted light is collected within a cone of full width around the angle , imaged on the slit of the spectrometer with 4 nm resolution, and detected by the photomultiplier tube (PMT). The angle-resolved spectra are usually measured at the detection angles from to at intervals of . The measured spectra are corrected for the dark count of the PMT. The shapes of the spectra are confirmed to be independent of the pump intensity, and the emitted intensity is linear with the pump power.
III Diffuse light transport in photonic crystals
III.1 Escape function
In real photonic structures, defects in the arrangement of the building blocks are always present and cause random multiple scattering of light. This means that all light emitted in such photonic structures becomes diffuse on length scales equal to the transport mean free path l, which is often much smaller than the thickness of the sample L. For example, our opals and inverse opals have mean free paths of about 15 m Koenderink00 , whereas the thickness of the samples is about 200 m. Thus, even though photons generated inside a photonic crystal are diffracted by the crystal structure, this effect is smeared out by the random multiple scattering while the photons propagate through the bulk towards the crystal surface. Only at distances from the surface z smaller than l, where the photons emanate ballistically towards the crystal-air interface after a last scattering event, the effect of Bragg diffraction is not destroyed by the scattering. Hence the diffuse emission acquires a directional dependence only when it exits the crystal Koenderink03 .
We consider the ratio of the mean free path to the attenuation length for Bragg diffraction in order to estimate the attenuation of emission caused by Bragg diffraction, as proposed in Ref. Schriemer01 . Since the mean free path l is larger than the Bragg attenuation length (typically Koenderink00 ), an attenuation in the stop band equal to = to is predicted, which is in agreement with our observations. As will be discussed later, the stop-band attenuations are obtained directly from reflectivity measurements, therefore, the mean free path is not an explicit parameter in our theoretical model.
In the present work we investigate directional properties of light emitted by sources from 3D photonic crystals and compare to a model of diffuse light transmission through opaque media Lag89 ; Zhu91 ; Durian94 extended to photonic crystals Koenderink03 . Based on the diffusion theory, the intensity of light with frequency that exits the sample at external angles between and relative to the surface normal is equal to
| (1) |
Here is the total spontaneous emission power that is the spectrum of the light sources integrated over the exit angles . For sources with a low quantum efficiency or with inhomogeneously broadened spectra, is proportional to the LDOS Koenderink02 . The distribution is defined as
| (2) |
where and are average refractive indices outside and inside the sample average refr index , respectively. and are related by Snel’s law. is an angle-dependent internal-reflection coefficient that yields an angle-averaged internal-reflection coefficient :
| (3) | |||
| (4) |
From the diffusion theory, determines the so-called extrapolation length that sets the boundary conditions of the diffuse intensity Lag89 ; Zhu91 ; Durian94 . The normalized function describes the distribution of emission intensity over the escape angles and will be called the ‘escape function’. In absence of reflection effects, the escape distibution tends to the well-known Lambertian distribution of diffuse surfaces.
In random media such as powders or macroporous sponges the internal-reflection coefficient is barely frequency dependent Schuurmans99 , and propagation through the interface is well described by Fresnel reflection model assuming an average refractive index. The angular dependence of the escape function agrees well with experiments on random media Zhu91 ; Durian94 . For highly dispersive photonic crystals, however, Fresnel model cannot describe the internal reflection since light escaping from a depth from the crystal surface is Bragg attenuated for angles and frequencies inside a stop band. We model the strong angle and frequency dependent internal reflection with photonic band structures. At a particular frequency where a stop band is present, the internal reflectivity blocks the emission in the directions of the stop band (a range of ’s related to by the photonic band structure) and therefore reduces the escape function , cf. Eq. (2). The presence of the stop band raises the angle-integrated reflectivity , which enhances the escape function for angles outside the stop band. Thus, the escape function is strongly non-Lambertian in a photonic crystal, showing clear suppressions or enhancements.
III.2 Internal-reflection coefficient
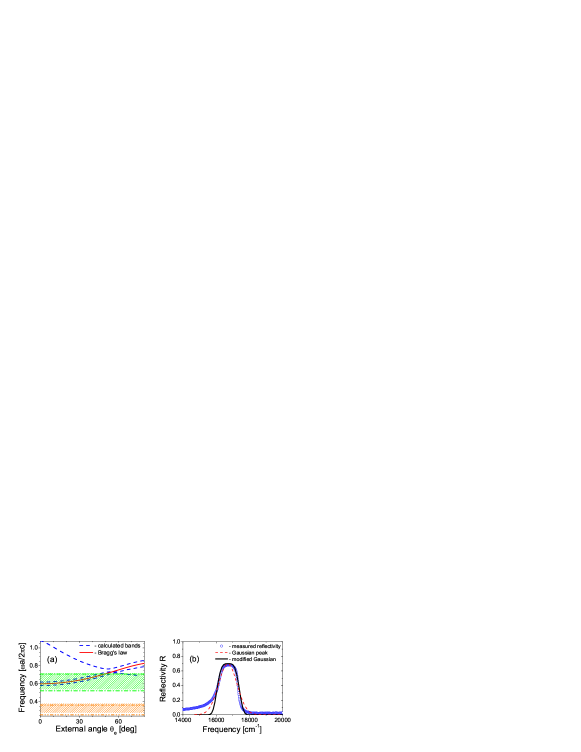
In order to model the internal-reflection coefficient , we have taken into consideration calculated photonic band structures. Figure 2(a) shows the photonic band structure for polystyrene opals calculated along the LU and LK lines in reciprocal space in the frequency range around the first-order stop gap (L-gap) that is due to optical Bragg diffraction by (111) planes parallel to the sample surface. The emission spectrum of R6G is in the low-frequency limit relative to the stop bands of opals with a lattice parameter a = 178 nm (region confined by the orange dash-dot-dotted lines). Consequently, this sample is effectively homogeneous for the emission frequencies, and therefore it can serve as a reliable reference. For these nonphotonic crystals we used Fresnel model in order to describe the internal reflection. In Figure 2(a) one can also see the frequency gap between the two lowest bands (blue dashed curves), which obeys Bragg’s law (red curve) within the frequency range of R6G emission for the opals with a lattice parameter a = 365 nm (region confined by the green dash-dotted lines). Therefore, the angular dependence of the center frequency of the L-gap is modelled with the red curve, i.e.: . To investigate the frequency dependence of the reflectivity, we have performed reflectivity experiments on the samples using external incident plane waves, since this technique reveals the center frequencies and the widths of stop bands Thijssen99 ; Galisteo03 . Figure 2(b) shows a normal-incidence reflectivity spectrum measured from an opal with the lattice parameter a = 365 nm (blue circles). The reflectivity peak is not fitted well with a Gaussian (red dashed curve). As an improved model, we propose a modified Gaussian (Fig. 2(b), black curve):
| (5) |
where is the magnitude of the internal-reflection coefficient and is the width parameter. This peak shape is seen to fit the measurements well for frequencies 16000 cm-1. At frequencies below the stop band, i.e. below 16000 cm-1 for these particular samples with a = 365 nm, a deviation from the model is observed. We attribute this deviation to Fresnel reflection, which is important only in the low-frequency limit and therefore is not relevant for the escape function of photonic samples. The width of the L-gap hardly varies with within the range of the dye emission, therefore it is taken to be constant in our model. The magnitude of the internal-reflection coefficient decreases with because at larger internal angles the path length for the light to become Bragg attenuated increases with , and this increases the probability of scattering at . The value of at is taken from the normal-incidence reflectivity experiments. Thus, we have: and , see Fig. 2(b).
Emitted light that is scattered within a distance towards the exit interface can also be redirected by Bragg diffraction by the sets of planes, which are oriented at to the (111) planes and the surface normal. The internal-reflection coefficient for Bragg diffraction by lattice planes is modelled similarly to . Taking into account that we measure emission from many randomly-oriented crystal domains in azimuthal directions, the reflectivity is averaged over the azimuthal angles between the LK and LU lines in reciprocal space, yielding:
| (6) |
The magnitude is modelled as with . The total internal-reflection coefficient is calculated as a sum of the and modified Gaussian peaks. We expect this model of the angle- and frequency-dependent internal reflectivity to capture the essential frequency dependence of the first-order photonic stop bands in polystyrene opals.
In the case of the titania inverse opals we apply the same escape model to explain our experimental data. However, in calculating the internal-reflection coefficient , Bragg diffraction from other lattice planes must also be included. This difference compared to polystyrene opals appears since titania inverse opals are more strongly photonic and the measurements were performed at higher reduced frequencies (). Moreover, the resulting stop bands occur at lower detection angles in these crystals than in the polystyrene opals, as a consequence of the lower average refractive index. Therefore Bragg’s law is not a sufficient approximation and is not used to model the angular dependence of the stop bands in the titania inverse opals. Instead, the full band structure model is employed, in which we take into account multiple Bragg wave coupling Schriemer01 ; vDriel00 . For the inverse opals, this model was already successfully tested on diffuse transmission experiments Koenderink03 .
IV Results and Discussion
IV.1 Spontaneous emission of R6G in polystyrene opals
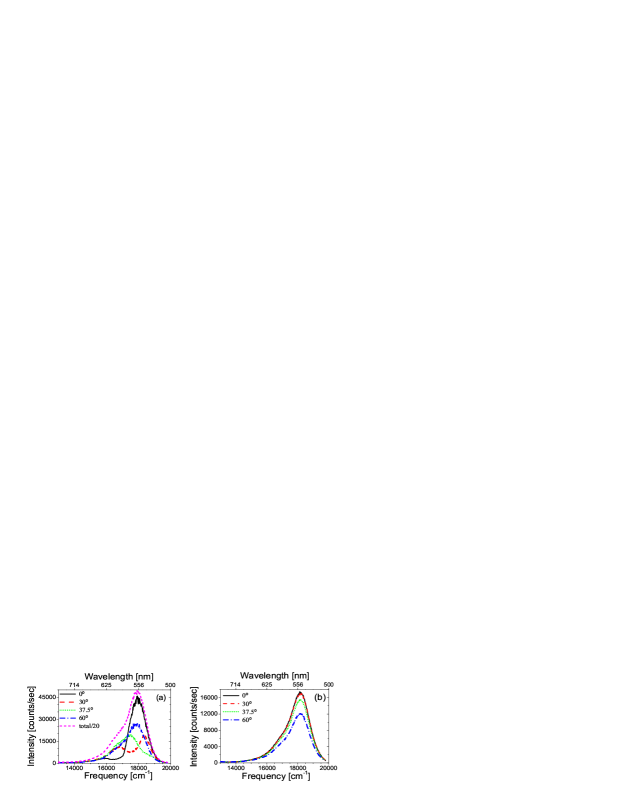
Reflectivity measurements at normal incidence of polystyrene opals (Fig. 2(b)) reveal that the relative width of the first-order stop band is . For opals with a lattice parameter a = nm this means a stop band in the range 16100 - 17300 cm-1 for light escaping the crystal normally to the surface. The dye R6G emits in the range of 15000 - 20000 cm-1, and hence we expect to observe directional-dependent emission of the dye from the opals with a = nm. Figure 3(a) displays the emission spectra at selected detection angles for such doped opals. It is clearly seen that the shapes of the spectra are affected by the photonic crystal. The emission is suppressed by the crystal for in the spectral range from 16000 to 17500 cm-1. With increasing angle the low-frequency parts of the emission recover, and the suppressed emission range shifts to higher frequencies, as expected from Bragg’s law for a photonic stop band from a single set of lattice planes. In contrast, the shape of the spectra from an opal with a lattice parameter a = nm remains unchanged (Fig. 3(b)). The sample is not photonic for the frequency range considered: the frequencies of R6G emission lie far below the first-order stop band in the opal with this lattice parameter.
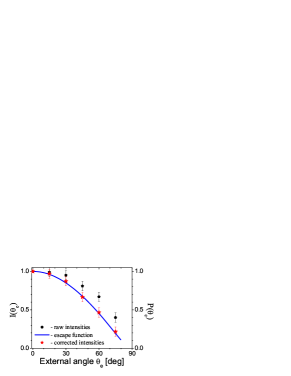
Before studying spontaneous emission from photonic samples we have verified the applicability of the above-mentioned model of diffuse light transport on the nonphotonic, reference samples. We use Fresnel reflection to describe the angular-dependent internal-reflection coefficient, taking an average refractive index , which is derived from the polystyrene filling fraction in opals and the refractive index of polystyrene n = . We record the intensity at the maximum of the emission spectrum as a function of the exit angle relative to the measurement at . The relative intensity is compared to the escape function in Figure 4. While the expected decrease with angle is observed, it is clear that the calculated intensity differs systematically from the measured data. This deviation appears to be caused by an angle-dependent detection efficiency as a result of an increase with of the projection of the spectrometer slit on the sample. Correcting the measured intensity for the detection efficiency (see Appendix) yields the corrected intensity displayed as red symbols in Fig. 4. The agreement between the corrected intensity and the calculated escape function is excellent. With the proper account of the detection efficiency, the angular distribution of emission escaping the reference samples is thus fully understood. In all experimental data presented in the remainder of this paper the detection efficiency has been included.
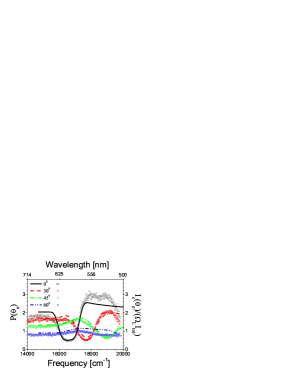
In the case of the photonic samples the exit distribution of emission strongly depends on the frequency as mentioned above: . The total emission spectrum is determined by discretely summing the angle-resolved spectra weighted by to approximate the integration over solid angle. The spectra from Figure 3(a) divided by the total emission spectrum are plotted in Figure 5 (symbols) together with the calculated escape function (curves). We observe a good agreement between our experiment and theory. The escape function hardly varies with frequency in the low-frequency region 15600 cm-1, while it still depends on the detection direction. In contrast, at higher frequencies strong variations are seen compared to the low-frequency range. At the exit angle , the escape function is significantly reduced in the spectral range from 16000 to 17500 cm-1 by the stop band centered at = 16700 cm-1 due to internal Bragg diffraction, which is described by the term in Eq. (2). The change of the center frequency as well as the decrease in the attenuation of emission inside the stop band with increasing exit angle are well described in our model by the frequency and angular dependent internal-reflection coefficient . At , the stop band has moved out of the spectral range of R6G.
Figure 5 also shows a peculiar feature: the frequency ranges where the emission is inhibited along certain directions, adjoin with the ranges where emission is increased along the same directions. Such an increase appears at the blue side of the stop band at and , and at the red side of the stop band at and . This enhanced escape probability in the frequency range 16000 - 19500 cm-1 along directions that do not coincide with the stop band is reflected in our model for (Eq. (2)) as an increase of the angle-averaged internal-reflection coefficient . The good agreement between experiments and theory confirms a qualitative attribution of such enhancements to diffuse escape effects Bechger04 . Moreover it unambiguously demonstrates that our experimental observation of the emission enhancement is not due to Bragg standing wave effects proposed in Ref. Galstyan00 , but is related to diffusion of light.
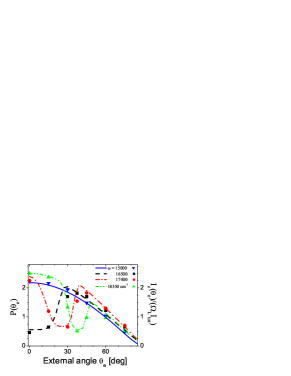
In Figure 6 we compare the experimentally determined intensity distributions (symbols) for several fixed frequencies with the calculated ones (solid curves) as functions of the exit angle . The experimental values of were obtained by dividing the emission by the total emission spectrum and correcting for the angular aperture of the collecting lens . For the frequency = 15000 cm-1, below the stop band, the distribution follows the Lambertian distribution and is similar to the exit distribution from the nonphotonic sample (Fig. 4). For the frequencies above the red edge of the stop band we observe strongly non-Lambertian behaviour. For the frequency = 16500 cm-1 emission is suppressed relative to the Lambertian distribution in the range of the exit angles from to . This range moves to larger exit angles for the frequency = 17400 cm-1 in qualitative agreement with Bragg’s law. For = 18350 cm-1 the suppression observed around is preceded by a considerable increase of emission in the angle range to . A qualitative explanation of this effect is as follows. Some escape directions are blocked by internal Bragg diffraction, and diffusion eventually distributes this back-reflected light along the remaining directions. Thus, light is more likely to exit the crystal along these allowed directions. From Figures 5 and 6 we conclude that the escape function is in excellent agreement with the measured angle-dependent spectra. To the best of our knowledge, the current work provides the first quantitative modelling of spontaneous emission spectra in 3D photonic crystals.
IV.2 Spontaneous emission from quantum dots in titania inverse opals
Titania inverse opals possess a larger relative width of the first-order stop band () than the polystyrene opals owing to their inverse structure and high refractive index contrast (). The concomitant large modifications of the LDOS makes the inverse opals very attractive for control of propagation and spontaneous emission of light Koenderink02 ; Lodahl04 . Figure 7 shows emission spectra of CdSe quantum dots in a titania inverse opal with lattice parameter nm for selected detection angles . No significant changes in the spectral shapes due to internal Bragg diffraction are observed, because the relative spectral width of the light sources () is considerably smaller than the width of the stop band of the photonic crystal. This shows that the escape distribution does not vary significantly within the frequency range of the quantum dot spectrum. In contrast, a strong angular dependence of the emission intensity is apparent in Fig. 7. As a consequence, effects of Bragg diffraction are most convincingly observed by recording the angular dependencies at the spectral maxima of the emission spectra.
In Figure 8(a) we present escape distributions from titania inverse opals with lattice parameters and 420 nm at frequency cm-1, and with a lattice parameter nm at cm-1. Both measured (symbols) and calculated (curves) values are shown. For the crystal with the lattice parameter nm, for which the center frequency of the quantum dot spectrum lies below the stop band, the escape function follows the Lambertian distribution. A large deviation from the Lambertian distribution is observed for the quantum dot emission from the crystals with the other two lattice parameters. In the crystals with nm, the emission is strongly reduced in the range of the angles from to , and it is enhanced at higher exit angles. For the crystals with nm, the suppression is shifted to the range of to , as expected for photonic gaps at higher reduced frequency (), and in excellent agreement with our theoretical predictions. The stop-band ranges are noticeably wider than that in the case of the polystyrene opals (Fig. 6), which is due to a wider frequency range of the stop band in the titania inverse opals. To the best of our knowledge, this is the first demonstration of photonic crystal bands in the emission spectra of confined excitons in quantum dots.
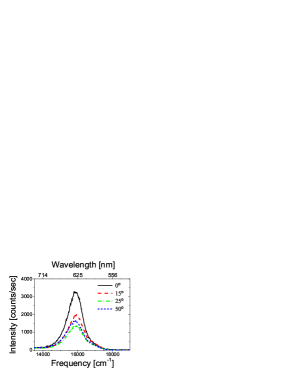
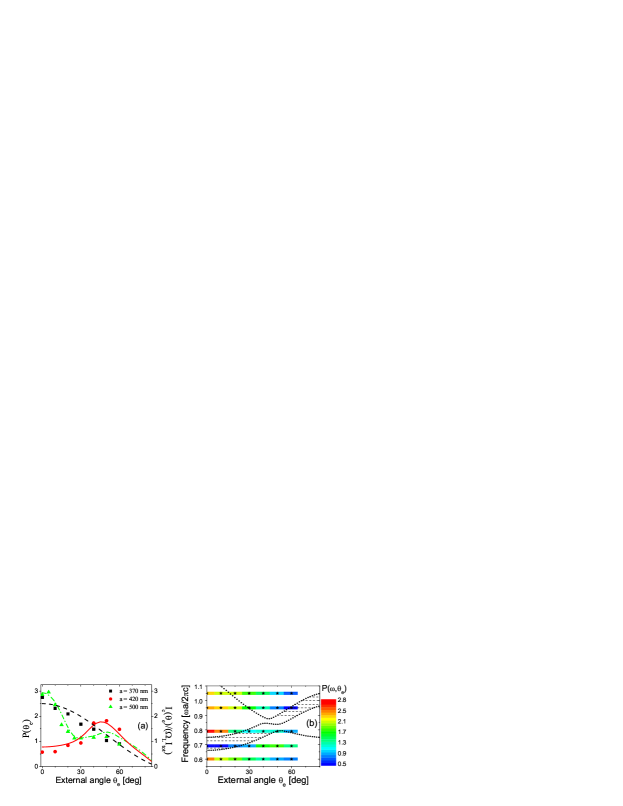
Figure 8(b) shows the photonic band structure for a titania inverse opal. The hatched regions indicate the stop band caused by Bragg diffraction by (111) lattice planes. In the angular range from to 550, multiple Bragg wave coupling from (111) and (200) diffracted waves takes place vDriel00 ; Schriemer01 . The horizontal bars represent the reduced center frequencies of the quantum dot emission from the inverse opals with the lattice parameters a = 370, 420, 500, 580, and 650 nm. The colours of the bars indicate the measured values of the escape function . For reduced frequencies around the stop bands, it is seen that inhibited escape probability appears in the angular ranges of the stop bands, whereas enhanced escape is found outside the stop bands. Hence, the photonic crystals are seen to ‘funnel’ light along certain allowed directions.
For experiments on quantum dot emission in photonic crystals, the good agreement between the experimentally obtained escape distributions and the calculated ones confirms that the light emanating from inside the crystals is diffuse. It also confirms that the observed emission is dominated by sources inside the bulk of the crystal. We can exclude that light sources on the sample surface contribute significantly: their emission would give rise to an angle-independent component of the intensity that is not observed. Furthermore, observation of stop bands in emission spectra is important for successful lifetime experiments or other quantum-optical studies of light sources in photonic crystals. The stop bands are evidence that the emission from the light sources is strongly coupled to the photonic crystals, and are a prerequisite for time-resolved experiments of changes in the emission decay rate caused by a modified LDOS Lodahl04 .
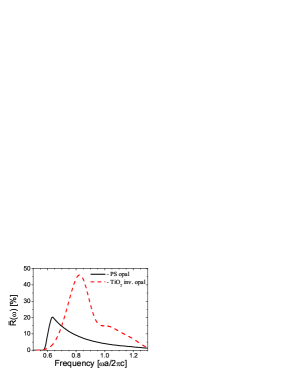
Based on the close accordance of the experiments with the model, we can extract the angle-averaged internal-reflection coefficient . Figure 9 shows that is as large as for the titania inverse opals and up to for the polystyrene opals. The internal-reflection coefficient varies strongly with frequency in contrast to the frequency-independent in random media. The coefficient increases with solid angle for Bragg reflection, starting from the low-frequency edge of the L-gap. For the opals, the maximum occurs at the high-frequency edge of the L-gap, where the reflecting stop bands extend over the largest solid angle Thijssen99 . For the inverse opals, the maximum occurs at higher reduced frequencies in the range of multiple Bragg wave coupling () Schriemer01 . The shoulder near is attributed to the inclusion of (200) reflection condition in our model. In a more elaborate escape-model with additional diffraction conditions, we may expect additional peaks in the angle-averaged reflection coefficient at even higher frequencies. Since the inverse opals interact stronger with light than the opals, their stop bands are wider and hence the angle averaged reflectivity is larger, in agreement with our observations.
A closer consideration of the reflectivity coefficients can serve to optimize the spontaneous emission yield of light sources (atoms, dyes or quantum dots) embedded inside thick photonic crystals (). Such an optimization can be achieved either via the excitation of the sources, via their emission, or both. First, the excitation efficiency can be increased by realizing that increased escape probability also implies an increased probability for excitation light to enter a photonic crystal. Thus, by tuning an excitation beam to frequencies and angles of high escape, the combined action of diffusion and Bragg diffraction retain relatively more excitation light inside the sample, thus increasing the probability for spontaneous emission of the embedded light sources. Secondly, spontaneously emitted radiation is efficiently channelled out of the sample along particular directions. This occurs when the lattice parameter of the photonic crystal is chosen such that the emission frequencies are in the range of enhanced . A clear example of enhanced escape is apparent in Fig. 5 at near 18000 cm-1. In the ultimate case of a photonic band gap, it has even been predicted that the diffuse emission is extremely directional, see Ref. Koenderink03 . Thirdly, one can envision situations where both excitation and emission are enhanced: In Fig. 8(b) enhanced escape probability occurs both at and and at and . Thus, by tuning the excitation to the former condition and the emission to the latter, the spontaneous emission yield is expected to be enhanced by at least a factor of two. Further improvements should be feasible in photonic crystals with even larger .
V Conclusions
We have presented experimental data on angular resolved emission from light sources embedded in efficient 3D photonic crystals. The experiments were compared in detail to a recently developed model of light transport in real photonic crystals that are influenced by disorder. Our model is based on diffusion of light due to scattering (disorder) combined with angle- and frequency-dependent internal reflections (order). Good quantitative agreement between experiment and theory confirms that the details of the emission spectra are determined by the intricate interplay of order and disorder. Properties of the stop bands, such as their frequency range, magnitude, and angular dependence, are extracted from the experiment by analyzing the emission escape function. The enhanced escape probability for emission along directions outside the stop bands is explained by the angle-averaged internal-reflection coefficient . The diffuse and angular-dependent nature of light escaping from the photonic crystals proves that the light comes from emitters inside the crystals. By measuring the escape functions of the quantum dot emission from the titania inverse opals, we have for the first time revealed clear stop bands in the quantum dot emission spectra, confirming that the confined excitons experience optical confinement. The quantitative agreement between experiment and theory demonstrates that light propagation and spontaneous emission in real 3D photonic crystals is well understood.
VI Acknowledgments
We thank Floris van Driel and Daniël Vanmaekelbergh (University of Utrecht) for preparation of the quantum dots, Léon Woldering for photonic crystal preparation, Arie Irman and Karin Overgaag for experimental assistance, and last but not least Femius Koenderink for band-structure calculations and discussions on escape functions. This work is a part of the research program of the Stichting voor Fundamenteel Onderzoek der Materie (FOM) , which is financially supported by the Nederlandse Organisatie voor Wetenschappelijk Onderzoek (NWO) .
VII Appendix: Model of detection efficiency of emission set-up
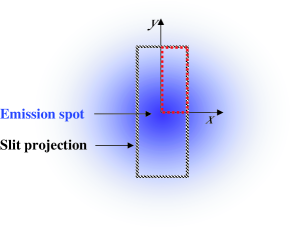
The aim of this appendix is to explain the difference between the calculated escape distribution and the measured intensity illustrated in Fig. 4. This difference appears because the width of the projection of the collection optics (the spectrometer slit) on the sample increases with the angle . The sample surface is placed in the focus of the collecting lens , the spectrometer slit is in the focus of the imaging lens (cf. Fig. 1). The only emission collected emanates from the region confined by the slit projection on the sample surface, see Fig. 10. This means that the spectrometer collects light from a larger region on the surface at larger detection angles, and that the measured angle-dependent intensity should be corrected for the detection efficiency of the set-up. The detection efficiency is modelled as a ratio of the intensity collected from the surface region within the slit projection (Fig. 10) at detection angle to the intensity collected at normal angle:
| (7) |
We take into account that the integration runs over a quarter of the slit, as is the half-width of the slit projection, and are the half-width and the half-height of the slit projection at , respectively. Typical values of and in the experiments are 50 and 1 mm. It is assumed that the intensity of diffuse light on the sample surface around the pump beam varies as , where is the distance from the axis of the pump beam along the sample surface, and is the mean free path of light in the sample.
References
- (1) C.M. Soukoulis, ed., Photonic Crystals and Light Localization in the Century (Kluwer, Dordrecht, 2001).
- (2) V.P. Bykov, Sov. J. Quant. Electron. 4, 861 (1975).
- (3) E. Yablonovitch, Phys. Rev. Lett. 58, 2059 (1987).
- (4) S. John, ibid. 58, 2486 (1987).
- (5) N. Vats, S. John, and K. Busch, Phys. Rev. A 65, 043808 (2002).
- (6) Y. Yang, M. Fleischhauer, and S.-Y. Zhu, Phys. Rev. A 68, 043805 (2003).
- (7) R. Sprik, B. A. van Tiggelen, and A. Lagendijk, Europhys. Lett. 35, 265 (1996).
- (8) K. Busch and S. John, Phys. Rev. E 58, 3896 (1998).
- (9) A.F. Koenderink, L. Bechger, H.P. Schriemer, A. Lagendijk, and W.L. Vos, Phys. Rev. Lett. 88, 143903 (2002).
- (10) P. Lodahl, A.F. van Driel, I.S. Nikolaev, A. Irman, K. Overgaag, D. Vanmaekelbergh, and W.L. Vos, Nature, 430, 654 (2004).
- (11) V.N. Bogomolov, S.V. Gaponenko, I.N. Germanenko, A.M. Kapitonov, E.P. Petrov, N.V. Gaponenko, A.V. Prokofiev, A.N. Ponyavina, N.I. Silvanovich, and S.M. Samoilovich, Phys. Rev. E 55, 7619 (1997).
- (12) A. Blanco, C. Lòpez, R. Mayoral, H. Miguez, F. Meseguer, A. Mifsud, and J. Herrero, Appl. Phys. Lett. 73, 1781 (1998).
- (13) M. Megens, J.E.G.J. Wijnhoven, A. Lagendijk, and W.L. Vos, J. Opt. Soc. Am. B 16, 1403 (1999).
- (14) Y.A. Vlasov, M. Deutsch, and D.J. Norris, Appl. Phys. Lett. 76, 1627 (2000).
- (15) H.P. Schriemer, H.M. van Driel, A.F. Koenderink, and W.L. Vos, Phys. Rev. A 63, 011801 (2001).
- (16) Y. Lin, J. Zhang, E.H. Sargent, and E. Kumacheva, Appl. Phys. Lett. 81, 3134 (2002).
- (17) A.F. Koenderink and W.L. Vos, arxiv.org/abs/physics/0406052 (2004).
- (18) L. Bechger, P. Lodahl, and W.L. Vos, submitted (2004); L. Bechger, Ph.D. thesis, University of Twente, ISBN: 90-365-1991-8 (2003) (available at our web site).
- (19) A.F. Koenderink, P.M. Johnson, J.F. Galisteo Lòpez, and W.L. Vos, C. R. Physique 3, 67 (2002).
- (20) J.F. Galisteo Lòpez, E. Palacios-Lidòn, E. Castillo-Martìnez, and C. Lòpez, Phys. Rev. B 68, 115109 (2003).
- (21) A.F. Koenderink and W.L. Vos, Phys. Rev. Lett. 91, 213902 (2003); J. Opt. Soc. Am. B, in press (2005).
- (22) J.E.G.J. Wijnhoven, L. Bechger, and W.L. Vos, Chem. Mater. 13, 4486 (2001).
- (23) In an fcc structure consisting of spheres of radius r and having a lattice parameter a equal to , the inner surface per unit cell A equals . Therefore the surface density of the dye is proportional to .
- (24) J.R. Lakowicz, Principles of Fluorescence Spectroscopy (Second Edition), Kluwer, New-York, (1999).
- (25) Bleaching is a photoinduced damage of dye molecules (fluorophores). Typically, it happens because of oxidation of the fluorophore that damages the molecule permanently.
- (26) B.O. Dabbousi, J. Rodriguez-Viejo, F.V. Mikulec, J.R. Heine, H. Mattoussi, R. Ober, K.F. Jensen, and M.G. Bawendi, J. Phys. Chem. B 101, 9463 (1997).
- (27) C. de Mello Donega, S.G. Hickey, S.F. Wuister, D. Vanmaekelbergh, and A. Meijerink, J. Phys. Chem. B 107, 489 (2003).
- (28) A.F. Koenderink, M. Megens, G. van Soest, W.L. Vos, and A. Lagendijk, Phys. Lett. A 268, 104 (2000).
- (29) A. Lagendijk, R. Vreeker, and P. de Vries, Phys. Lett. 136A, 81 (1989).
- (30) J.X. Zhu, D.J. Pine, and D.A. Weitz, Phys. Rev. A 44, 3948 (1991).
- (31) D.J. Durian, Phys. Rev. E 50, 857 (1994).
- (32) The average refractive index of a photonic crystal is estimated as: , where is the volume fraction of the solid material, and are refractive indices of the solid material and air, respectively.
- (33) F.J.P. Schuurmans, D. Vanmaekelbergh, J. van de Lagemaat, and A. Lagendijk, Science 284, 141 (1999).
- (34) M.S. Thijssen, R. Sprik, J.E.G.J. Wijnhoven, M. Megens, T. Narayanan, A. Lagendijk, and W.L. Vos, Phys. Rev. Lett. 83, 2730 (1999).
- (35) A.G. Galstyan, M.E. Raikh, and Z.V. Vardeny, Phys. Rev. B 62, 1780 (2000).
- (36) H.M. van Driel and W.L. Vos, Phys. Rev. B 62, 9872 (2000).