Gas gain on single wire chambers filled with pure isobutane at low pressure
Abstract
The gas gain of single-wire chambers filled with isobutane, with cell cross-section 12x12 mm and wire diameters of 15, 25, 50 and 100 m, has been measured at pressures ranging 12-92 Torr. Contrary to the experience at atmospheric pressure, at very low pressures the gas gain on thick wires is higher than that on thin wires at the same applied high voltage as was shown in [1]. Bigger wire diameters should be used in wire chambers operating at very low pressure if multiple scattering on wires is not an issue.
keywords:
first Townsend coefficient, low pressure, gas gain, isobutaneE-mail address: davydov@triumf.ca (Yuri Davydov)
, , ,
1 Introduction
Electric field in the cylindrical wire chamber is defined as
| (1) |
where a and b are the wire and cathode radii,
and r is the distance from the wire center. Electric field drops
very fast with distance from the wire surface and at normal conditions
most gas amplification takes place within 3-5 wire radii. At
atmospheric pressure small diameter wire requires much lower applied
high voltage in order to reach the same gas gain as on larger diameter
wire. This is the reason why small diameter wires are used in wire
chambers. The situation changes when gas pressure decreases to the
level of a few tens of Torr. As was recently shown [1], in
chambers with the same geometry the gas gain becomes higher on a thick
wire compared to that on a thin wire at the same applied high
voltages.
The present work was done to verify the gas gain on single
wire chambers as a function of wire diameters and gas pressure.
2 Experimental setup
Tests were carried out with single-wire chambers. The chambers have a cell cross section 12x12 mm and a wire length of about 20 cm. Chambers are made of aluminum alloy with double sided aluminized mylar on two sides serving as cathodes. Chambers with wire diameters 15, 25, 50 and 100 m have been tested. The chambers were placed in an aluminum vacuum box. The box was pumped out and filled with pure a few times, and finally it was pumped out to the required pressure for the test measurements. The measurements have been done at pressures of 92, 52, 32 and 12 Torr. The pressure was monitored with a pressure gauge with a precision of 1 Torr. Chambers were irradiated with an 55Fe x-ray source collimated with a 1.6 mm thick G10 plate with 3 mm hole. This plate was placed directly over the mylar cathode with the hole close to the cell edge. Signals from the chambers were self triggered and fed into a LeCroy 2249W ADC, with a gate width of 1 s for all tests.
3 Results and discussion
55Fe x-ray photons have energy 5.9 keV (80%) and
6.49 keV (20%). The x-rays undergo only photoabsorbtion in
pure at these energies. The released electrons have
a range of about 700-750m in pure at
atmospheric pressure. At 92 Torr the range becomes about 6 mm, while
it is about 11 mm, 17 mm and 45 mm at 52, 32 and 12 Torr respectively.
At low pressure, there is a high probability that electrons will leave
the 12x12 mm cell before they lose all their energy. Some of the
electrons lose all their energy within the cell, but do not give a
full avalanche if the ionization electrons originate close to the wire
surface. As a result, the measured charge spectrum has a continuous
distribution with a full photoabsorption peak at the high energy end
from the electrons which stop inside of the cell and give a full
avalanche.
The total x-ray photoabsorption results in 5.9 keV
energy loss inside of a cell. The average energy required to produce
an ion-electron pair in pure is 23 eV [2]. Thus, the photoabsorption of 5.9 keV x-ray
photons results in about 256 electrons in pure
. This number will be used to calculate the gas gain
in the test chambers.
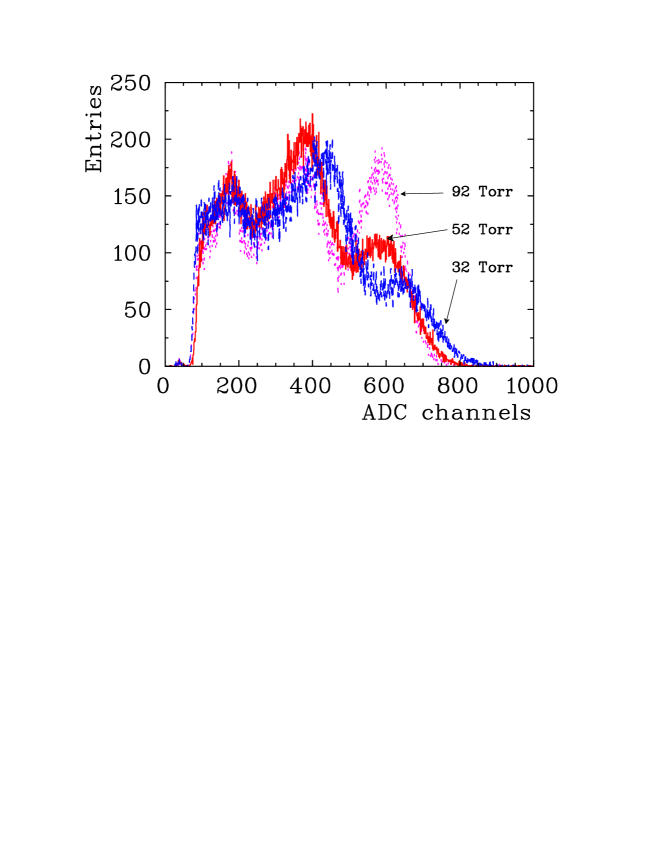
Figure 1 presents charge distributions
measured on the 25 m wire at pressures of 92, 52 and 32 Torr.
Spectra were taken at applied high voltages of 1150 V, 1000 V and
950 V respectively. Gas gains at these applied voltages are in the
range 9000-13500. As mentioned earlier the spectra have continuous
distributions with full photoabsorption peaks at the end. The
fraction of events in the photoabsorption peak, and its resolution,
drop with decreasing pressure. All charge distributions were fit with
an exponential function to describe the tail of continuous charge
distribution combined with a gaussian for the photoabsorption peak.
The gaussian function gives the photoabsorption peak center and its
sigma. The results of the gaussian fit were used to calculate the gas
gain.
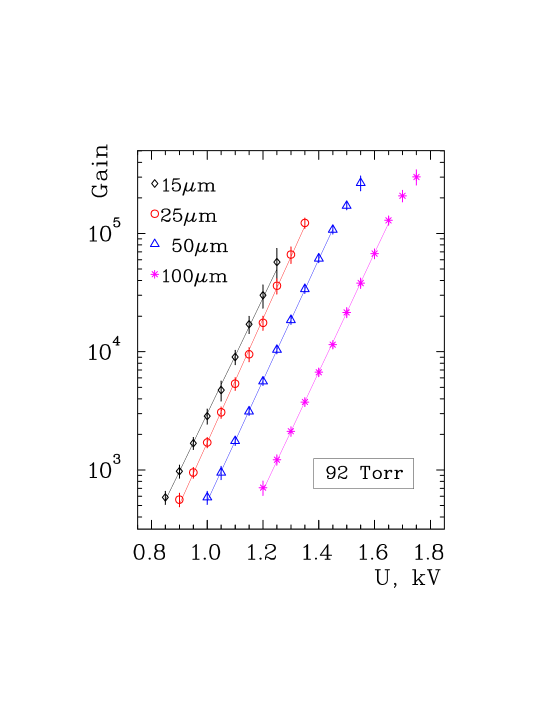
Figure 2 shows the gas gain as a function of
applied voltage on all four tested wires at a gas pressure of 92 Torr.
Here and on the next two figures the straight lines are exponential
fits of experimental points. One can see that at 92 Torr the thinner
wires have higher gas gain at the same applied high
voltage. Resolution is much poorer on the thin wires, which resulted
in fewer points on the 15 m and 25 m wires.
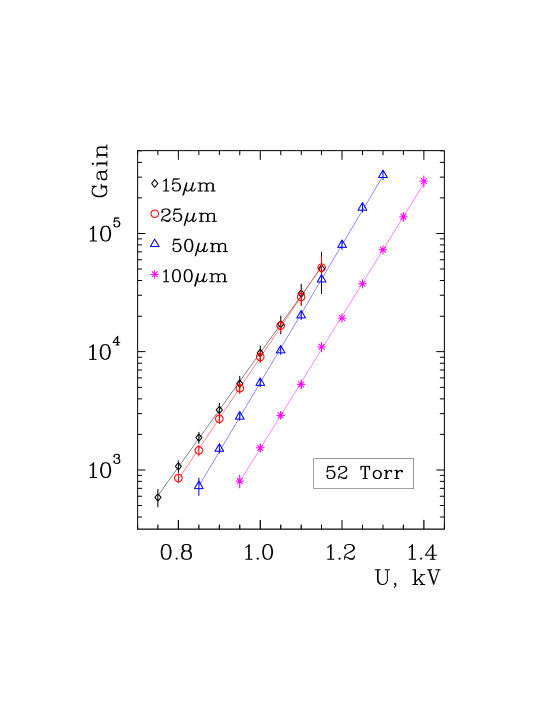
At a pressure of 52 Torr (fig. 3) there are
visible changes compared with 92 Torr. The smaller the wire diameter
the smaller the slope of gas gain versus high voltage dependence. At
lower voltages, the gain is higher on the 15 m wire compared with
that on the 25 m wire. Above 1000 V, gain on the 15 m
becomes equal or even lower than on the 25 m wire and even
approaches that on the 50 m wire.
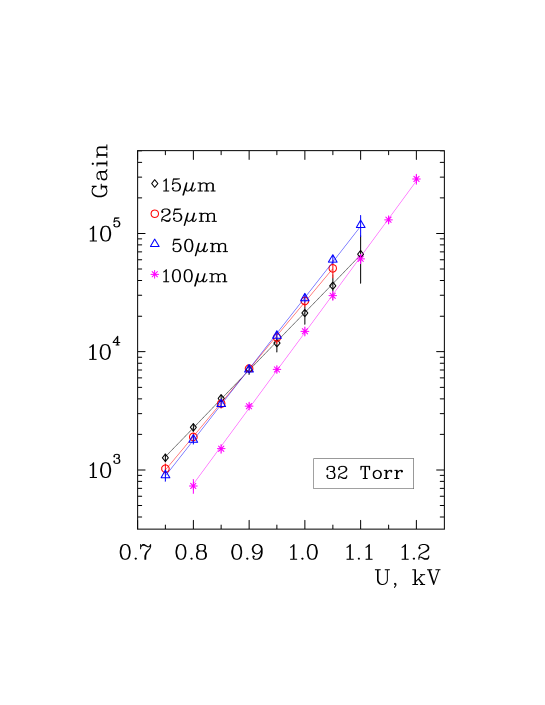
Figure 4 depicts gas gains on the tested wires
at a pressure of 32 Torr. Resolution becomes very poor here,
especially for the 15 and 25 m wires. As in the two previous
cases, the gas gain is higher on thinner wires at low voltages, but
that changes very quickly. At 900 V gains on the 15, 25 and 50 m
are already equal and eventually reverse the order compared with
higher pressure. Above 1050 V the gain on the 100 m wire almost
reaches that on the 15 m wire.
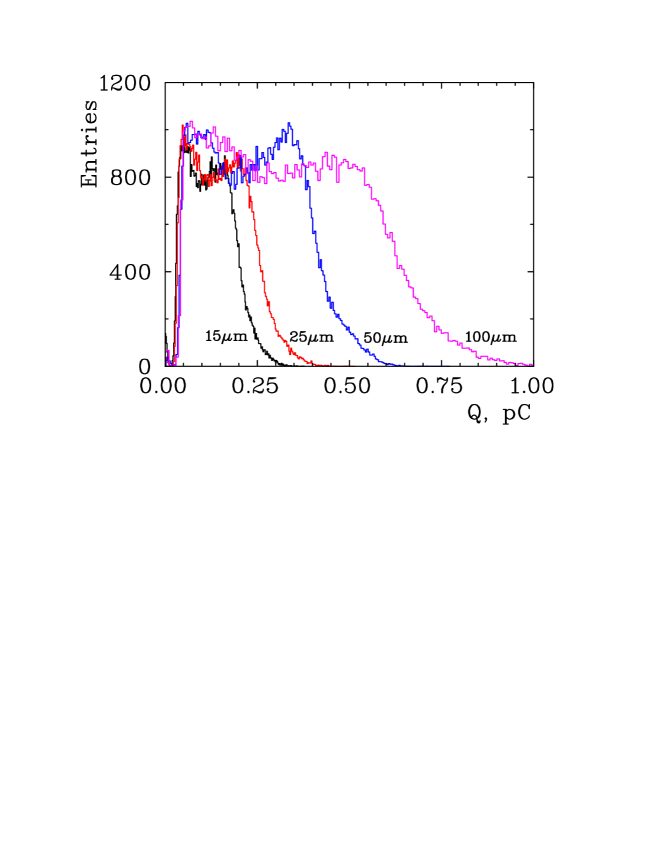
Further lowering of pressure results in very poor resolution
and the full absorption peak disappears. At 12 Torr, charge spectra
have been taken on all four wires with 800 V applied voltage. Spectra
were presented in [1] and are shown here in
fig.5. There are no indications of full absorption
peaks on any wires. The edges of the charge distributions do indicate
gas gain on each wire. One can see that at 12 Torr and 800 V the gas
gains are higher on the bigger diameter wires.
Data taken at low pressure showed that for a given wire
diameter, the resolution of the photoabsorption peak degrades with
increasing high voltage and decreasing gas pressure. Thin wire has
worse resolution at the same pressure and applied high voltage
compared to thick wire.
In [1] an electric field was introduce
where electrons gain enough energy to ionize atoms over the mean free
path , i.e. , where
[3]. Here is the gas
ionization potential, is the total cross section for electron
collision with atoms, n is the density of gas atoms, e is
the electron charge. Above this electric field strength the first
Townsend coefficient has very weak dependence on electric field and is
defined mainly by the electron’s mean free path.
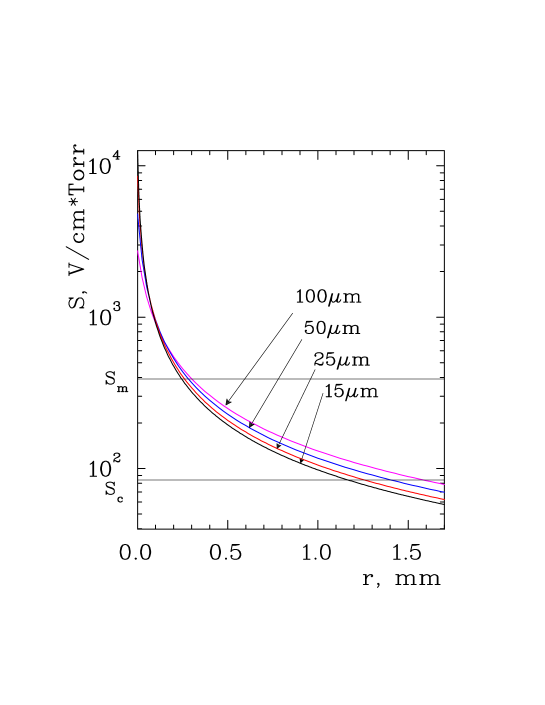
One can understand the gas gain behaviour, shown in
fig.5, by looking at the reduced electric field
strength distributions near the wires and taking into account the
behaviour of the first Townsend coefficient at high electric field,
proposed in [1]. Figure 6 shows the
reduced electric fields of all four tested wires as a function of
distance from the wire surfaces. Pressure is 12 Torr and 800 V is
applied to each chamber. The critical reduced electric field for pure
, where the avalanche starts, has been estimated
using data from [4] and found to be . Electric field for pure
at 12 Torr with , total cross section
[5] and 10.8 eV an
ionization potential [2], is estimated to be . These values of and the reduced field
are shown as well. The
avalanches start farther from the surfaces of thick wires. Everywhere
at field thicker wires have higher reduced electric field
that results in a higher first Townsend coefficient. Beyond reduced
field the first Townsend coefficient has very weak dependence
on electric field and stays practically the same for all wires even
though the thinner wires have much higher electric field there. Such
a behaviour results in higher total gas gain on thicker wires.
The poor energy resolution in our measurements was primarily
caused by the small cell size (12x12 mm cross section) of the single
wire chambers which were used in the test measurements. One would
need to use chambers with bigger cell size to improve resolution.
It is interesting to notice from the comparison of
fig.2-4 that saturation is visible
only on 50 and 100 m wires at pressure 92 Torr. The highest gain
there is about 3 which corresponds to a collected charge
of about 12 pC. The reason for this is that photoelectrons released
by 55Fe x-rays have much longer range at low pressure and many
avalanches are distributed along the wire. Recall, that at
atmospheric pressure, saturation starts when the total charge in the
avalanche exceeds 1 pC.
4 Conclusion
We have measured gas gain on 15, 25, 50 and 100 m
diameter wires in single-wire chambers filled with pure
at pressures in the range 12-92 Torr. Our results
clearly demonstrate that at low pressures, gas gain becomes higher on
thick wires than on thinner wires, in wire chambers having the same
geometry and applied high voltage. The gas gain versus high voltage
dependence slopes are smaller on the smaller diameter wires at low
pressure. This is a consequence of the fact that at high electric
field strength the first Townsend coefficient is limited by the
electron’s mean free path.
Bigger wire diameters should be used in wire chambers
operating at very low gas pressures where scattering on the wires is
not an issue. Specific recommendations should be addressed for each
gas and chamber geometry. Operating voltage (i.e. gas gain) should be
taken into account as well because the gas gain versus high voltage
curves on different diameter wires have different slopes.
References
-
[1]
Yu.I. Davydov, TRIUMF preprint TRI-PP-04-09 (June 2004);
physics/0409156 (September 2004).
Submitted to Nucl. Instr.&Methods A. - [2] F. Sauli, CERN 77-09 (1977).
- [3] A. von Engel, Ionized gases (Oxford, 1955).
- [4] M. Baaliouamer et al., Nucl. Instr.&Meth. A382(1996), p.490.
- [5] S. Biagi, Nucl. Instr.&Meth. A273(1988), p.533.