Optical Properties of Bialkali Photocathodes
Abstract
The optical properties of the “bialkali” KCsSb and RbCsSb photomultiplier cathodes have been experimentally investigated in the visible range. The measurements carried out include the absolute reflectance at near-normal incidence, the polarization-dependent relative reflectance at various angles and the change in polarization upon reflection from the photocathode. These experimental inputs have been combined with a theoretical model to determine the complex refractive index of the photocathodes in the wavelength range and their thickness. As a result of this work, we derive a model which predicts the fraction of light impinging on a photomultiplier tube that is reflected, absorbed or transmitted, as a function of wavelength and angle, and dependent on the medium to which the photomultiplier is coupled.
keywords:
photomultiplier tubes , bialkali photocathodes , optical propertiesPACS:
85.60.Ha , 78.20.Ci , 78.66.-w1 Introduction
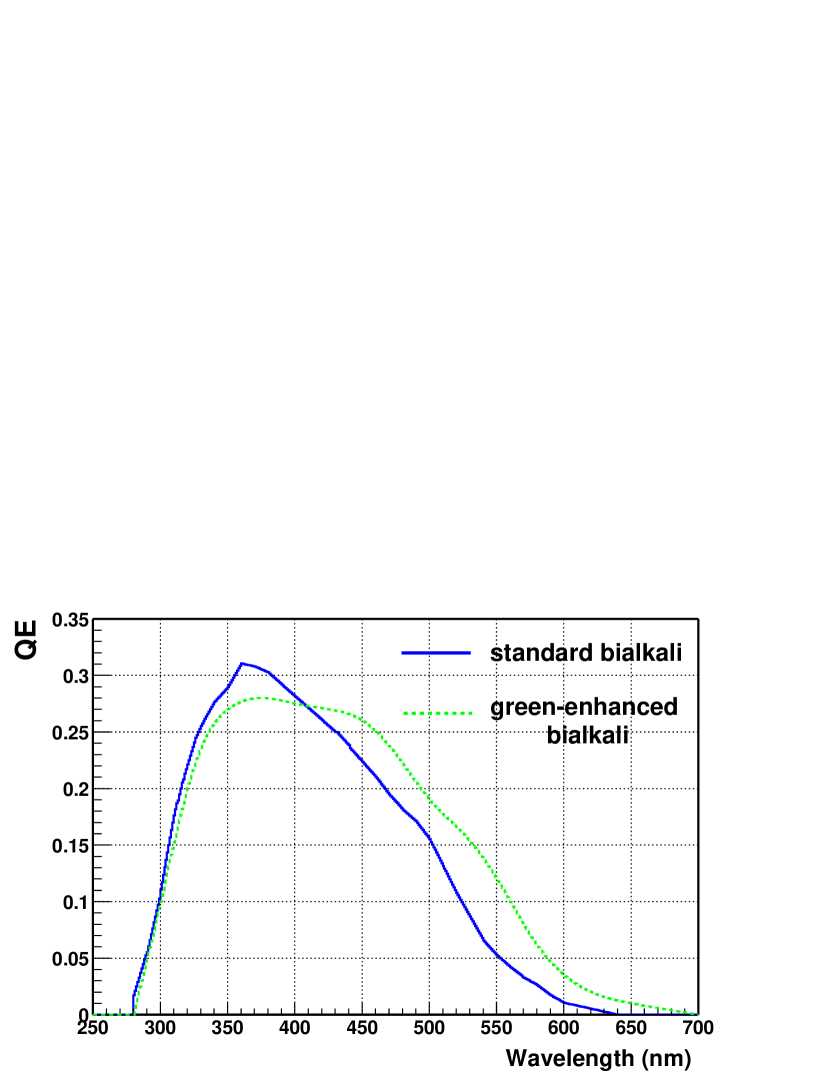
Photomultiplier tubes (PMTs) with bialkali photocathodes are widely used in astrophysics, nuclear and particle physics. In many cases, the only optical property of a PMT of interest for the design of an experiment is its spectral sensitivity, i.e. the fraction of photons converted into detected photoelectrons as a function of the wavelength (Fig. 1). Recent developments in particle physics, especially in neutrino physics, have led to the construction or proposal of several multi-ton up to megaton detectors, in which the interactions are detected either via Cherenkov light in water (or ice) or via scintillation light from organic liquid scintillators [1, 2, 3, 4, 5, 6]. Data analysis in these experiments is based on the comparison with the predictions of Monte Carlo simulations, which typically do not include a detailed description of light interaction with the PMTs.
Three processes are possible for a photon impinging on a PMT:
-
1.
Absorption in the photocathode, with probability
-
2.
Reflection from the PMT window or photocathode, with probability
-
3.
Transmission inside the PMT, with probability
In case of absorption, a photoelectron is produced, which has a certain probability to escape the layer towards the interior of the PMT, to be accelerated to the first dynode and start an avalanche, resulting in a detectable signal. It is convenient to express the probability that a photon contributes to a signal as the product of two probabilities:
| (1) |
where is the probability that the photon is absorbed in the photocathode, which is a function of the wavelength and the incidence angle , and is the conversion factor for such absorption to result in an avalanche. depends on (due to the different kinetic energy transferred to the photoelectron in the absorption process), and - not included in Eq. 1 - on the location of the photon absorption on the PMT surface and the operating high voltage. is here assumed independent of , as demonstrated in [7].
The probability is the Quantum Efficiency. In Fig. 1 the typical QE spectra are shown for two of the most commonly used photocathodes: the blue-sensitive bialkali (KCsSb) and the green-enhanced bialkali (RbCsSb). The curves are usually measured in air for light impinging at near normal incidence (.
For most applications the information in Fig. 1 is sufficient, since it characterizes the PMT detection efficiency for “standard” operations. However, the physics of light interaction with the PMT is more complex. First, the QE is not only a function of , but also of ; second, in many detectors the PMTs are typically coupled to media with , and not to air; last, the probabilities and are not implicit in Eq. 1.
A precise knowledge of the photocathode optical properties would allow the functions , and to be predicted for a PMT in contact with any medium. In spite of the great importance of this issue for detector-modeling, surprisingly very little is documented in the literature. A major breakthrough was accomplished by Moorhead and Tanner [8] (hereafter referred to as M&T), who measured the optical constants of a KCsSb bialkali photocathode in a EMI 9124B PMT at the wavelength of , for implementation in the MC simulation of the SNO experiment [5]. The method they used gave them the ability to break the ambiguity in the optical constants typical of this kind of determinations. In their work M&T also tried to deduce the wavelength dependence of the photocathode refractive index, by reinterpreting and reanalyzing earlier measurements at few other wavelengths in the visible spectrum reported in [9]. Later on, Lang used M&T’s technique to check their measurements on the same photocathode and to extend the investigation to several other photocathodes [10], including the RbCsSb. Lay subsequently exploited the same technique to study the performance of several Hamamatsu R1408 PMTs used in SNO [7]. However, all of the above measurements were limited to the single wavelength .
The objective of this work was to extend the existing measurements on the KCsSb and RbCsSb photocathodes by covering the whole visible spectrum and consequently to predict the interaction of visible light with bialkali PMTs in any experimental condition. The two investigated photocathodes are the most usual choice in particle physics. The former is suitable for the detection of Cherenkov light and scintillation light from primary fluors, the latter ensures good blue-green sensitivity and matches better the emission spectra of secondary fluors (wavelength-shifters) in three-component organic scintillator mixtures.
The original motivation for this work was to study the impact on the solar neutrino Yb-LENS experiment [11, 12, 13] of light reflections from PMTs. The signature of a interaction with the target nuclide is a delayed coincidence with life time . A modular design is envisaged, with Yb dissolved in an organic liquid scintillator. In the investigated detector concept, a fraction of the primary scintillation light reflects off the PMTs and is eventually detected at a later time, with a delay given by the time of propagation through a module. This delay is of the order of for a typical module length of , hence PMTs-reflected light falls in the time-window of the -signature. Consequently, reflections contribute to increase the probability that single events are misidentified as correlated double events, i.e. -candidates [14].
More in general, the study of light reflections from the PMTs is of concern in all detectors where this reflected light can cause a delayed signal. For example, in Borexino (and similarly in KamLAND) reflections weaken the discrimination power, which is based on the fact that the excitation of organic scintillators from -particles create a larger fraction of late light compared to the excitation from electrons [1].
Another application of the optical model of PMTs is the prediction of the angular dependence of the QE, for a PMT operated in air as well as in liquid.
2 Theory and Methodology
2.1 Introduction
The photocathode of a PMT is a thin layer of a multi-alkali semiconducting alloy, which is evaporated onto the back side of the glass window during production. Light impinging on a photocathode is in part reflected, in part absorbed and in part transmitted. The photocathode thickness is a compromise aiming at maximizing the probability that a photon results in a signal: if the layer is too thin, little light can be absorbed; if it is too thick, the resulting photoelectrons cannot efficiently escape from the photocathode.
The description of such systems is covered by the optics of thin absorbing films, a wide field on which a very rich literature exists (see e.g. the textbook [15]). The theoretical model merges the optical description of an absorbing material, through its complex refractive index, and the optics of thin layers, where the wave fronts of different orders of reflection are added coherently to determine the resulting reflected wave amplitude. Assuming that the surface of a photocathode is sufficiently regular and uniform that the model of thin films is applicable, then the functions , , are predictable, once the three parameters of the problem are known: real and imaginary part of the refractive index, (i imaginary unit, both n and k function of the wavelength) and thickness d of the layer. The challenge is to invert the results of optical measurements performed under certain specific conditions (angle of incidence, polarization, refractive index of the medium coupled to the PMT) in order to infer the constants n, k and d. This can be done by fitting the experimental results with the optical model of the photocathode, with n, k and d as free parameters.
Unfortunately the problem has often a high degeneracy: for a single measurement (for example absolute reflectance at a certain incidence angle) there exist infinite solutions for (n,k,d) that reproduce the data. For each considered wavelength at least three independent measurements are needed, but this is often still insufficient to guarantee the convergence to a unique solution.
Several techniques have been developed for the study of thin solid films (see [15, 16] for a review). However, the photocathode of a PMT is a challenging sample. It cannot be directly studied, because it is not chemically stable when exposed to air. Therefore some optical observables, like reflectance from the photocathode side and its transmittance, cannot be measured. Furthermore, polarization analysis of the light reflected off the photocathode can be disturbed by the birefringence that is induced on the glass window by the mechanical stress due to the pressure difference (the interior of the PMT is under vacuum). The limitations due to these experimental difficulties are discussed in Secs. 3 and 5.
2.2 The Model
Dealing with light reflection from a PMT, four regions can be defined, each characterized by its own refractive index: the medium where the light originates, with ; the PMT glass envelope, with ; the photocathode, with , and the vacuum inside the PMT, with . The amplitudes of the reflected and transmitted waves at the interface glass-photocathode ( to ) are given by the following formulas (see e.g. [17] for a derivation):
| (2) |
where
| (3) |
In Eq. 3, is the refractive index of the region, the angle of the propagating light beam with respect to the normal in the same region. This is calculated using Snell’s law starting from the angle of incidence on the PMT window, . All functions and variables in Eq. 2 and 3 are complex and the imaginary part of , and is set to 0. Eq. 2 holds for both light polarizations, perpendicular and parallel relative to the photocathode plane (defined as s and p waves, respectively), provided that the definitions for and are changed by swapping the i and j indices as indicated in Eq. 3 (the formulas with first indices apply to the p-wave).
Eq. 2 can be used to predict the total reflectance of the PMT by adding the Fresnel reflection at the medium-to-window interface ( to ) to the reflectance from the photocathode:
| (4) |
where the quantities:
| (5) |
represent the Fresnel reflection coefficients at the interface with the PMT window (see [17]). Similarly for the transmittance:
| (6) |
The last optical function, absorption, is deduced from Eqs. 4 and 6, by using the identity:
| (7) |
2.3 Experimental Approaches
Preliminary Remarks
As a consequence of Snell’s law, the angle at which a ray of light with a given incidence angle emerges after crossing a series of parallel layers depends only on the refractive index of the first and last medium. If (PMT in air) there is no critical angle for total internal reflection. The part of the PMT reflectance due to the direct Fresnel contribution of the window is trivial. In a large region of the (n,k,d) parameter space the photocathode reflectance111Here and throughout this paper we call photocathode reflectance the fraction of the light incident on the PMT that is reflected by the photocathode alone; PMT reflectance the fraction of the light that is reflected by the PMT as a whole, including the photocathode reflectance and the Fresnel reflection at the window. for both polarizations (given by Eqs. 4 after subtraction of the window contribution ) is nearly constant for and then drops to zero (simply because the Fresnel reflection at the window rapidly increases to for approaching , so that less light can refract and reach the photocathode). Therefore, reflectance measurements in air, even at different angles, provide a weak constraint on the solution of the fit, as pointed out by M&T in [8].
On the other hand, if (for example PMT in water or scintillator), then there is a critical angle above which no light can be transmitted. In this case the photocathode reflectance shows a plateau until and then a peculiar shape, very different for parallel and perpendicular polarizations. The optical model of the photocathode shows that, in this case, the free parameters (n,k,d) are strongly constrained by the angular dependence of the reflectance, in particular by the shape around .
The different behavior of a PMT in air and in a medium is illustrated with an example in Fig. 2.
Previous Measurements
Based on the above observations, M&T have built an experimental set-up to measure the photocathode reflectance as a function of the angle of incidence for a PMT immersed in water, at the wavelength of , provided by a He-Cd laser. With this technique they were able to establish unambiguously the three optical constants of the KCsSb bialkali photocathode they investigated: , , [8]. The result was obtained by fitting the data with the same optical model summarized in Eqs. 2 to 5. The goodness of the best fit was sufficient to demonstrate that the assumed theoretical model is an acceptable description of the photocathode. Later on Lang and Lay measured several PMTs equipped with the KCsSb photocathode at the same wavelength and found that the above parameters are quite typical, though PMT-to-PMT deviations may be larger than the statistical error [7, 10].
This Work
Our aim was to perform a spectroscopic investigation of the optical properties of bialkali photocathodes, covering the whole visible spectrum. For this purpose we used optical intrumentation designed to operate in air and our strategy was to break the degeneracy discussed earlier by making a global fit to a set of independent measurements. This kind of approach is quite “standard” in the study of thin solid films, as discussed in [16]. The optical constants measured at by M&T, Lang and Lay give a further contraint to break the residual ambiguities. For a photocathode of a PMT, light reflected from the glass window side is the only accessible observable. In addition to reflectance determinations, we also performed ellipsometric measurements.
Ellipsometry (see [16]) is based on the measurement of the change in the polarization state of light upon reflection off a plane surface. An ellipsometer consists of a polarizer and an analyzer: light is linearly polarized, sent to a sample and finally the reflected beam is analyzed. In general the reflection changes the polarization from linear to elliptic, in a way that depends on the three optical constants (n,k,d). Any linear polarization can be thought of as the superposition in phase of two orthogonal components. The frame of reference is chosen relative to the sample plane, which defines the parallel p-wave, and the perpendicular s-wave. The reflection off a surface changes the relative intensity ratio between p and s waves and introduces a phase delay. This change can be expressed by the ratio of the complex reflection amplitudes, which translates to an angle and a phase:
| (8) |
where the amplitudes and are given by the first row of Eq. 2. The angle and the phase are the two parameters measured by ellipsometry.
Ellipsometry is one of the most sensitive methods for the analysis of thin films and has the advantage over conventional reflectometry to be independent of absolute determinations, where systematics are difficult to control. To our knowledge, this technique has been applied here for the first time to the study of PMT photocathodes.
3 Optical Measurements of Photocathodes
Two PMTs from ETL (Electron Tubes Limited) have been investigated, 9102B and 9902B, the former equipped with a blue-sensitive KCsSb bialkali photocathode, the second with a green-enhanced RbCsSb bialkali photocathode. Both PMTs have a plano-plano window. The measurements performed are:
-
1.
Absolute reflectance for unpolarized light at in the wavelength range
-
2.
Relative reflectance for p and s polarizations at in the wavelength range
-
3.
Ellipsometric measurement of in the wavelength range
For the cases 2 and 3, the lower limit of the probed wavelength range is the shortest allowed by the instrument or the adopted measurement procedure, as will be explained in the next sections. The upper limit is arbitrarily chosen, well above the cut-off of the PMT sensitivity (see Fig. 1).
3.1 Absolute Reflectance at a Fixed Angle
Experimental Technique
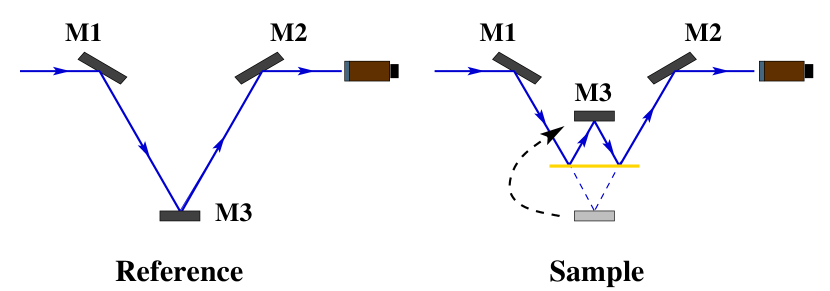
The PMT absolute reflectance has been measured in air, at near normal incidence (), with a V-W accessory of a UV/Visible Varian Cary 400 spectrophotometer. The V-W technique (Fig. 3 and relevant caption) allows the measurement of the absolute specular reflectance of a flat sample without the use of any reference mirror. A precision of is attainable (instrument specification).
Results and Discussion
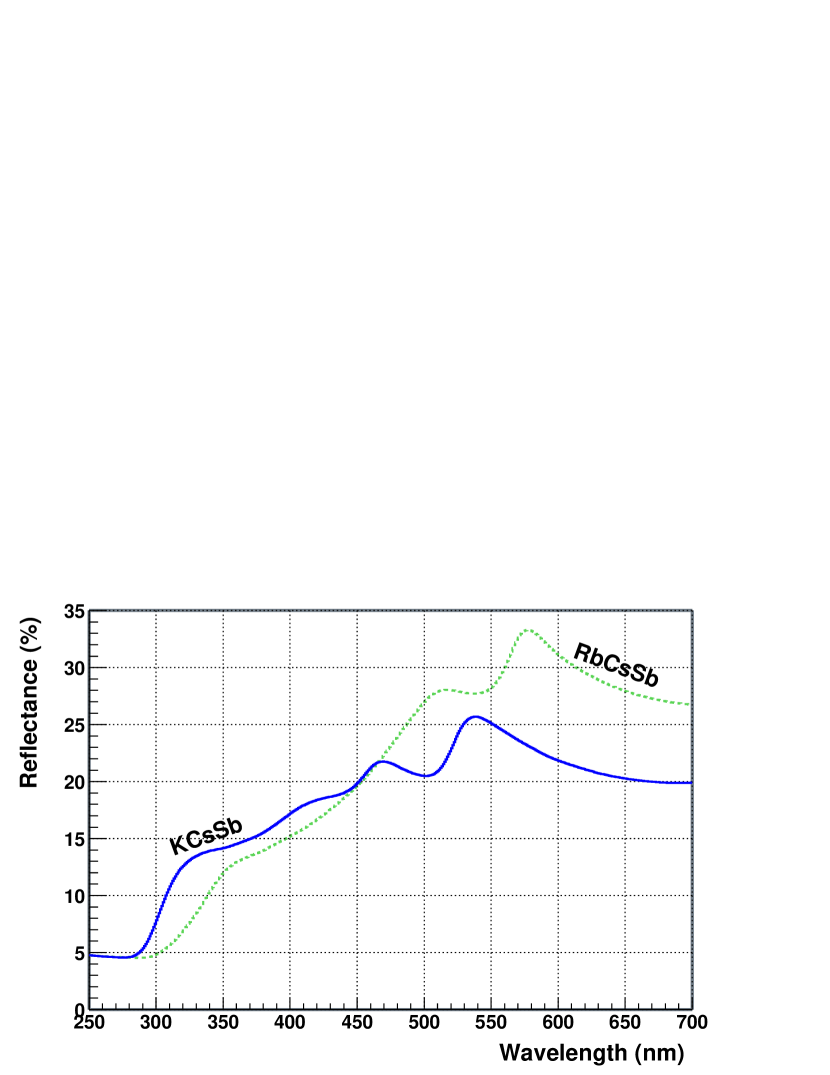
At the V-W level of accuracy, the fluctuations within our sample PMTs due to inhomogeneities of the photocathode are the dominant uncertainty. Consequently, we report in Fig. 4 the average spectra from several measurements of both PMTs (relative deviations of are observed).
It is remarkable that both PMTs show a reflectance in the visible region. The same range has also been measured by us in other bialkali PMTs and seems to be typical of all the bialkali PMTs [10]. Moreover, we found that the spectral shape of the reflectance is reproduced in other PMTs equipped with the same kind of photocathodes.
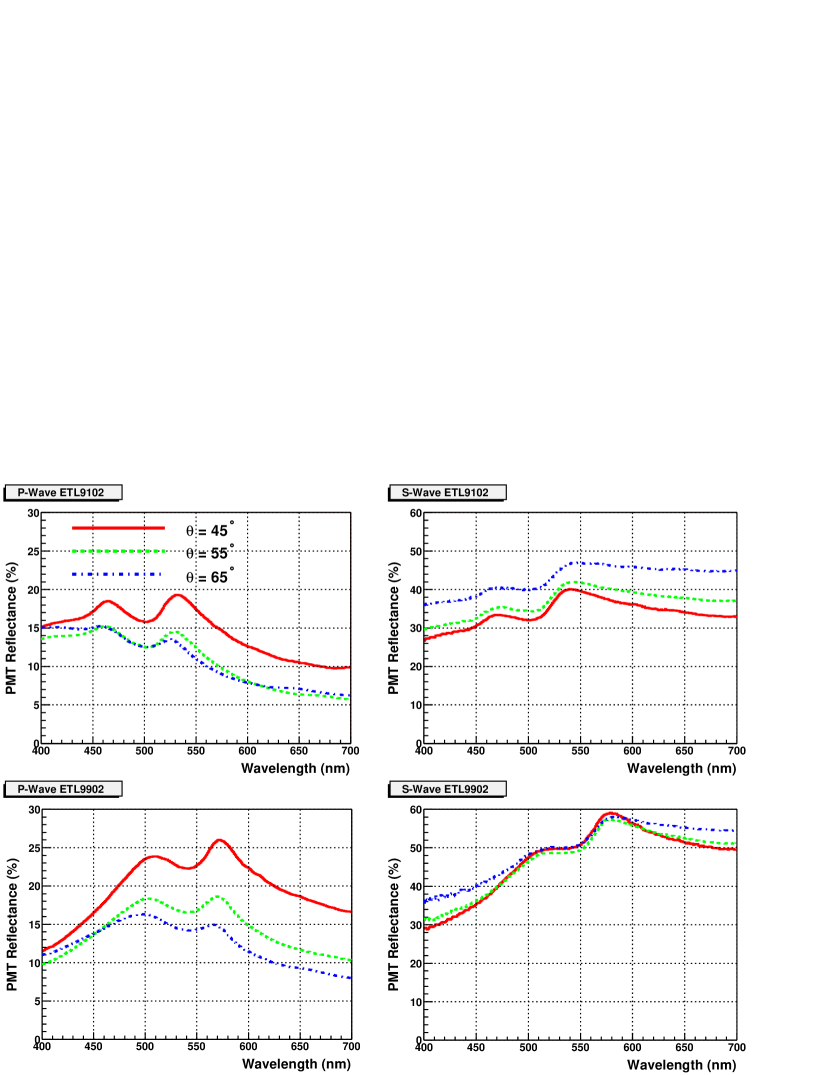
3.2 Relative Reflectance at Variable Angles
Experimental Technique
The reflectance of the test PMTs has also been investigated with a VASRA accessory (Variable Angle Specular Reflectance Accessory) of our Varian Cary 400 spectrophotometer. The VASRA allows to measure the specular reflectance of a sample in the interval . Unlike the V-W accessory, the VASRA has no self-referencing capabilities, therefore any measurement needs to be referenced to a calibrated standard.
In order to correct for the instrument spectral baseline, we have referenced the VASRA with the response to a VM2000 [18] reflector sample, which we have measured to have a nearly flat (at ) reflectance spectrum at near normal incidence, with typical 222This implies an absolute error of , which is however insignificant, since the absolute scale of the measurement will be left free (see next paragraph). The only significant systematic error implicit in this procedure is related to the wavelength dependence of the VM2000 reflectance. At near-normal incidence, we found in the wavelength range used for the analysis [14]. Independent measurements at reported in the same reference give an indication that at all incidence angles. [14]. The measurements were limited to , because the VM2000 used as reference has reflectance cut-off at . A polarizer is employed to select the p and s waves before reflection from the sample, and a depolarizer is mounted at the end of the optical path to avoid biases related to the sensitivity of the spectrophotometer light sensor to the polarization state of the outgoing light.
Three angles of incidence are considered for the final analysis: . This angular range is chosen because the strongest constraints in the determination of the photocathode optical parameters are expected from measurements at high angles of incidence. Furthermore, the three selected angles are around the Brewster’s angle for Fresnel reflection off the glass, so that the PMT reflectance of the parallel polarization is largely dominated by the photocathode contribution.
Results and Discussion
Fig. 5 displays the average reflectance spectra, where the mean values of a set of repeated scans are shown. We found that the shape of the curves are very reproducible, however the absolute scale of the measurement is not (relative deviations of up to are observed). The reason is that the alignment of the VASRA sample holder can change slightly for different scans, resulting in a variation of the collection efficiency for the reflected light. For this reason, the VASRA measurement will be used for spectral shape data only, while the absolute normalization of all curves is considered as a free parameter of the fit function (to be discussed in Sec. 4).
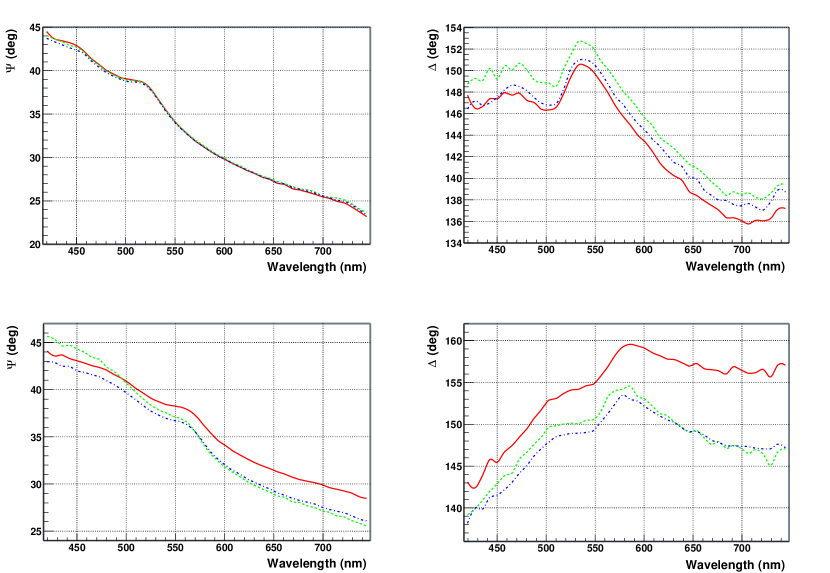
3.3 Ellipsometric Measurements
Experimental Technique
The ellipsometric measurements have been performed with a M-44 Vis J.A. Woollam spectral ellipsometer. The instrument allows the simultaneous measurement of 44 discrete wavelengths in the range . The angle of incidence on the sample was , measured by ellipsometry itself on a reference film. Light was linearly polarized and the polarization state of light upon reflection was analyzed by decomposing the elliptical polarization into the parameters of Eq. 8. The thickness of the PMT glass window was sufficient to allow a clear separation of the beams reflected off the glass and the photocathode, so that it was possible to select only the latter light to the analyzer. This selection facilitates the succeeding interpretation of data. For both PMTs three ellipsometric scans have been performed, corresponding to the illumination of different spots of the photocathode.
Results and Discussion
The results are shown in Fig. 6. It can be seen that for the PMT ETL 9102B the three scans of the function are in excellent agreement with each other, while the spectra measured in different positions are similar, but shifted by nearly constant phases. This is likely to be an artifact introduced by stress-birefringence of the PMT glass window. This stress is different in different positions, and this can explain the observed phase shifts in the three measurements of . Differences are also observed in the scans of the ETL 9902B PMT. It is likely that this effect is due to a inhomogeneous photocathode thickness333The process of photocathode growth through evaporation can lead to some inhomogeneities in the layer thickness. This is for example observed and studied in [7, 10]..
4 Data Analysis
In Sec. 2.1 the equations describing the optical model of a thin absorbing film have been introduced and in Sec. 3 all the optical measurements performed on two sample PMTs have been reported. The purpose of data analysis is to combine theory and experiments to derive the unknowns of the problems. Those unknowns are:
-
1.
The photocathode refractive index,
-
2.
The photocathode thickness,
For simplicity, it will be assumed that the glass refractive index is a known function:
| (9) |
Eq. 9 is the Cauchy dispersion law with the typical parameters of the borosilicate glass employed for the PMT envelope444The refractive index of the borosilicate glass is measured by many manufacturers to be in the range in the visible spectrum. Eq. 9 gives , and . The latter value has been directly measured by M&T [8]. It has been also verified that fixing , where c is any constant in the above range, leads to similar results in the analysis..
We have written a computer program implementing Eqs. 2 to 5, which is used to perform a global fit to the experimental data based on a least square minimization. The program uses the package MINUIT of the CERN software libraries to perform such minimization. The global parameter is easily implemented, while real and imaginary part of the photocathode refractive index are continuous functions of the wavelength. They are implemented in the global fit as a table of parameters at discrete wavelengths, from to with steps of , and then interpolated at each data-point wavelength by using a cubic spline function. As mentioned in Sec. 3, some of our measurements suffer from systematics implying a partial loss of information. This forces the introduction of new free parameters in the fit:
-
1.
Six normalization factors for the VASRA reflectance measurements, expressing the systematic uncertainty in the absolute scale of the scans
-
2.
One constant phase-shift for the average ellipsometric spectrum, accounting for the effect of the glass birefringence
The fit is performed in the wavelength range 555In the interval only the V-W data is available. In V-W plus VASRA. Above the full data-set. The degeneracy in the interval is broken by requiring the continuity of the optical functions (the photocathode thickness is common to all wavelengths)..
The function FCN minimized by MINUIT is expressed as the sum of 4 contributions: . Each one, , is defined as:
| (10) |
where is the value of the optical measurement at the wavelength and is the prediction of the theoretical model, for a particular choice of the parameters set . Eq. 10 is normalized to the total number of data-points to have each measurement contribute the same statistical weight in the global fit.
5 Results
5.1 Preliminary Remarks and Analysis Strategy
The inversion of our experimental data by using the described fitting procedure does not lead to a unique solution. We find that our measurements are sufficient to constrain the spectral shape of the optical constants, however there are strong correlations in the fit between n, k and d, so that the FCN function does not show a well defined minimum. The reason is that our measurements are not really “orthogonal” and because of the systematics discussed in Sec. 3, the VASRA and ellipsometric data provide only partial information. Furthermore, measurements in air give weaker constraints than measurements in higher refractive index media, as the model is highly degenerate in the optical parameters for this case (see Sec. 2.3).
The values of the photocathode complex refractive index measured by M&T, Lang and Lay at provide the missing constraint to break the residual degeneracy at all wavelengths. In fact, solutions can be found consistent with those previous determinations, however provided that the ellipsometric data are corrected by introducing a free angular shift. Since the physical meaning of such a parameter is less clear than for the case of the expected phase-shift of the function, in this paper we present an analysis of our data in which is not included in the global fit. The consistency of the spectrum with the other data and the optical model is discussed in the next section.
The analysis for the KCsSb photocathode is carried out by requiring the solution to be consistent with the optical constants measured by M&T at , and later confirmed by Lang and Lay. This means that we fix , at (the closest wavelength to in our parameters table). The only published measurements on RbCsSb photocathodes using the M&T technique are reported in [10]. A large scatter is observed, however the two samples manufactured by ETL and expected to be very similar to our ETL 9902B give consistent results. We therefore fix the optical constants at to the average value of these PMTs: , . For either photocathode the quoted errors are .
Fixing the optical constants at the given wavelength in the global fit (where the scan is excluded) breaks the degeneracy and leads to unique solutions for the photocathode thickness d and the spectra and . The uncertainty associated with the error of the optical parameters at is accounted for by calculating an “upper” solution with fixed and , and a “lower” solution for and . The band between these two solutions defines our confidence interval for real and imaginary part of the complex refractive index at all wavelengths, and as well for the photocathode thickness. This choice of estimating the errors is justified by the fact that in M&T’s and Lang’s fit to data, as well as in ours, n and k are strongly correlated. We estimate that the additional uncertainty coming from the fit of our data is small compared to the one associated with the error of the fixed optical parameters.
5.2 KCsSb Bialkali Photocathode
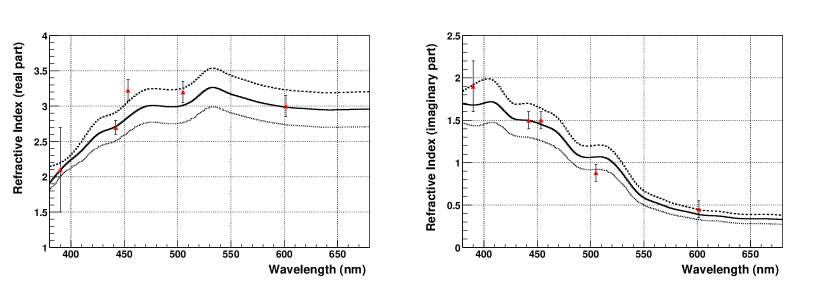
An example of global fit to the optical measurements performed on the PMT ETL 9102B is shown in Figs. 7 and 8, while Fig. 9 shows the best fit solutions for the complex refractive index and the allowed bands. In Table 1 the other parameters of the fit are reported.
Fig. 8 also shows the prediction of the best fit model for the ellipsometric function, not used for the global fit. It is remarkable that the predicted spectral shape is in excellent agreement with the measurement. Data and model simply differ by a constant angular shift, which is probably due to an unimplemented systematic effect related to the glass birefringence. An additional free offset might be introduced to include the data in the global fit. However the figure shows that this information would simply be redundant.
The results in Fig. 9 show that the spectral shape of the real and imaginary part of the photocathode refractive index is well constrained by the data, while the absolute scale depends on the assumptions of the optical constants fixed during the fit. Both n and k anti-correlate with the photocathode thickness (Table 1), as was observed also by M&T in their analysis.
Fig. 9 also shows a graphical comparison of our results with those of M&T, including a re-analysis that M&T propose of previous measurements by Timan at discrete wavelengths in the visible region [8, 9]. Our results are in good agreement with M&T’s analysis of Timan, both for the real and imaginary part of the complex refractive index.
The estimation of the photocathode thickness (Table 1) is consistent with the typical values found by M&T, Lang and Lay, and expected by the PMT manufacturer.
5.3 RbCsSb Bialkali Photocathode
We have carried out a similar analysis for the optical measurements on the PMT ETL 9902B (RbCsSb bialkali). The estimated real and complex part of the refractive index as a function of the wavelength are plotted in Fig. 10.
The solutions show similar features to the case of the KCsSb: the spectral shapes are well constrained by data and shifting the values at fixed during the fit produces a corresponding shift of the entire spectra, which is compensated by an anti-correlated change in the photocathode thickness (Table 2).
6 Discussion and Applications
In the previous section it has been shown that our measurements, in conjunction with M&T’s (KCsSb) and Lang’s (RbCsSb) at , lead to unique solutions for the optical constants of the investigated photocathodes in the full visible range. In the following sections we report the optical performances of bialkali PMTs predicted by our model for some specific cases. We also try to probe the degree of predictability of our model and to evaluate the uncertainties originating from the ambiguity left in the problem. In all the calculations it will be assumed that light impinging on the PMT is unpolarized.
It should be noted that even with a precise determination of the photocathode optical parameters in one PMT, the problem of predicting the behavior of any other similar PMT would still remain to some extent indeterminate, because the thickness of the photocathode can vary up to a factor from one PMT to another, as shown by Lang. Therefore we point out that the predictions and relevant uncertainties presented in the next sections refer specifically to the two measured sample PMTs. The model can be extended to any generic KCsSb and RbCsSb PMT, however with a somewhat larger uncertainty. We do not discuss here the effect of the dependence of the PMT optical properties on the photocathode thickness. This issue is examined in [8, 7].
Several cases may be considered as for the coupling of the PMT to the medium where the light originates. We will focus on the case of a KCsSb PMT optically coupled to a scintillator. For simplicity, it will be assumed at all wavelength, so that the medium refractive index is slightly lower than that of the PMT window glass at all wavelengths in the visible.
6.1 Wavelength Dependence of the Reflectance
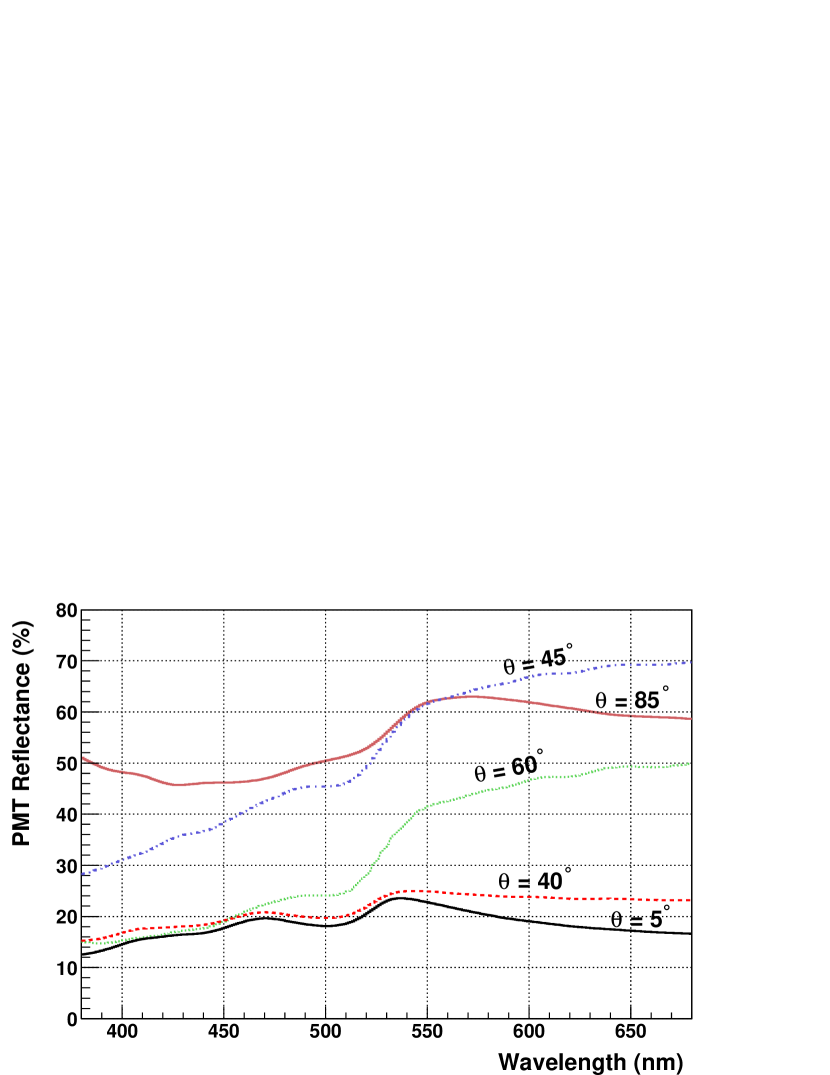
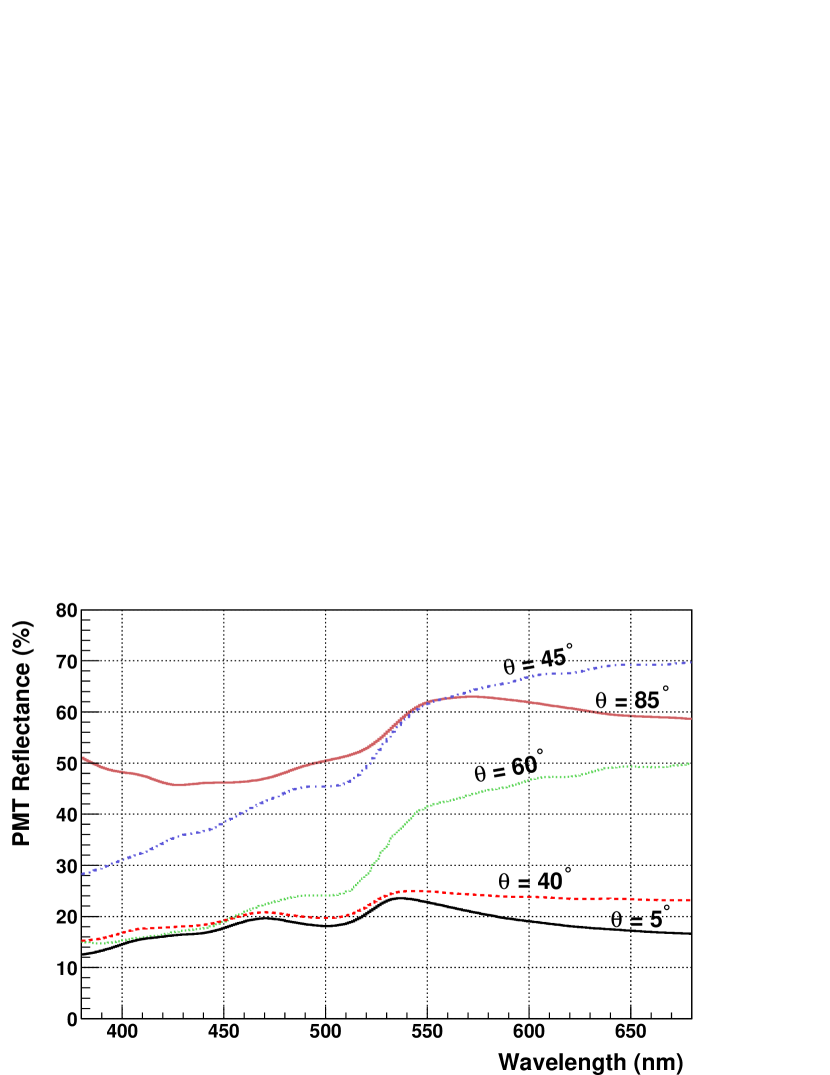
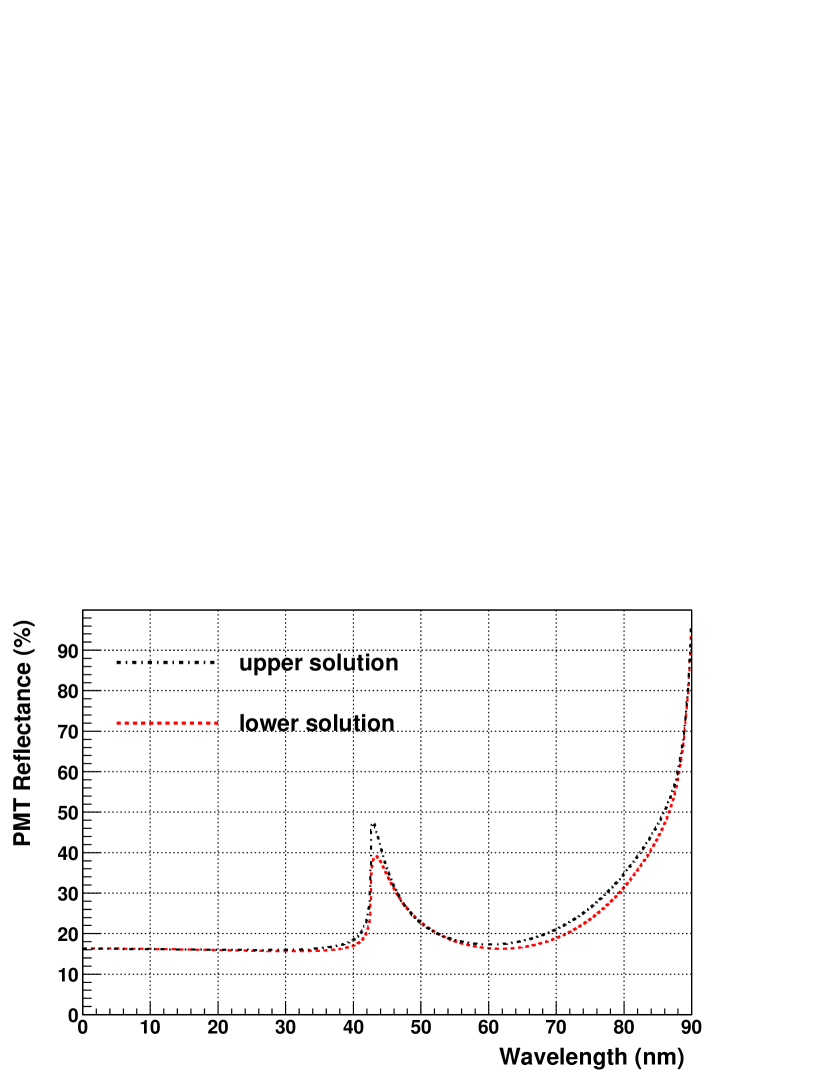
Fig. 11 reports the wavelength dependence of the PMT reflectance at various angles, calculated for our sample ETL 9102B in (or coupled to) a medium with .
At near normal incidence the spectrum is very similar to the one measured in air (cf. Fig. 3) and does not change much until approaches (. Above the critical angle the spectrum behaves differently, with higher reflectance at longer wavelengths: since transmission is suppressed for and absorption decreases with (to discuss in Sec. 6.4, cf. Fig. 16), the reflectance must necessarily compensate, to preserve .
The predictions for the RbCsSb photocathode are qualitatively very similar. The only visible difference is that the main features of the spectra (peaks below , slope change above) appear shifted to longer wavelengths, coherently with all the optical measurements.
In Fig. 12 it is shown how the indetermination in our model affects the predictions: for all the solutions in the allowed bands give nearly the same results, whereas at higher angles some differences are observed. This is related to the fact that the optics of a PMT in liquid below the critical angle does not differ very much from that of a PMT in air (after taking into account the Fresnel reflection from the glass). The selected solutions are those that fit best the measurements in air, consequently they also make very similar predictions for a PMT in liquid at . On the other hand, also above the critical angle the difference in the predictions of the allowed solutions is .
6.2 Angular Dependence of Reflectance and Absorption
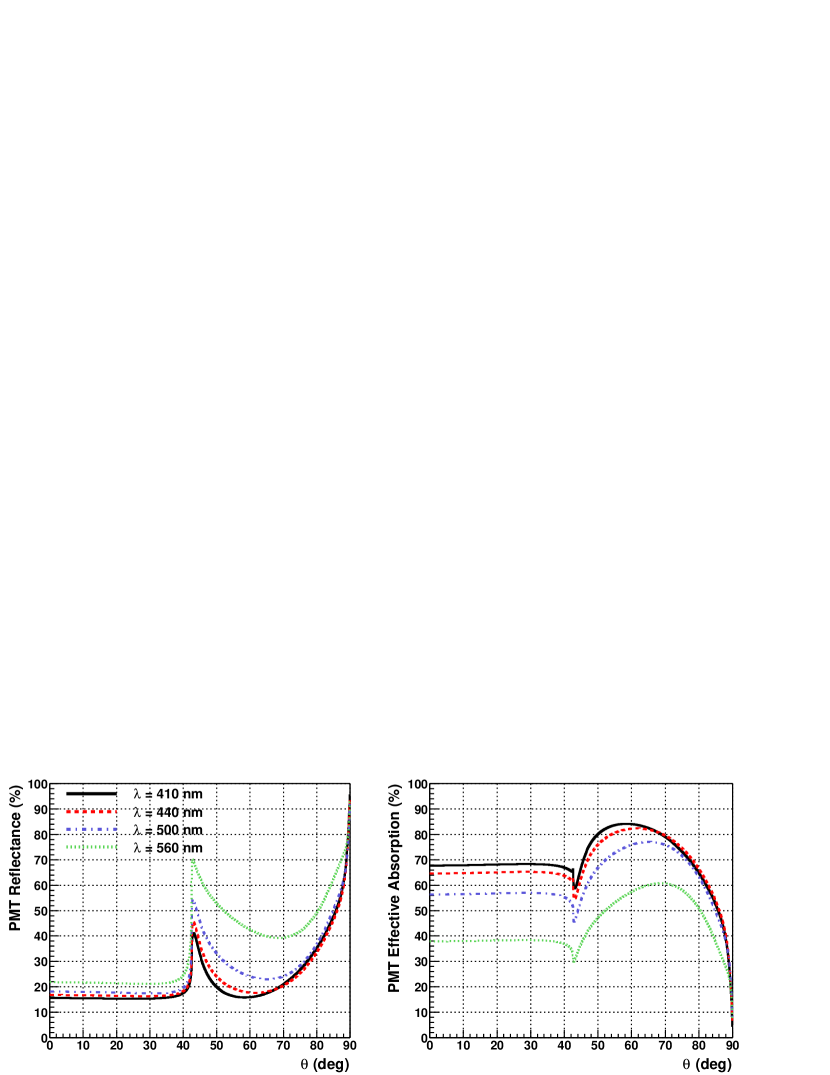
In Fig. 13 the angular dependence of the PMT reflectance and effective absorption666The effective absorption includes also the fraction of transmitted light that is back reflected onto the photocathode by the aluminized internal surface of the PMT, and is eventually absorbed. For simplicity we do not simulate the optics inside the PMT and assume that on average a fraction of the transmitted light () hits the photocathode again. The probability for absorption is given by the same optical model described in Sec. 2.1, simply by exchanging the order of the refractive indices, going from vacuum to scintillator. Absorption from the photocathode side is a very flat function of . Using the central solution model for the PMT ETL 9102B, we find: , . These values are multiplied by and added to the absorption from the scintillator side to obtain the effective absorption function. The effect of this correction is to increase absorption below the critical angle, resulting in a higher QE. As a by-product, the PMT efficiency has a more uniform angular dependence. is shown for 4 representative wavelengths. In all cases the reflectance has a plateau below , then a sharp peak at the critical angle, followed by an extended angular region where R has similar or higher values than at near normal incidence; last R has a fast increase to for . Similarly the effective absorption has a flat angular dependence for , a dip at the critical angle, followed by a broad peak and it then drops to zero, since ( for ). At different wavelengths the branching between reflection and absorption changes, as well as the shape of the peak around the critical angle.
In Fig. 14 the impact on of the uncertainty of the optical parameters is studied, for the PMT ETL 9102B at . It is again found that all the allowed solutions give the same predictions for , whereas they differ slightly from each other at larger angles of incidence. The strongest departures () are observed in a narrow angular range around and for .
The analysis of the RbCsSb photocathode leads to very similar predictions. In case the same qualitative features are observed, however, the reflectance (absorption) goes to () below , corresponding to the condition for total internal reflection at the medium-glass interface.
6.3 Angular Dependence of the Quantum Efficiency
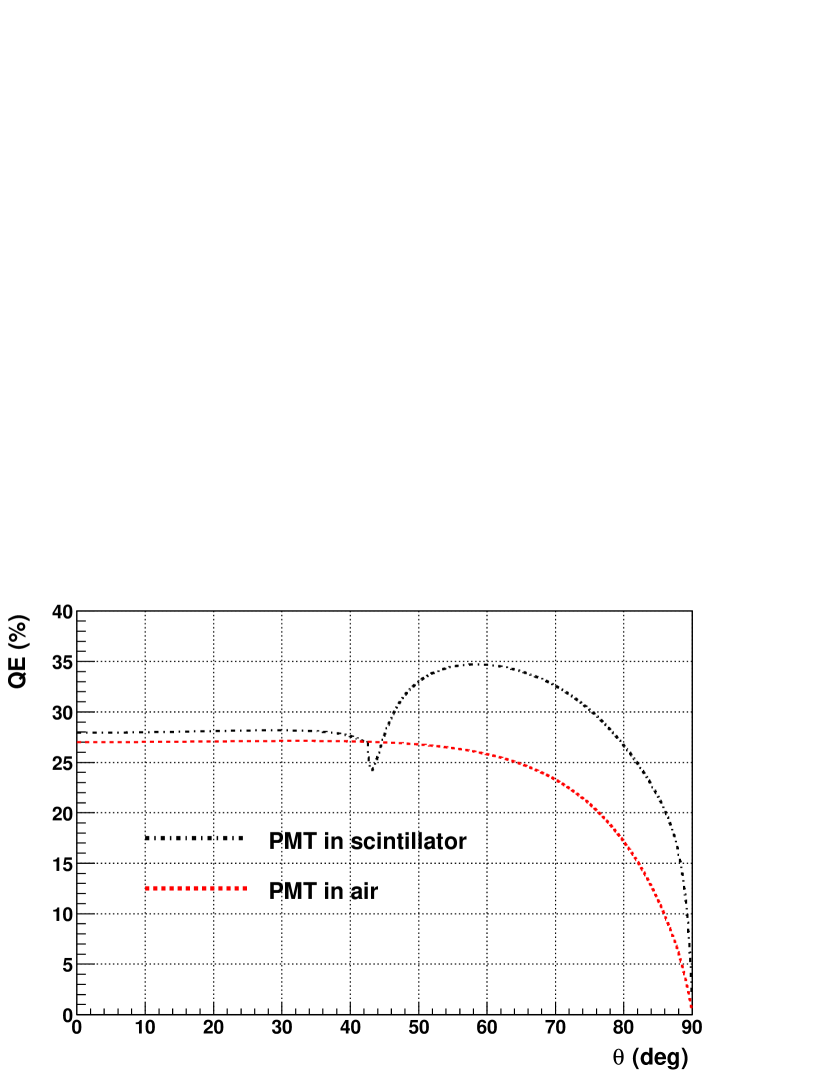
Assuming that the conversion factor in Eq. 1 does not depend on (see [7]), the angular dependence of the PMT QE is the same as that of the effective absorption. As a consequence, the efficiency of a PMT can be predicted for any and by rescaling the calculated effective absorption at with , given by the ratio at near-normal incidence. As an example, in Fig. 15 the predicted is plotted, for the ETL 9102B in scintillator and air, at the wavelength of . The curves are calculated by rescaling the effective absorption in such a way that the QE in air at normal incidence is 27 %. It is observed that both curves have a plateau, extending up to in scintillator and in air. The QE in liquid is expected to be slightly higher than in air, because of the Fresnel reflection at the window. As in Fig. 13, PMTs in liquids have a peak sensitivity in the range . On the other hand, PMTs in air lose sensitivity above , because the Fresnel reflection from the glass window increases.
6.4 Qualitative Understanding of the PMT Sensitivity
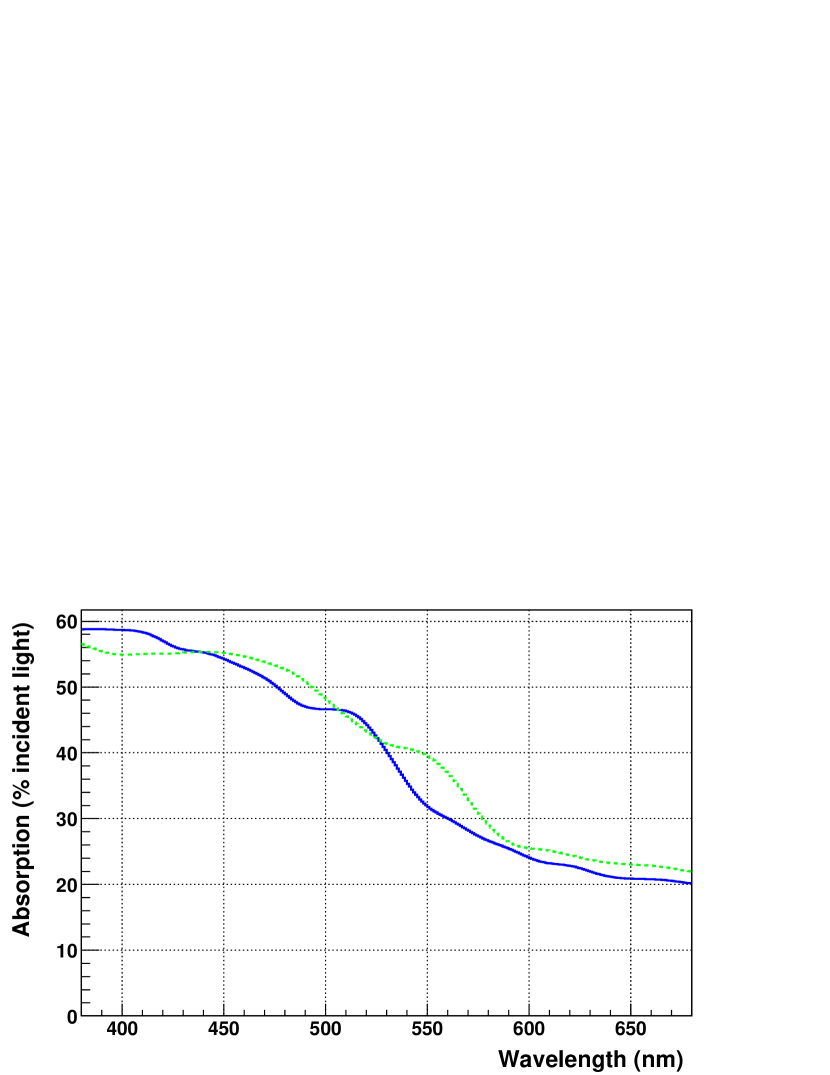
In this section we show that the model is also able to explain qualitative features of the wavelength dependence of the PMT QE. The latter is related to the photocathode absorption777For this qualitative discussion we use the simple absorption, instead of the effective absorption., as expressed in Eq. 1. Fig. 16 shows the wavelength dependence of the absorption, deduced from our model (central solutions) for PMTs in air at near normal incidence. The figure shows that the green-enhanced bialkali photocathode has a plateau of maximum absorption extending further into the “green” visible region, compared to the blue-sensitive bialkali. Absorption is largely determined by the imaginary part of the refractive index, so that the features of the calculated spectra reflect the shape of the functions in Figs. 9 and 10. There it is also found that the imaginary part of the RbCsSb refrective index peaks at longer wavelengths compared to KCsSb.
We note that the correct prediction of the sensitivity of the two photocathodes, though only qualitative, is non trivial, because it is based exclusively on the study of the reflected light. However, the calculated absorption spectra are in disagreement with the reported QE (see Fig. 1), especially in the tail, where the QE drops to zero, while the model predicts only a factor of reduction. This may be explained by postulating that the conversion factor in Eq. 1 vanishes at long wavelengths: photoelectrons are indeed produced, but with insufficient kinetic energy to escape the photocathode. Lay also comes to the same conclusion in [7].
7 Conclusions
We have investigated the optical properties in the visible range of two test ETL PMTs, 9102B and 9902B, equipped with a “blue-sensitive” KCsSb and a “green-enhanced” RbCsSb bialkali photocathode, respectively. This study includes the spectroscopic measurement of the absolute reflectance at near normal incidence, of the polarization-dependent relative reflectance at variable angles, and of the change in the light polarization upon reflection off the photocathode. We have fitted the experimental data with a model based on the optics of thin films to determine the photocathode thickness and its wavelength-dependent complex refractive index. Degenerate solutions appeared, however the fit converges to a unique solution once the complex refractive index of the photocathode is fixed at a single wavelength, for example to the value determined by other authors at . Based on this observation, we could predict the optical properties of both PMTs in the wavelength region , and for any angle of incidence and coupling. As an example, we have studied in detail the case of a KCsSb PMT coupled to a scintillator. The model predicts that the reflectance as a function of the angle of incidence on the PMT is nearly constant for , with values of , depending on the wavelength. It was shown that in this angular range the predictions of the model are very robust, since they are strongly constrained by the direct measurement of the PMT reflectance. Above the critical angle () the degeneracy is broken and the uncertainty of the model is larger. However, also in this case quantitative predictions are made, at the level of precision (). As another application of this study, through the calculated angular dependence of the photocathode absorption, the quantum efficiency of a PMT, normally measured in air for near-normal illumination, can be predicted for any angle and coupling. For the case of PMT in scintillator, we found that the PMT has nearly constant sensitivity for , a higher efficiency for and a vanishing efficiency for , where the PMT reflectance goes to . The sensitivity of a PMT in air is expected to have a plateau for and then to decrease monotonically down to for , due to the Fresnel reflection at the glass window.
The description of light interaction with the bialkali PMTs reported in this paper covers most of the experimental conditions in which these devices are used. Therefore this model is suitable for implementation in photon-tracing Monte Carlo codes, through the formulas 2 - 7, the input optical parameters , shown in Figs. 9, 10 and listed in Appendix A, and the typical photocathode thickness reported in Tables 1 and 2.
Acknowledgments
We would like to acknowledge the helpful support of Ron Stubberfield from ETL for providing the test PMT samples and many useful documentation. We thank Dr. M.E. Moorhead for helpful discussions. We are in debt with Prof. Grunze of the Institute for applied physical chemistry of the University of Heidelberg for the use of the ellipsometer, and with Dr. Thimo Bastuck for the precious assistance in the ellipsometric measurements. We thank Dr. F. Dalnoki-Veress for careful reading of the manuscript and helpful suggestions.
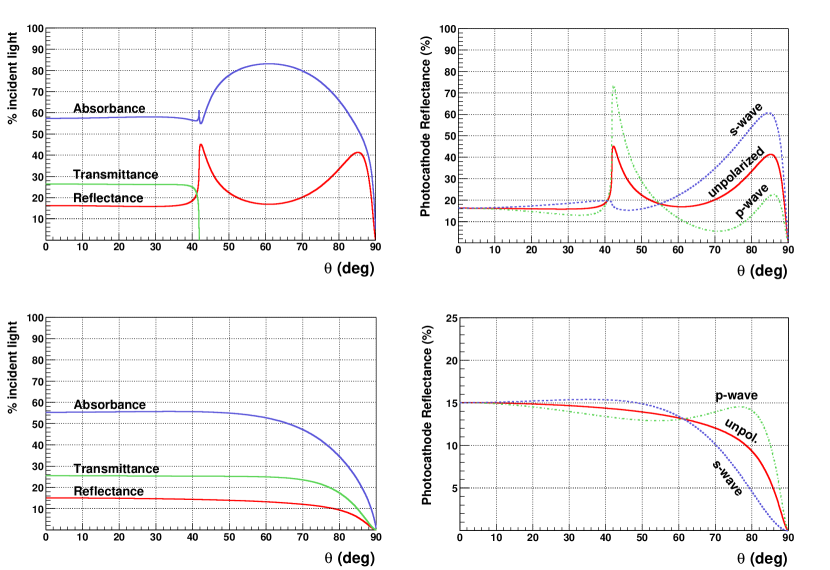
Top left: predictions for the photocathode absorption, reflectance and transmittance, assuming the following parametrization: (scintillator), (glass), (photocathode), (vacuum); ; .
Top right: reflectance for unpolarized light, s and p waves for the same case.
Bottom left: predictions for the same parameters, but PMT in air: .
Bottom right: reflectance for unpolarized light, s and p waves for the same case.
In all the plots the ordinates are given in percent of the incident light, and the first order Fresnel reflection from the glass is not included (for this reason the sum drops to zero, for ).
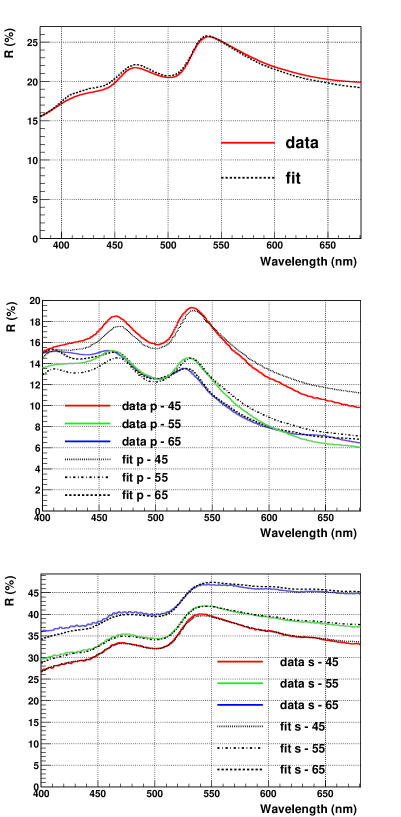
Top: V-W absolute reflectance spectrum.
Center: VASRA reflectance, parallel polarization.
Bottom: VASRA reflectance, perpendicular polarization
The measurements are displayed in solid lines (see Figs. 4 and 5), the fits in dashed (dashed-dotted and dotted) lines.
The fits obtained after fixing to the other considered values are very similar to the one shown here.
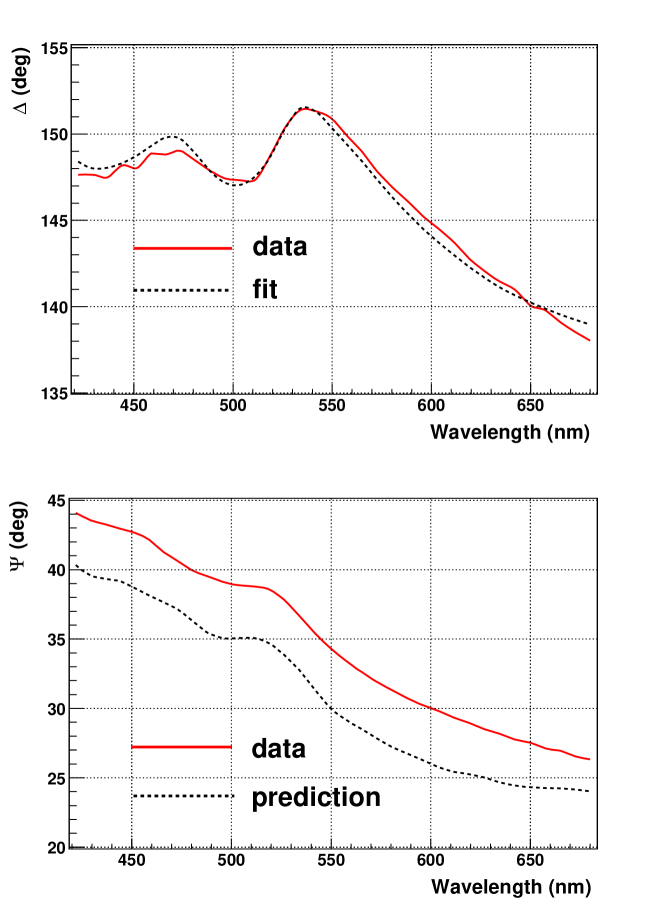
Top: best fit (black dashed) to the measured average ellipsometric spectrum of the ETL 9102B (red solid), for the case of optical parameters fixed to , .
Bottom: Measured average spectrum (red solid, not included in the global fit) and relevant prediction of the model giving the best global fit to V-W, VASRA and data (black dashed).
The fits obtained after fixing to the other considered values are very similar to the one shown here.

| d | VASRA normalization factors | -shift | ||||||
| (nm) | (deg) | |||||||
| central solution | ||||||||
| “upper” solution | ||||||||
| “lower” solution | ||||||||
| d | VASRA normalization factors | -shift | ||||||
| (nm) | (deg) | |||||||
| central solution | ||||||||
| “upper” solution | ||||||||
| “lower” solution | ||||||||
Appendix A Best Fit Optical Parameters
We report in the following table the best fit refractive indices for the two photocathodes, from to in steps, as implemented in the minimization code. The central solutions are shown, which correspond to a fixed and for the KCsSb photocathode, and and for RbCsSb. The relevant best fit thicknesses are and , for the KCsSb and RbCsSb photocathode, respectively.
| KCsSb | RbCsSb | |||||||
|---|---|---|---|---|---|---|---|---|
| n | k | n | k | |||||
| 380 | 1.92 | 1.69 | 2.07 | 1.22 | ||||
| 395 | 2.18 | 1.69 | 2.22 | 1.17 | ||||
| 410 | 2.38 | 1.71 | 2.30 | 1.21 | ||||
| 425 | 2.61 | 1.53 | 2.40 | 1.27 | ||||
| 440 | 2.70 | 1.50 | 2.50 | 1.35 | ||||
| 455 | 2.87 | 1.44 | 2.63 | 1.40 | ||||
| 470 | 3.00 | 1.34 | 2.81 | 1.41 | ||||
| 485 | 3.00 | 1.11 | 2.99 | 1.37 | ||||
| 500 | 3.00 | 1.06 | 3.16 | 1.21 | ||||
| 515 | 3.09 | 1.05 | 3.22 | 1.04 | ||||
| 530 | 3.26 | 0.86 | 3.21 | 0.90 | ||||
| 545 | 3.20 | 0.63 | 3.23 | 0.86 | ||||
| 560 | 3.12 | 0.53 | 3.32 | 0.76 | ||||
| 575 | 3.06 | 0.46 | 3.39 | 0.59 | ||||
| 590 | 3.01 | 0.42 | 3.28 | 0.46 | ||||
| 605 | 2.98 | 0.38 | 3.22 | 0.43 | ||||
| 620 | 2.96 | 0.37 | 3.18 | 0.40 | ||||
| 635 | 2.95 | 0.35 | 3.15 | 0.38 | ||||
| 650 | 2.95 | 0.34 | 3.14 | 0.37 | ||||
| 665 | 2.95 | 0.34 | 3.14 | 0.37 | ||||
| 680 | 2.96 | 0.33 | 3.13 | 0.35 | ||||
References
- [1] Borexino collaboration (G. Alimonti et al.), Astrop. Phys., 16 (2002), 205
- [2] Double-Chooz collaboration (F. Ardellier et al.), Letter of Intent for Double-CHOOZ: a Search for the Mixing Angle Theta13, hep-ex/0405032
- [3] KamLAND collaboration (K. Eguchi et al.), Phys. Rev. Lett., 90 (2003), 021802
- [4] SK collaboration (M. Nakahata et al.), Nucl. Instr. Meth. A, 421 (1999), 113
- [5] SNO collaboration (J. Boger et al.), Nucl. Instr. Meth. A, 449 (2000), 72
- [6] For other projects see e.g. Proceedings of the Neutrino 2004 conference, Paris, June 14-19 2004, Nucl. Phys. B (Proc. Suppl.), in press. URL: http://neutrino2004.in2p3.fr/
- [7] M.D. Lay, Nucl. Instr. and Meth. A, 383 (1996), 485 and M.D Lay and M.J Lyon, Nucl. Instr. and Meth. A, 383 (1996), 495
- [8] M.E. Moorhead, Reflectors in Cherenkov Detectors, PhD thesis, University of Oxford (1992) and M.E. Moorhead and N.W. Tanner, Nucl. Instr. and Meth. A, 378 (1996), 162
- [9] H. Timan, Revue Technique Thomson-CSF, 8 (1976)
- [10] T. Lang, Photocathode characterisation, Thorn EMI research report X.2818/1A (1993)
- [11] R.S. Raghavan, Phys. Rev. Lett., 78 (1997), 3618
- [12] S. Schönert for the LENS collaboration, Proceedings of the 30th International Conference on High Energy Physics, Vol. II, 975, World Scientific, 2000
- [13] C.Buck et al. for the LENS collaboration, Nucl. Phys. B (Proc. Suppl.), 118 (2003), 450
- [14] D. Motta, Feasibility Analysis and Prototype Measurements of a Novel Approach for the Real-Time Spectroscopy of Low Energy Solar Neutrinos, Dissertation, University of Heidelberg (2004)
- [15] O.S. Heavens, Optical Properties of Thin Solid Films, Dover Publication, 1991
- [16] H.G. Tompkins and W.A.McGahan, Spectroscopic Ellipsometry and Reflectometry, a user guide, John Wiley & Sons, 1999
- [17] M. Born, E. Wolf, Principle of optics, Pergamon Press, 1964
- [18] M.F. Weber et al., Science Vol., 287 (2000), 2451