Observation of modified radiative properties of cold atoms
in vacuum near a dielectric surface
Abstract
We have observed a distance-dependent absorption linewidth of cold 87Rb atoms close to a dielectric-vacuum interface. This is the first observation of modified radiative properties in vacuum near a dielectric surface. A cloud of cold atoms was created using a magneto-optical trap (MOT) and optical molasses cooling. Evanescent waves (EW) were used to observe the behavior of the atoms near the surface. We observed an increase of the absorption linewidth with up to 25% with respect to the free-space value. Approximately half the broadening can be explained by cavity-quantum electrodynamics (CQED) as an increase of the natural linewidth and inhomogeneous broadening. The remainder we attribute to local Stark shifts near the surface. By varying the characteristic EW length we have observed a distance dependence characteristic for CQED.
pacs:
42.50.-p, 42.50.Xa, 42.50.PqI Introduction
An electronically excited atom (or molecule) can decay to the ground state by spontaneous emission. The characteristic rate at which this occurs is not simply an intrinsic property of the atom but also depends on the environment. The spontaneous emission rate is proportional to the density of electromagnetic field modes (DOS, or “density of states”), which is determined by the electromagnetic boundary conditions. The DOS can thus be modified, and with it the spontaneous emission rate. The boundary conditions imposed by the environment not only change the radiative linewidth but also induce energy level shifts and thus change the transition frequencies. These include the electrostatic or Van der Waals shift, the Casimir-Polder shift (modification of the Lamb shift), and resonant radiative shifts. For a review see, e.g. Ref. Hin94 .
Modified spontaneous emission was first observed by Drexhage Dre70 ; Dre74 , using dye monolayers separated from an interface by fatty acid layers. Both inhibited and enhanced spontaneous emission have since then been observed by others in a variety of geometries and circumstances HulHilKle85 ; HeiChiTho87 ; VreHunSch93 ; SnoLagPol95 . Remarkably, the radiative linewidth of an atom in vacuo at a distance of the order of an optical wavelength from a dielectric surface has never been investigated experimentally. Energy level shifts have been studied for atom inside cavities SanSukHin92 ; SukBosCho93 and in vapor cells, using selective reflection spectroscopy CheBloRah91 ; FaiSalFic03 . The situation of an atom in front of a distant mirror has recently been investigated using a single trapped ion. Both the broadening of the radiative linewidth and energy level shifts have been reported for this system EscRaaSch01 ; WilBusEsc03 .
In this paper we experimentally investigate the radiative properties of cold (K) atoms of 87Rb close to a glass surface, at a distance on the order of an optical wavelength. Using our method of evanescent-wave spectroscopy CorAmeWol02 we have observed a broadening of the absorption linewidth. We compare our observations with calculations based on CQED.
II Method: evanescent-wave spectroscopy
The radiative linewidth is proportional to the power spectral density of the vacuum field fluctuations at the position of the atom KhoLou91 , i.e. the local DOS. The proximity of a dielectric surface imposes a boundary condition on the field, changing the DOS. This leads to a modification of and to energy level shifts KhoLou91 ; CheBloRah91 ; HinSan91 ; SnoLagPol95 ; CouCouMer96 ; WuEbe99 ; FaiSalFic03 . Both the linewidth broadening and the level shifts are significant mainly at distances , where is the wavelength of the dominant electronic transition. In our case this is the resonance line of Rb, and nm.
Therefore we probe the cold atoms near the glass surface using evanescent-wave (EW) spectroscopy CorAmeWol02 . This method is selectively sensitive to atoms very close to the surface. An EW appears when our probe beam undergoes total internal reflection at the glass surface with index of refraction , see Fig. 1. The optical field on the vacuum side decays exponentially with the distance to the surface, . Atoms can absorb light from the EW, if their distance to the surface is on the order of the decay length . The decay length can be adjusted by changing the angle of incidence according to . By adjusting we can thus vary the distance scale at which the atoms interact with the probe light. By increasing further above the critical angle , the absorption will occur closer to the surface, where is more strongly modified.
For atoms in free space, the absorption profile is given by a Lorentzian profile, centered at the (free-space) atomic transition frequency and with a full width at half maximum (FWHM) equal to the natural linewidth MHz. Both and change in the proximity of the surface. Roughly speaking these -dependent Lorentzians become convoluted with the EW energy density . Therefore, in our experiment also contributes to the observed absorption linewidth through inhomogeneous broadening. We expect the width of the resulting absorption profile to increase with the angle of incidence . In the experiment we measured this by tuning an EW probe laser across the profile and measuring the absorption.
III Experiment
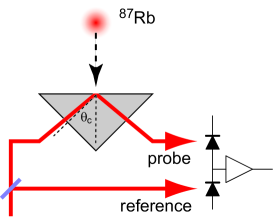
The major part of our experimental setup has been described previously VoiWolCor01 . We produced clouds of cold 87Rb atoms using magneto-optical trapping inside a ultra high vacuum cell (base pressure mbar). After postcooling in optical molasses we ended up with about atoms, at a temperature of 9 K. At this temperature the Doppler width is 90 kHz (FWHM). The cooling lasers were then switched off and the atoms fell down toward the surface of a glass prism, about 3.6 mm below. The center of the cloud reached the prism surface and the EW spot after 27 ms. Just before hitting the surface, the atoms briefly interact with a weak, -polarized, EW probe beam, see Fig. 1. The intensity of the probe was kept well below the saturation intensity to avoid power broadening. Using W and a waist of about 1 mm, the maximum saturation parameter was .
The probe beam was derived from a home-built diode laser system, locked to the crossover resonance in the line of 87Rb (780 nm). We used an acousto-optic modulator (AOM) to shift the probe frequency near resonance with the transition and to tune it across the resonance. Before sending it into the cell, a fraction of the probe beam was split off and sent to a photodiode as a reference. After total internal reflection on the prism surface the probe beam was focused on a second photodiode. The photocurrents of the two photodiodes were subtracted to obtain our signal, typically a fraction of of the probe.
The difference photocurrent was amplified by a low-noise current amplifier (Femto, LCA-100K-50M, 50 MV/A transimpedance) and sent through a low-pass filter (ms) to further reduce the noise. All photodiode signals, including a power monitor and a MOT fluorescence monitor were acquired using a digital storage oscilloscope. The latter two signals were used to normalize the absorption signals for variations in the probe power and shot-to-shot variations in the number of cold atoms.
In Fig. 2 we show a typical EW absorption time trace with the probe beam tuned near resonance, for an angle of incidence . The signal has been averaged 100 to reduce the noise. Without filtering, the absorption signal has a Gaussian shape due to the velocity distribution of the falling atoms. However, in order to suppress slow drifts in the difference photocurrent we used AC coupling (i.e. a high-pass filter) on the oscilloscope. As a result the Gaussian signal has been distorted. Furthermore it is superposed on an exponentially decaying transient originating from switching off the MOT/molasses beams. Although we shielded the photodiodes from the molasses light as much as possible, some light is still detected. Unfortunately the time between switching off the lasers and the arrival of the atoms at the surface is fixed by gravity.
The position of the peak corresponds to the fall time of the atoms. The width is given by the ratio of the size ( mm) and velocity ( m/s) of the atom cloud as it reaches the surface. The height of the peak is mV, which corresponds to an absorbed power of pW. The time-integrated signal amounts to absorbed photons, or scattered photons per atom in the center of the EW. If we tune the probe laser away from resonance, or increase the angle of incidence, the signal amplitude decreases and the number of scattered photons drops to much less than one per atom. Eventually the signal disappears in the noise, which is dominated by shot noise.

IV Data processing
Despite the signal distortion, we can extract the amplitude and width of the original Gaussian, by fitting the filtered time trace to an analytical expression. This expression involves error functions due to the known step response function of the filter. We took the fitted height of the Gaussian as the measure for the amount of absorption. The Gaussian width is essentially constant. Thus, the height of the peak is proportional to the absorbed EW power, which depends on the EW detuning and the angle of incidence.
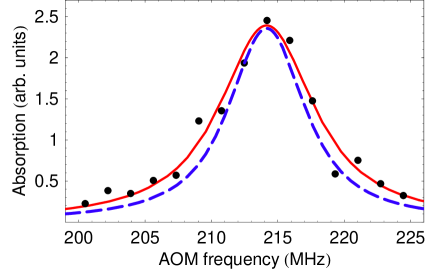
For a given angle of incidence we measured time traces for different detunings of the EW probe. The fitted Gaussian height as a function of probe detuning yields an absorption profile as shown in Fig. 3. From this we extracted a Lorentzian line width by fitting a Voigt profile
| (1) |
where is an amplitude and is the complementary error function. This Voigt profile is the convolution of a Gaussian with a fixed width MHz and a Lorentzian with variable width .
The fixed Gaussian linewidth accounts for the finite spectral width of the probe laser. Our grating stabilized diode laser system has a spectral linewidth comparable to the observed atomic linewidth broadenings TurWebHaw02 ; WieHol91 . We determined the laser linewidth in a separate experiment by observing the beat note between two similar but independently locked diode lasers on a photodiode. The observed decoherence of the beat signal was well described by a Gaussian with a width of 1 MHz. This is the linewidth at short (ms) time scales. For longer timescales we rely on the feedback loop of the laser locking electronics.
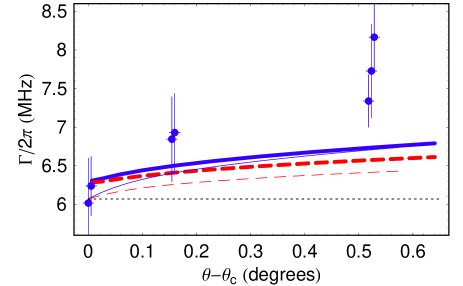
The Lorentzian linewidth contained in the Voigt profile is a fit parameter. We performed measurements of the absorption profile several times for two different angles of incidence ( and ). For each absorption profile we find one value for . The results are shown in Fig. 4. For larger angles, the absorbed power became too small compared to the noise, due to the decreasing EW volume. The vertical error bars in Fig. 4 are entirely determined by the scatter of the datapoints as seen in Fig. 3.
In the limit of large EW decay length, or , we expect to tend to the free-space value . Unfortunately, at angles very close to the critical angle, , the probe beam cannot be treated as a plane wave due to the finite diffraction angle. In order to avoid this complicated situation, we performed an independent check by measuring the linewidth in free space. The same probe laser was used to measure the absorption by the atomic cloud while falling, at a height of 2 mm above the surface. A short flash of probe light was used to illuminate the atoms. The probe beam containing a ”shadow” due to absorption by the atoms was recorded on a CCD camera. In addition to this picture (a), we took two more: a background picture with no probe light (b), and a reference picture with probe light but no atoms (c). The optical density was then obtained as and was measured for different values of the probe detuning. The detuning was varied in a similar way as in the EW probe measurements. The linewidth was again determined by fitting a Voigt profile. We plotted this free-space value in Fig. 4 as the datapoint for . Our measured free-space linewidth is in good agreement with the known value. This shows that there were no unknown systematic broadening effects, such as saturation, stray magnetic fields, or residual Doppler broadening.
V Theory for
We will now compare the measured -dependence of the linewidth to CQED calculations. When the atom approaches the dielectric surface, both the radiative linewidth and the resonance frequency change in a -dependent way. Although the latter does not change the excited state lifetime, it appears as inhomogeneous broadening in the experiment, because the evanescent wave performs an integration over .
The absorption from the EW probe beam can be calculated by performing a spatial integration of the photon scattering rate over the vacuum half space . The photons that are scattered out of the EW by atoms are missing from the reflected probe beam so that the reflectivity drops below unity. This approach works well if the absorption is small (, i.e. no probe depletion). In the limit of low saturation the photon scattering rate is , with the saturation parameter given by
| (2) |
where is the EW energy density and mW/cm2 is the (free space) saturation intensity. Note that an increase of not only increases the Lorentzian width but also multiplies into the photon scattering rate, thus increasing the on-resonance rate. This effect tends to favor the detection of atoms near the surface.
The modification of the radiative linewidth of an atom near a plane dielectric surface has been described theoretically in terms of dipole damping rates and KhoLou91 ; CouCouMer96 . The subscripts refer to dipoles oriented perpendicular and parallel to the surface, respectively. The dipole damping rates vary with the distance to the surface , in the notation of Ref. CouCouMer96 (note also 111Note that there appears a printing error in Eq. (58) of CouCouMer96 ; the coefficients and have been interchanged.):
| (4) | |||||
Here , and and are the Fresnel reflection coefficients for and polarization:
| (5) | |||||
| (6) |
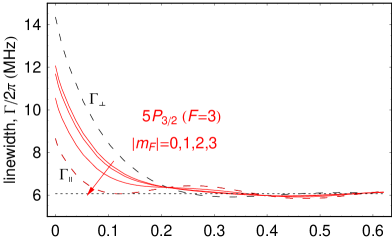
In our experiment we probe 87Rb atoms on the transition . An atom in the excited magnetic hyperfine state can decay to the ground state with . Choosing the quantization axis perpendicular to the surface, the decay channel is governed by , the channels by . The decay rate for a given sublevel is then given by
| (7) |
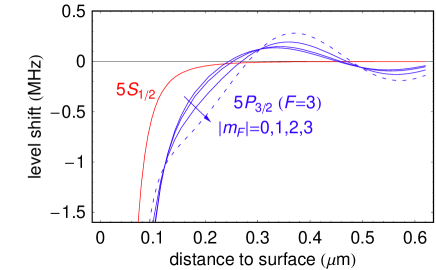
where is shorthand for the square of a Clebsch-Gordan coefficient, . Note that this implies that close to the surface the states have different lifetimes CouCouMer96 . The different curves are shown in Fig. 5, together with and . The curve for is not relevant in our experiment because our -polarized probe does not excite these -states. Our 87Rb atoms are in a random mixture of all five states. The probe light is linearly polarized, perpendicular to the surface, thus exciting transitions.
VI Analysis; comparison with theory
Integrating the photon scattering rate over all and averaging over the -states, we arrive at the absorption of the probe; expressed as a fraction:
| (8) |
where is the atom density. It is -dependent due to the ground-state level shift that accelerates the atoms to the surface. This is well approximated by the Van der Waals potential , resulting in a depletion of the density near the surface according to with nm. Here J m3 is the Van der Waals coefficient and is the kinetic energy with which the atoms fall onto the surface.
The -dependence of the laser detuning in Eq. (8) accounts for the energy level shifts by unequal amounts for the ground and excited states. The shift of the ground state is dominated by the Van der Waals shift . The shift of the excited state is more complicated, containing also a resonant component with oscillatory -dependence. We have used expressions for the shifts of both the ground and the excited states from Ref. HinSan91 , using transition line strengths taken from Ref. SafWilCla04 . We have extended the expressions from HinSan91 to account for hyperfine structure. Furthermore we have multiplied the results by a factor , because our surface is a dielectric instead of a mirror. This is known to be correct in the nonretarded limit EbeWu03 , which gives the dominant contribution in the experiment.
It is evident from Eq. (8) that the absorption profile is a convolution of Lorentzians with different widths, amplitudes, and central frequencies. The resulting absorption profiles are strictly speaking no longer Lorentzian. We have numerically calculated the expected absorption profiles using Eq. (8). In practice the deviation from a Lorentzian is sufficiently small that we can fit a Lorentzian to the calculated profiles. The fitted widths are plotted in Fig. 4, together with the measured widths. In the same Figure we also show the result of the calculation if we do not take the level shifts into account. Clearly, the effect of the level shifts on the observed linewidth is comparable with the direct broadening effect.
From the Figure we also see that the observed broadening of up to about 25% is larger than the calculated broadening by about a factor two. This cannot be explained by the most obvious sources of spurious broadening. These include Doppler broadening (%), Zeeman broadening due to a spurious magnetic field (%), and power broadening (%). Furthermore these broadening mechanisms do not show the observed signature of increasing with the angle of incidence. A drift of the laser frequency can be excluded by the same argument, plus the free-space data point.
A possible mechanism that would have the correct signature is transit time broadening. To investigate this we numerically integrated the time-dependent optical Bloch equations for an atom moving through the EW field. We made the approximation that the atom is a two-level system. First, the known ground state level shift was used to solve for the accelerated motion towards the surface. This solution was then used to define a time-dependent Rabi-frequency , and similarly for the detuning , and radiative linewidth . Using these time dependent parameters we numerically integrated the optical Bloch equations to obtain the time evolution of the Bloch vector . Note that power broadening is naturally included in this method. The number of photons scattered by the atom on its way down to the surface was obtained as B:CohDupGry92 . Again an averaging over the magnetic -levels was performed. Finally the probe detuning was varied and a Lorentzian fit to the obtained absorption profile was performed, as before. The results of the Bloch equation approach are also shown in Fig. 4. The two calculations yield very similar results. This shows that transit time broadening does not explain the discrepancy between calculations and measurements.
As a tentative explanation we invoke the presence of local Stark shifts caused by charged or polarized particles on the surface. Based on a straightforward model calculation we find that a surface charge density of yields a 10% linewidth increase. Remarkably, such a charge density corresponds to an average distance between the charges of order nm, which is just the distance scale to which our experiment is very sensitive. These calculations only weakly reproduce the angular dependence shown by the data. Recently McGuirk et al. have reported that Rb adsorbed on a Si or Ti surface generates local Stark shifts that were measurable as a change in the trapping frequency of their magnetic trap McGHarObr04 . The authors mention that similar effects on a glass surface like ours are very small. However, their experiment measured only changes upon depositing clouds of Rb atoms on the surface, whereas our experiment is also sensitive to statically present adsorbates. Furthermore, there may be other charged or polarized adsorbates on the surface. For these reasons local Stark shifts do seem to present a likely mechanism to explain our results. Our experiment is also complementary to Ref. McGHarObr04 in the sense that the latter measures a global effect, whereas our experiment is sensitive only to local variations of the electric fields. Unfortunately we have no detailed information about possible adsorbates to make a more quantitative analysis.
VII Conclusion
In conclusion, we have observed a broadening of the absorption linewidth of the resonance line of 87Rb, caused by the surface. Part of the broadening can be explained as a combined effect of CQED linewidth broadening and level shifts due to the proximity of a dielectric surface. The observed broadening of up to 25% was about twice that expected from CQED calculations. The likely candidate to explain this discrepancy are local Stark shifts due to charged or polarized adsorbates on the surface.
Acknowledgements.
This work is part of the research program of the Stichting voor Fundamenteel Onderzoek van de Materie (Foundation for the Fundamental Research on Matter) and was made possible by financial support from the Nederlandse Organisatie voor Wetenschappelijk Onderzoek (Netherlands Organization for the Advancement of Research).References
- (1) E. A. Hinds, Adv. At. Mol. Opt. Phys., Suppl. 2, 1 (1994).
- (2) K. H. Drexhage, J. Lumin. 1-2, 693 (1970).
- (3) K. H. Drexhage, in Progress in Optics XII, edited by E. Wolf (North-Holland, Amsterdam, 1974), p. 163.
- (4) R. G. Hulet, E. S. Hilfer, and D. Kleppner, Phys. Rev. Lett. 55, 2137 (1985).
- (5) D. J. Heinzen, J. J. Childs, J. E. Thomas, and M. S. Feld, Phys. Rev. Lett. 58, 1320 (1987).
- (6) A. M. Vredenberg et al., Phys. Rev. Lett. 71, 517 (1993).
- (7) E. Snoeks, A. Lagendijk, and A. Polman, Phys. Rev. Lett. 74, 2459 (1995).
- (8) V. Sandoghdar, C. Sukenik, E. Hinds, and S. Haroche, Phys. Rev. Lett. 68, 3432 (1992).
- (9) C. Sukenik et al., Phys. Rev. Lett. 70, 560 (1993).
- (10) M. Chevrollier, D. Bloch, G. Rahmat, and M. Ducloy, Opt. Lett. 16, 1879 (1991).
- (11) H. Failache et al., Eur. Phys. J. D 23, 237 (2003).
- (12) J. Eschner, C. Raab, F. Schmidt-Kaler, and R. Blatt, Nature 413, 495 (2001).
- (13) M. A. Wilson et al., Phys. Rev. Lett. 91, 213602 (2003).
- (14) R. A. Cornelussen et al., Eur. Phys. J. D 21, 347 (2002).
- (15) H. Khosravi and R. Loudon, Proc. R. Soc. London A 433, 337 (1991).
- (16) E. A. Hinds and V. Sandoghdar, Phys. Rev. A 43, 398 (1991).
- (17) J.-Y. Courtois, J.-M. Courty, and J. C. Mertz, Phys. Rev. A 53, 1862 (1996).
- (18) S.-T. Wu and C. Eberlein, Proc. R. Soc. London A 455, 2487 (1999).
- (19) D. Voigt et al., C. R. Acad. Sci. Paris, Série IV 2, 619 (2001).
- (20) L. D. Turner, K. P. Weber, C. J. Hawthorn, and R. E. Scholten, Opt. Commun. 201, 391 (2002).
- (21) C. E. Wieman and L. Hollberg, Rev. Sci. Instrum. 62, 1 (1991).
- (22) M. S. Safronova, C. J. Williams, and C. W. Clark, Phys. Rev. A 69, 022509 (2004).
- (23) C. Eberlein and S.-T. Wu, Phys. Rev. A 68, 033813 (2003).
- (24) C. Cohen-Tannoudji, J. Dupont-Roc, and G. Grynberg, Atom-photon interactions (Wiley, New York, 1992).
- (25) J. M. McGuirk, D. M. Harber, J. M. Obrecht, and E. A. Cornell, Phys. Rev. A 69, 062905 (2004).