Conformational properties of neutral and charged alanine and glycine chains
Abstract
We have investigated the potential energy surface for neutral and charged alanine and glycine chains consisting of up to 6 amino acids. For these molecules we have calculated potential energy surfaces as a function of the Ramachandran angles and . Our calculations are performed within ab initio theoretical framework based on the density functional theory and also within semi-empirical model approaches. We have demonstrated that the excessive positive charge of the system influences strongly its geometrical and conformational properties. With increasing of the excessive charge amino acid chains become unstable and decay into two or more fragments. We have analysed how the secondary structure of polypeptide chains influences the formation of the potential energy landscapes. We have calculated the energy barriers for transitions between different molecular conformations and determined the ones being energetically the most favourable.
I Introduction
This work was presented on ”The eighth European Conference on Atomic and Molecular Physics”
(ECAMPVIII) (Rennes, France, July 6-10, 2004) and on the
”Electronic Structure Simulations of Nanostructures” workshop (ESSN2004)
(Jyväskylä Finland, June 18-21, 2004).
Amino acids are building blocks for proteins. Recently, it became possible to study experimentally fragments of proteins, i.e. chains of amino acids, in a gas phase with the use of the MALDI mass spectroscopy Beavis96 ; Cohen96 ; Karas88 . Ab initio theoretical investigations of amino acid chains began also only recently Salahub01 ; Pliego03 ; Srinivasan02 ; Head-Gordon91 ; Gould94 ; Beachy97 ; LesHouches and are still in its infancy.
We have investigated the potential energy surface for neutral and charged alanine and glycine chains consisting of up to 6 amino acids. For these molecules we have calculated potential energy surfaces as a function of the Ramachandran angles and often used for the characterization of the polypeptide chains Gunasekaran96 ; Protbase . Our calculations are performed within ab initio theoretical framework based on the density functional theory and also within semi-empirical model approaches. We have demonstrated that the excessive positive charge of the system influences strongly its geometrical and conformational properties. With increasing of the excessive charge amino acid chains become unstable and decay into two or more fragments. We have analysed how the secondary structure of polypeptide chains influences the formation of the potential energy landscapes. We have calculated the energy barriers for transitions between different molecular conformations and determined the ones being energetically the most favourable.
II Theoretical methods
Our exploration of the potential energy surface of alanine and glycine chains is based on the density-functional theory (DFT) accounting for all electrons in the system and on the semiempirical AM1 method Dewar77 ; Davis81 ; Anders93 .
Within the DFT one has to solve the Kohn-Sham equations, which read as (see e.g. MetCl99 ; LesHouches ):
| (1) |
where the first term represents the kinetic energy of the -th electron, and describes its attraction to the ions in the cluster, is the Hartree part of the interelectronic interaction:
| (2) |
and is the electron density:
| (3) |
where is the local exchange-correlation potential, are the electronic orbitals and is the number of electrons in the cluster.
The exchange-correlation potential is defined as the functional derivative of the exchange-correlation energy functional:
| (4) |
The approximate functionals employed by DFT methods partition the exchange-correlation energy into two parts, referred to as exchange and correlation parts. Both parts are the functionals of the electron density, which can be of two distinct types: either local functional depending on only the electron density or gradient-corrected functionals depending on both and its gradient, . In literature, there is a variety of exchange correlation functionals. In our work we use the Becke’s three parameter gradient-corrected exchange functional with the gradient-corrected correlation functional of Lee, Yang and Parr (B3LYP) Becke88 ; LYP ; Parr-book . We utilize the standard 6-311++G(d,p) and 6-31G(2d,p) basis set to expand the electronic orbitals .
III Results of calculation
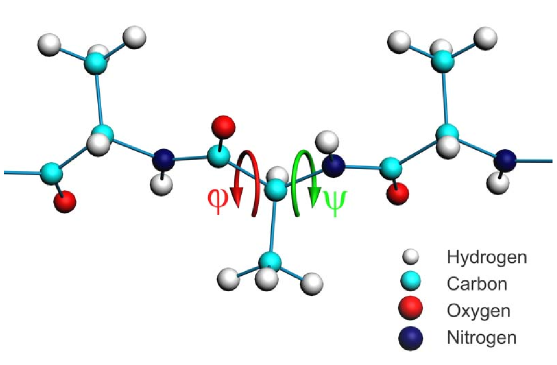
In figure 1 we show the dihedral angles and that are used to characterize the potential surface of the polypeptide chain.
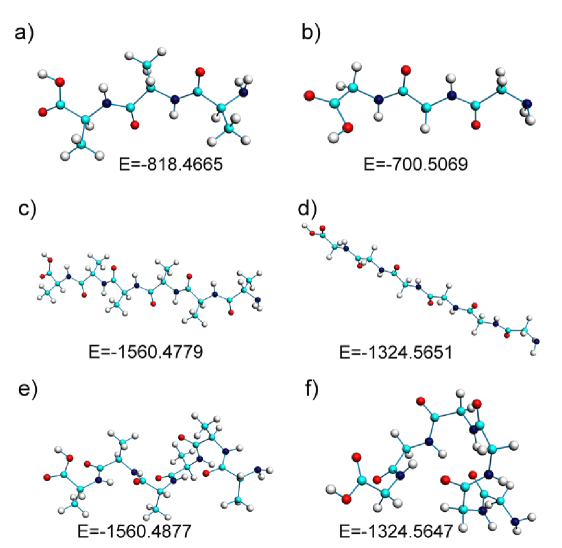
In figure 2 we present the optimized geometries of the alanine and glycine polypeptide chains that have been used for the exploration of the potential energy surface. All geometries were optimized with the B3LYP density functional. We used the 6-31++G(d,p) and 6-31G(2d,p) basis sets to expand the electronic orbitals in the molecule.
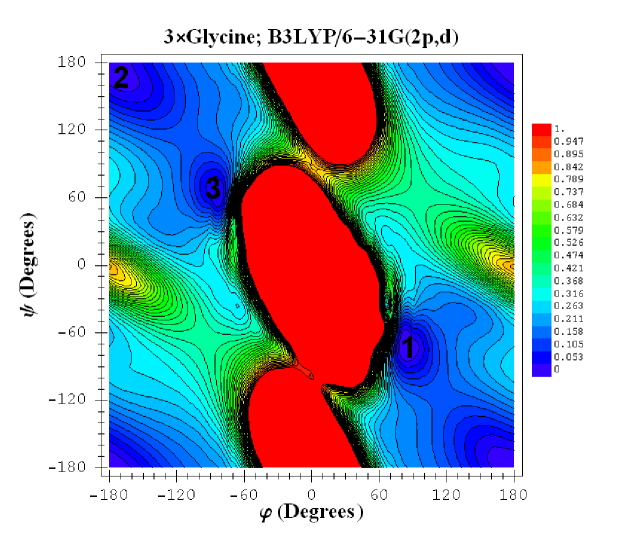
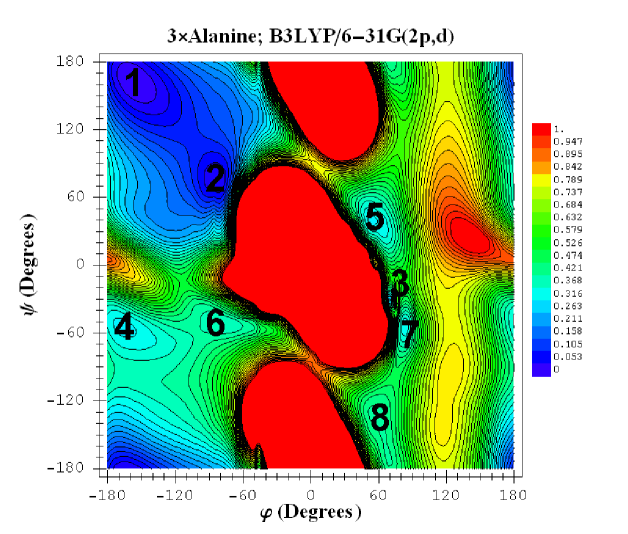
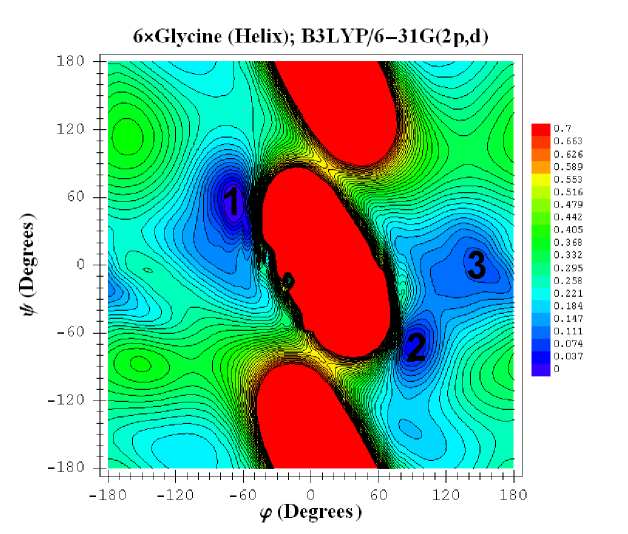
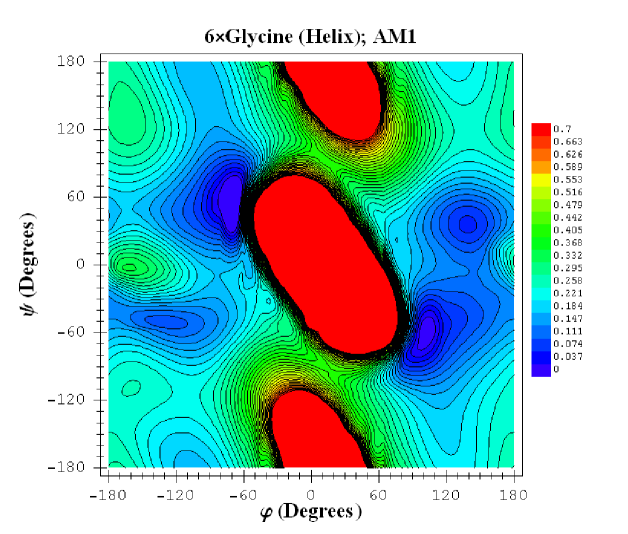
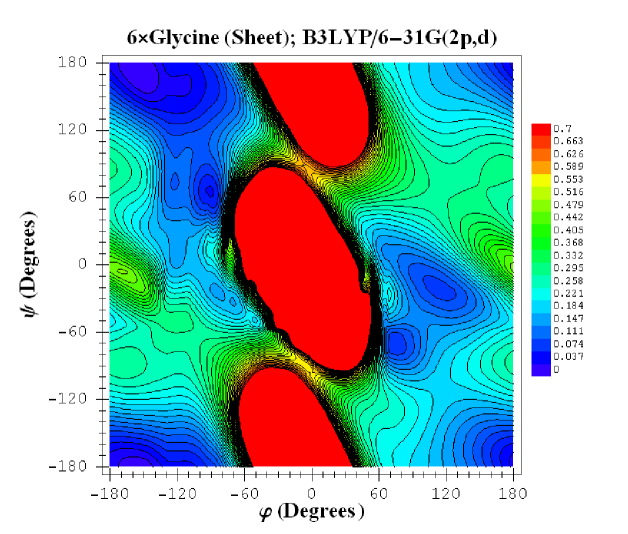
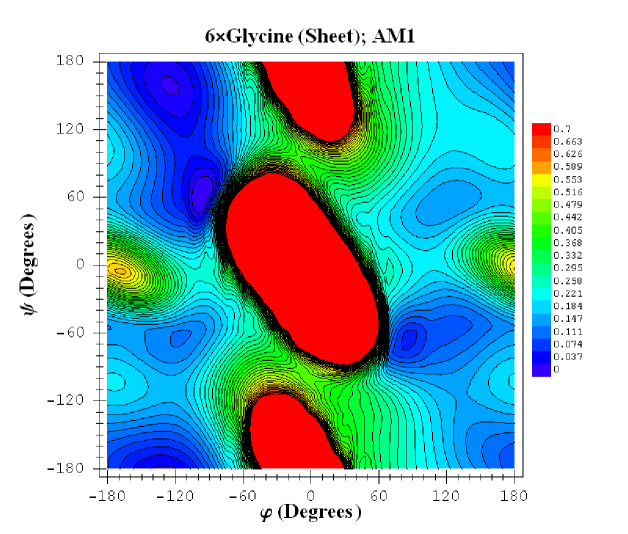
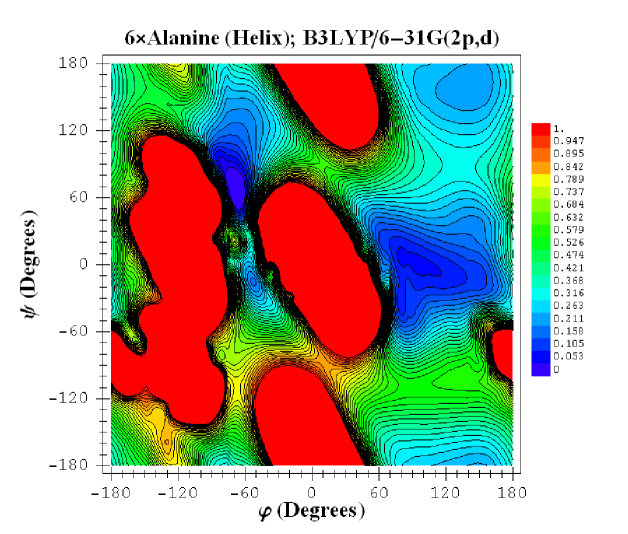
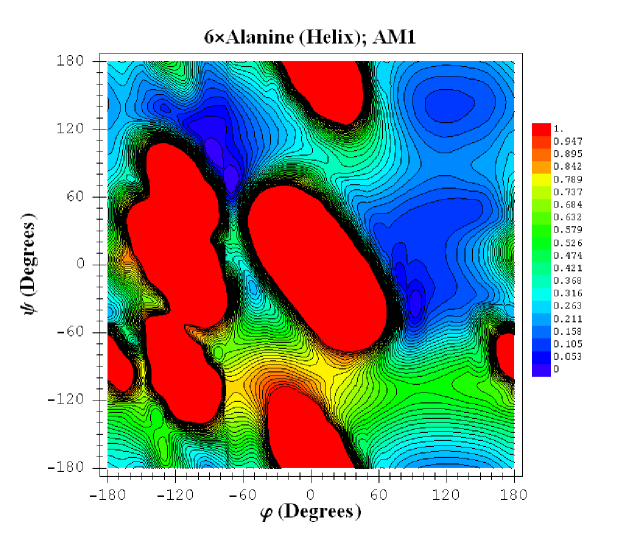
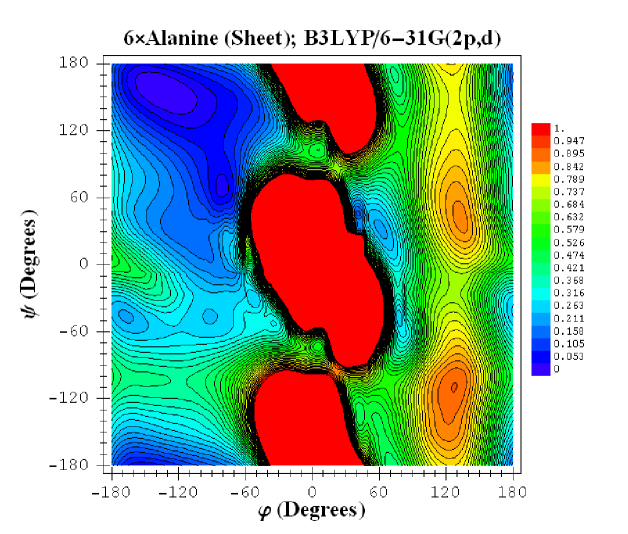
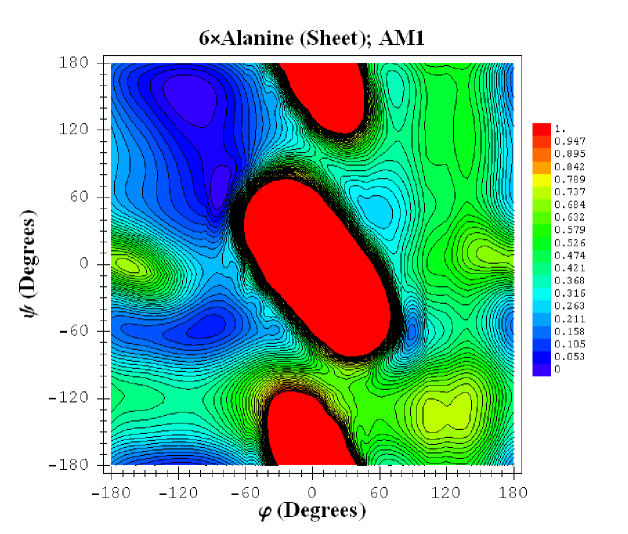
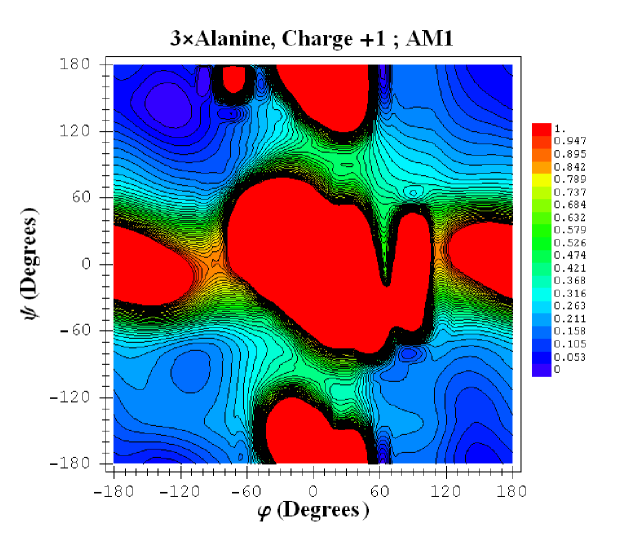
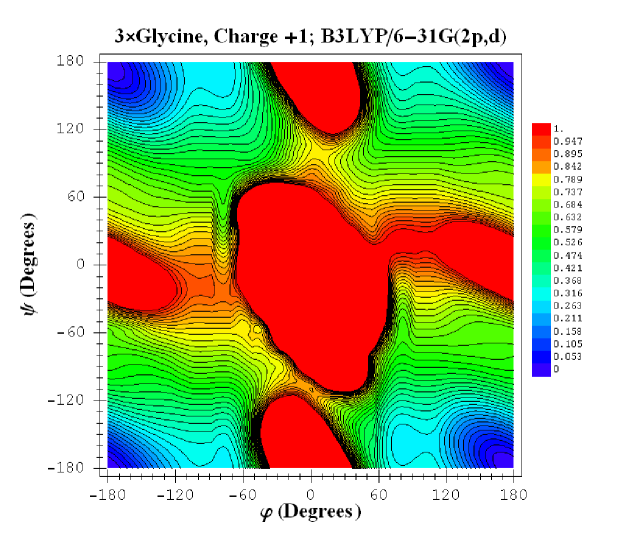
In figures 3-12 we present the potential energy surfaces for the polypeptide chains presented in figure 2.
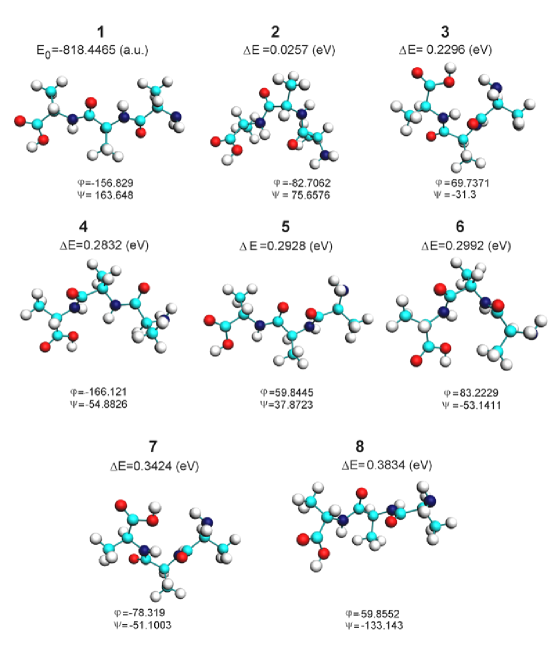
In figure 13 we show the optimized structures of the alanine tripeptide. Different geometries correspond to the minima on the potential energy surface (see contour plot in figure 4).
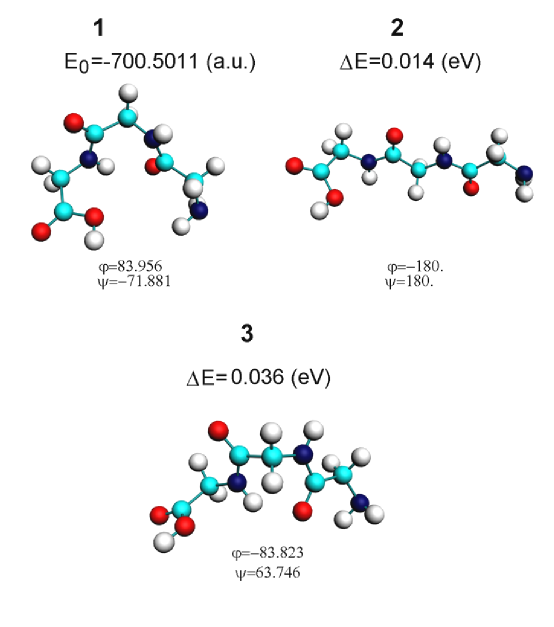
In figure 14 we show the optimized structures of the glycine tripeptide. Different geometries correspond to the minima on the potential energy surface (see contour plot in figure 3).
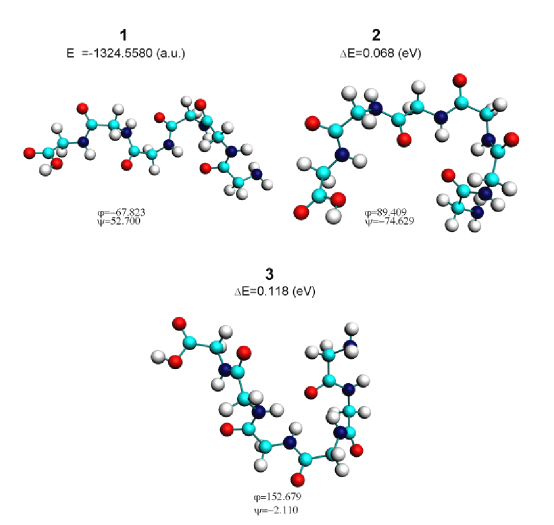
In figure 15 we show the optimized structures of the glycine hexapeptide in helix conformation. Different geometries correspond to the minima on the potential energy surface (see contour plot in figure 5).
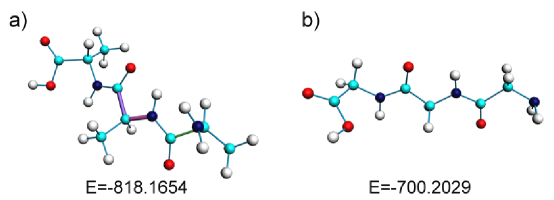
The geometries of singly charged alanine and glycine dipeptides are shown in figure 16.
The ionization of the system changes dramatically its potential energy surface and the secondary structure as it is seen from the contour plots presented in figures 17 and 18.
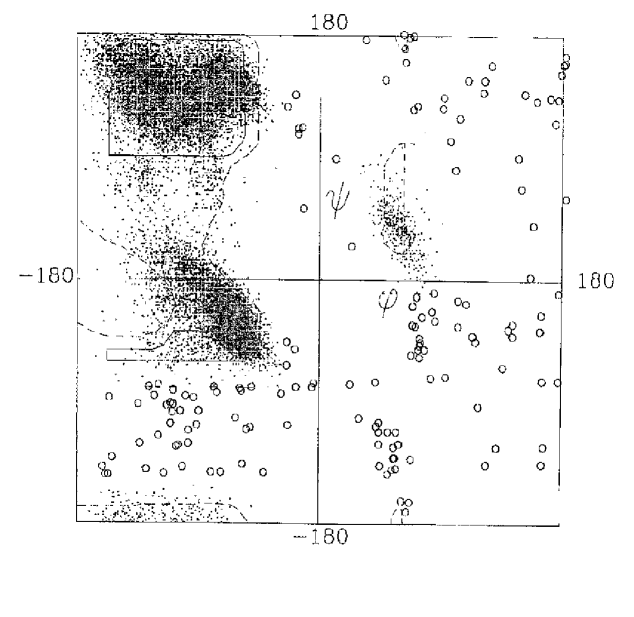
In figure 19 we show the distribution of observed dihedral angles , of non-Glycine residues in protein structures selected from the Brookhaven Protein Data Bank Gunasekaran96 ; Protbase . The circles show conformations corresponding to the forbidden regions.
References
- (1) R.C. Beavis and B.T. Chait, Methods in Enzymol. 270, 519 (1996)
- (2) S.L. Cohen and B.T. Chait, Anal. Chem. 68, 31 (1996)
- (3) M. Karas and F. Hillenkamp Anal. Chem. 60, 2299 (1988)
- (4) D. Wei, H. Guo and D.R. Salahub, Phys. Rev E 64, 011907 (2001)
- (5) P. Pliego-Pastrana, M. D. Carbajal-Tinoco, Phys. Rev. E 68, 011903 (2003)
- (6) R. Srinivasan and G.D. Rose, Proteins: Structure, Function, and Genetics 47, 489 (2002)
- (7) T. Head-Gordon, M. Head-Gordon, M.J. Frisch, Ch.L. Brooks and J.A. Poplet, J. Am. Chem. Soc. (113), 5989 (1991)
- (8) I.R. Gould, W.D. Cornell and I.H. Hillier, J. Am. Chem. Soc. 116, 9250 (1994)
- (9) M.D. Beachy, D. Chasman, R.B. Murphy, Th.A. Halgren and R.A. Friesner, J. Am. Chem. Soc. 119, 5908 (1997)
- (10) Atomic Clusters and Nanoparticles, NATO Advanced Study Institute, les Houches Session LXXIII, les Houches, 2000, edited by C. Guet, P. Hobza, F. Spiegelman and F. David (EDP Sciences and Springer Verlag, Berlin, 2001).
- (11) K. Gunasekaran, C. Ramakrishnan and P. Balaram J. Mol. Biol. 264, 191 (1996)
- (12) http://www.rcsb.org/pdb/
- (13) M. Dewar and W. Thiel, J. Am. Chem. Soc. 99, 4499 (1977)
- (14) L. P. Davis, et. al., J. Comp. Chem. 2, 433 (1981)
- (15) E. Anders, R. Koch and P. Freunscht, J. Comp. Chem. 14, 1301 (1993)
- (16) W. Ekardt (ed.), Metal Clusters (Wiley, New York ,1999)
- (17) A.D. Becke, Phys. Rev. A 38, 3098 (1988)
- (18) C. Lee, W. Yang and R.G. Parr, Phys. Rev. B 37, 785 (1988)
- (19) R.G. Parr and W. Yang, Density-Functional Theory of Atoms and Molecules, (Oxford University Press, Oxford, New York, 1989).