Error Probability of DPSK Signals with Intrachannel Four-Wave-Mixing in Highly Dispersive Transmission Systems
Abstract
A semi-analytical method evaluates the error probability of DPSK signals with intrachannel four-wave-mixing (IFWM) in a highly dispersive fiber link with strong pulse overlap. Depending on initial pulse width, the mean nonlinear phase shift of the system can be from 1 to 2 rad for signal-to-noise ratio (SNR) penalty less than 1 dB. An approximated empirical formula, valid for penalty less than 2 dB, uses the variance of the differential phase of the ghost pulses to estimate the penalty.
Index Terms:
DPSK, intrachannel four-wave-mixing, fiber nonlinearitiesI Introduction
Differential phase-shift keying (DPSK) signal has been studied widely recently for long-haul lightwave transmission systems [1, 2, 3, 4]. In additional to the 3-dB receiver sensitivity improvement to on-off keying (OOK), high-speed DPSK signal also has larger tolerance to fiber nonlinearities than OOK signal [5]. Most DPSK experiments use return-to-zero (RZ) short pulse and launch a constant-intensity pulse train with phase modulated to each RZ pulse.
For 40-Gb/s signal in dispersive fiber, each RZ pulse broadens very fast by chromatic dispersion and overlaps with each other. The pulse-to-pulse interaction gives intrachannel cross-phase modulation (IXPM) and four-wave-mixing (IFWM) [6, 7]. As a constant pulse train, IXPM induces identical phase modulation and timing jitter to all pulses and does not affect DPSK signal. However, IFWM adds ghost pulses to each DPSK RZ pulse [8, 9, 10, 11]. DPSK signal also has higher tolerance to IFWM than OOK signal [11].
When the IFWM induced ghost pulses are evaluated numerically, the error probability of DPSK signal can be calculated semi-analytically. This letter studies the statistical properties of IFWM in more detail using a method similar to [9, 11]. Both the error probability and signal-to-noise ratio (SNR) penalty are calculated.
II Statistics of IFWM
If the signal launched to the fiber link is Gaussian pulse train with initial -pulse width of or full-wide-half-maximum (FWHM) pulse with of , for a bit-interval of , the th pulse is , where is phase modulated by either or . From [8, 9, 11], the peak amplitude of the ghost pulses induced from IFWM, from the , , and th pulses to the pulse at is
| (1) |
where and , is the nonlinear coefficient and is the attenuation coefficient of the fiber, is the coefficient of group velocity dispersion, and is the fiber length per span. Here, we exclude both IXPM with either or and self-phase modulation with .
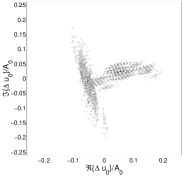
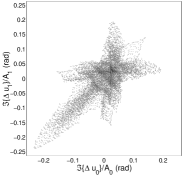
Figure 1(a) shows the distribution of the normalized complex electric field of with the unit of radian. Figure 1(b) shows the distribution of the peak phase shift of versus between two consecutive time intervals, where and are the peak-amplitude of ghost pulses and is the imaginary part of a complex number. The ghost pulses of and include all contributions of for a 16-bit DPSK signal with about 64,000 combinations. Figure 1(a) is for ghost pulse at the center bit and Fig. 1(b) is for the center two bits. If the pulse amplitude of is significantly larger than the IFWM ghost pulses, and give approximately the phase shift [11].
 |
 |
| (a) | (b) |
Figures 1 are obtained for an -span fiber link with 100 km of fiber per span with a normalized launched power of unity mean nonlinear phase shift of rad, where is the launched power, and is the effective nonlinear length per span. identical fiber spans are repeated one after another with 100% dispersion compensation at the end of each fiber span. For arbitrary fiber link configuration, instead of one integration of (1) are required. IFWM ghost pulses add coherently span after span as the worst case. The fiber link has an attenuation coefficient of dB/km. With bit interval of ps, DPSK signal has a data rate of 40 Gb/s. The initial pulse width is ps, for a duty cycle of about . The fiber dispersion is ps2/km, corresponding to ps/km/nm at the wavelength of m for standard single-mode fiber.
The distribution of Fig. 1(a) is very irregular and has significant discrepancy with Gaussian distribution. Similar to Wei and Liu [11, Fig. 2], Figure 1(b) is only symmetrical with respect to . The difference of Fig. 1(b) with [11] is for a lossy instead of lossless fiber. With span by span dispersion compensation and for lossy fiber, 50% precompensation of dispersion increases instead of reduces IFWM. The phase of is correlated with with a correlation coefficient of about 0.58. For repeated identical fiber spans, Figures 1 are valid for single- and multi-span systems with rad. Note that both and are zero mean. Not shown in Figs. 1, the real parts of and have a correlation coefficient of about -0.54.
III Error Probability for DPSK Signals
The error probability of DPSK signals with IFWM is difficult to find analytically. From Figs. 1, the distribution of the IFWM induced ghost pulses is not Gaussian distributed. With the distribution of Fig. 1, the error probability of DPSK signal with IFWM can be calculated semi-analytically.
Assumed for simplicity that the transmitted phases at and are identical and, without loss of generality, the transmitted signals are . With optical amplifier noise of , ignored the constant factor of interferometer loss and photodiode responsivity, the photocurrent is [12]
| (2) | |||||
A decision error occurs if .
Given and , the two terms in (2) are independent of each other and have a noncentral chi-square distribution [13, pp. 41-44]. Each term of (2) has the same noise variance of where with as the noise variance per dimension. The noncentralities of the two terms of (2) are and , respectively. From [13, App. B] [14], the probability of is equal to
| (3) |
where is the Marcum function and
| (4) | |||||
| (5) |
where is the SNR without taking into account the ghost pulses. Evaluated simi-analytically using the distribution of Figs. 1, the error probability is equal to
| (6) |
where denotes expectation.
When the sequence of is changed to with all odd positions changing sign, from (1), remains the same but changes sign. As and remain the same for Fig. 1(b), the error probability for the case with is the same as that of (6).
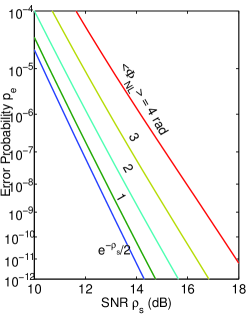
Figure 2 shows the error probability as a function of SNR for DPSK signal with IFWM induced ghost pulses. The error probability without IFWM of [13, Sec. 5.2.8] is also shown for comparison. The semi-analytical formula of (6) with (3) is used to calculate the error probability based on IFWM ghost pulse distribution of Figs. 1.
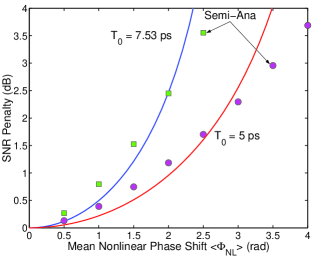
Figure 3 shows the SNR penalty for as a function of the mean nonlinear phase shift of . In additional to the SNR penalty corresponding to Fig. 2, Figure 3 also shows the penalty when the initial pulse width is ps for a duty cycle of 1/2. For 1-dB SNR penalty, the mean nonlinear phase shift must be less than 1.25 and 1.80 rad for initial pulse width of and ps, respectively. The SNR penalty is smaller for small initial pulse width of ps.
If the IFWM induced ghost pulses are assumed as Gaussian distributed, the noise increases to at . However, the SNR of cannot be used directly to find the error probability due the correlation between the ghost pulses of and . The phase variance of is equal to about [13, Sec. 5.2.7]. The variance of the differential phase is and should compare with
| (7) |
due to IFWM ghost pulses. The SNR penalty can be empirically estimated as , where 20 is the SNR for a DPSK error probability of . This empirical formula finds the SNR penalty based on the variance of the differential phase. Figure 3 also shows the SNR penalty from the empirical approximation. For SNR penalty less than 2 dB, the empirical approximation underestimates the SNR penalty by less than 0.25 dB. For SNR penalty larger than 2 dB, the approximation overestimates the SNR penalty.
The empirical approximation still requires extensive numerical calculations to find the variance of from many combinations of bit sequence. The semi-analytical method needs one further step to find the error probability of (3) for each term of and , and then averaging of (6).
The above analysis and numerical results always used the peak amplitude of the ghost pulses and the signal pulses. The pulse width of the ghost pulses is ignored for simplicity. However, the IFWM ghost pulse broadens to times the signal pulse width [8, 9]. As the power is proportional to the pulse width, the ghosts pulse has times larger energy than the signal for the same peak amplitude. In the worst case, the -axis of Fig. 3 must scale by a factor of . However, the scale factor depends on the bandwidth of the optical and electrical filters in the receiver.
If optical match filter precedes the direct-detection DPSK receiver and the electric filter at the receiver has a wide bandwidth that does not distort the signal, the IFWM amplitude is increased by a factor of by the receiver, slightly less than the ratio of . If both the optical and electrical filters have a very wide bandwidth, allowing too much noise to the receiver, the peak amplitude directly transfers to the receiver. If the optical filter has a wide bandwidth but the electrical filter is a bandwidth Bessel filter, IFWM increases by a factor of 1.19 and 1.33 for and ps, respectively. In practical system design, Figure 3 must be modified to take into account the design of both receiver and transmitter. Note that the mean nonlinear phase shift of Fig. 3 is a simple system parameter to evaluate.
Figure 3 shows that DPSK signal with IFWM can tolerate a far larger mean nonlinear phase shift of than DPSK signal with nonlinear phase noise of rad for 1-dB penalty [15]. However, Ho [15] is for return-to-zero (NRZ) signal without pulse distortion and deduces that RZ signal has lower tolerance to nonlinear phase noise. We are currently developing model for RZ signal with nonlinear phase noise in highly dispersive systems for a fair comparison.
IV Conclusion
When the peak amplitude of IFWM induced ghost pulses is evaluated numerically, the error probability of DPSK signals can be found semi-analytically. For a SNR penalty less than 1 dB, the mean nonlinear phase shift of the system must be less than 1 to 2 rad depending on the initial pulse width. An empirical approximation is also used to find the SNR penalty up to 2 dB.
References
- [1] A. H. Gnauck et al., “2.5 Tbs (6442.7 Gbs) transmission over 40 100 km NZDSF using RZ-DPSK format and all-Raman-amplified spans,” in Opt. Fiber Commun. Conf., 2002, postdeadline paper FC2.
- [2] B. Zhu et al., “6.4-Tb/s (16042.7 Gb/s) transmission with 0.8 bit/s/Hz spectral efficiency over 32100 km of fiber using CSRZ-DPSK format,” in Opt. Fiber Commun. Conf., 2003, postdeadline paper PD19.
- [3] C. Rasmussen et al., “DWDM 40G transmission over trans-Pacific distance (10,000 km) using CSRZ-DPSK, enhanced FEC and all-Raman amplified 100 km Ultra-WaveTM fiber spans,” in Opt. Fiber Commun. Conf., 2003, postdeadline paper PD18.
- [4] J.-X. Cai et al., “RZ-DPSK field trial over 13,100 km of installed non slope-matched submarine fibers,” in Opt. Fiber Commun. Conf., 2004, postdeadline paper PDP34.
- [5] C. Xu, X. Liu, and X. Wei, “Differential phase-shift keying for high spectral efficiency optical transmissions,” IEEE J. Sel. Top. Quantum Electron., vol. 10, no. 2, pp. 281–293, 2004.
- [6] I. Shake, H. Takara, K. Mori, S. Kawanishi, and Y. Yamabayashi, “Influence of inter-bit four-wave mixing in optical TDM transmission,” Electron. Lett., vol. 34, no. 16, pp. 1600–1601, 1998.
- [7] R.-J. Essiambre, B. Mikkelsen, and G. Raybon, “Intra-channel cross-phase modulation and four-wave mixing in high-speed TDM systems,” Electron. Lett., vol. 35, no. 19, pp. 1576–1578, 1999.
- [8] A. Mecozzi, C. B. Clausen, and M. Shtaif, “Analysis of intrachannel nonlinear effects in highly dispersed optical pulse transmission,” IEEE Photon. Technol. Lett., vol. 12, no. 4, pp. 292–294, 2000.
- [9] A. Mecozzi, C. B. Clausen, M. Shtaif, S.-G. Park, and A. H. Gnauck, “Cancellation of timing and amplitude jitter in symmetric links using highly dispersed pulses,” IEEE Photon. Technol. Lett., vol. 13, no. 5, pp. 445–447, 2001.
- [10] M. J. Ablowitz and T. Hirooka, “Resonant intrachannel pulse intraction in dispersion-managed transmission systems” IEEE J. Sel. Top. Quantum Electron., vol. 8, no. 3, pp. 603–614, 2002.
- [11] X. Wei and X. Liu, “Analysis of intrachannel four-wave mixing in differential phase-shift keying transmission with large dispersion,” Opt. Lett., vol. 28, no. 23, pp. 2300–2302, 2003.
- [12] K.-P. Ho, “The effect of interferometer phase error on direct-detection DPSK and DQPSK signals,” IEEE Photon. Technol. Lett., vol. 16, no. 1, pp. 308–310, 2004.
- [13] J. G. Proakis, Digital Communications, New York: McGraw Hill, 4th ed., 2000.
- [14] S. Stein, “Unified analysis of certain coherent and noncoherent binary communications systems,” IEEE Trans. Info. Theory, vol. IT-10, no. 1, pp. 43–51, 1964.
- [15] K.-P. Ho, “Error probability of DPSK signals with cross-phase modulation induced nonlinear phase noise,” IEEE J. Sel. Top. Quantum Electron., vol. 10, no. 2, pp. 421–427, 2004.