Observation of light dragging in rubidium vapor cell
Abstract
We report on the experimental demonstration of light dragging effect due to atomic motion in a rubidium vapor cell. We found that the minimum group velocity is achieved for light red-shifted from the center of the atomic resonance, and that the value of this shift increases with decreasing group velocity, in agreement with the theoretical predictions by Kocharovskaya, Rostovtsev, and Scully [Phys. Rev. Lett. 86, 628 (2001)].
pacs:
42.50.Gy, 03.30.+pThe phenomenon of light dragging by a moving medium has a two century long history paulibook ; LLbook . Starting with Fresnel’s ether theory fresnel18acp and Fizeau’s observation of light dragging fizeau51cras , several investigations of this effect were performed before the advent of relativity. Later, the special theory of relativity greatly advanced the understanding of this effect through the relativistic addition of velocities paulibook . At the same time when the theory of relativity was being developed, Lorentz lorentz95book predicted the influence of dispersion in a moving medium on the speed of light. This effect was first verified by Zeeman who used glass rods for high dispersion placed on a moving platform zeeman14raa .
The experimental approach to the study of light dragging by a moving medium has recently received a new opportunity, since it was found that coherent media can have a huge dispersion that can result in ultraslow group velocities of light (for review see matsko01aamop ; boyd02po ). The value of this dispersion is many orders of magnitude greater than the dispersion of glass used by Zeeman, for example. Ultraslow group velocities have been observed in atomic vapors hau99nature ; kash99prl ; budker99prl as well as in doped solids turukhin02prl ; bigelow03prl . These results have revealed new and exciting opportunities for the study of fundamental phenomena involving light dragging, for instance, by suggesting dielectric analogies of astronomical effects leonhardt00prl .
The frequency dispersion responsible for the ultraslow light propagation occurs in the vicinity of a narrow transparency window resulting from Electromagnetically Induced Transparency (EIT) arimondo96 ; harris97pt ; marangos98jmo . The specific structure of the EIT medium has raised questions about the minimum group velocity of light that can be realized. The ponderomotive effects artony01jetpl as well as light reflection from the medium boundary and absorption in the dielectric have been identified as possible sources of influence on the achievable minimum group velocity kozlov02pla .
It was also shown that it is possible to slow down a light pulse or even bring it to a full stop using the effect of light dragging kocharovskaya01prl . The light pulse can be at rest with respect to an observer if the medium moves uniformly with a velocity equal and opposite to the group velocity of light propagating in the stationary medium. Moreover, light dragging was predicted kocharovskaya01prl in an atomic cell containing hot atomic vapor. In this case the effect was predicted to be achieved by selecting a proper velocity subgroup in the inhomogeneously (Doppler) broadened medium. The selection can be realized by tuning the frequency of a drive laser and is nothing more than spectral hole-burning, a phenomenon well known in nonlinear spectroscopy letokhovbook .
The experimental realization of “light freezing” and the observation of light dragging in a Doppler-broadened medium nevertheless encountered difficulties mikhailov03jmo . This is because the use of either optically thick collimated atomic beams, or vacuum atomic cells is required. The small group velocities of light, on the other hand, was realized in hot atomic cells containing a buffer gas, or in coated atomic cells. The presence of a buffer gas or coating results in velocity mixing of the atoms via velocity changing collisions. It becomes impossible to select a proper velocity subgroup as discussed in kocharovskaya01prl .
We report on an experiment for the observation of light dragging in a hot vacuum atomic rubidium cell without any butter gas or coherence preserving coating. We realized the experiment by a proper tuning of the experimental parameters which allowed us to reach km/s average group velocity in a cm long cell. We found that the group velocity decreases with red tuning of the drive laser radiation (which corresponds to selecting of an effective “atomic beam” moving in the opposite direction with respect to the light), and increases with blue tuning. As a result, the maximum of average group delay for light propagating in the cell shifts as much as MHz to the red. The following theoretical analysis expands on our results.
An understanding of light dragging can be gained from Lorentz transformation of the wave vector and frequency of electromagnetic waves. Using this transformation and the definition of group velocity, we come to the conclusion LLbook that if light propagates in the direction of the medium flow, its group velocity in laboratory frame, , changes as
| (1) |
where is the group velocity in the frame of reference moving with the medium, is the velocity of the medium relative to the laboratory frame of reference, is the speed of light in the vacuum, is the index of refraction of the medium, is the frequency of the electromagnetic wave.
Eq.(1) is general; it does not depend on the specific properties of a medium. Hence, it is valid for a hot atomic vapor where small group velocities could be realized. The goal of the present paper is to detect light dragging based on Doppler effect in an atomic cell.
The velocity of an atomic subgroup (that can be selected by standard techniques of nonlinear spectroscopy letokhovbook ) should be compared to the average thermal speed of atoms in the cell, where is Boltzmann constant, is the temperature, and is the atomic mass. For 87Rb, this speed is equal to approximately ms for . The minimum group velocity observed in our experiment is much larger than this value. To detect the light dragging effect we measure the shift of the minimum group delay with respect to the laser tuning that determines the atomic velocity subgroup.
Let us estimate this shift. We consider a three level configuration shown in Fig.1. Such a scheme is very convenient for understanding of EIT based on coherence population trapping arimondo96 , though it is not applicable for quantitative description of the effect in real atoms greentree03 . Drive and probe lights interact with transitions and , respectively. The dipole-forbidden transition has a long life time determined primary by the interaction time of atoms and light.

The dependence of the group velocity on the drive frequency in the motionless medium may be estimated from
| (2) |
where (Fig.(1)), MHz is the half width at half maximum of the Doppler profile, is a function of temperature that is used to take into account propagation and optical pumping effects. For optically thin medium consisting of atoms kocharovskaya01prl . This function can be determined by comparing measured distribution widths to .
The drive laser detuned from one-photon resonance by makes the probe interact with the atomic “beam”. This “beam” has an average speed while moving in the direction of the probe wave. According to (1) the group velocity with respect to the laboratory frame of reference is approximately equal to
| (3) |
The group velocity reaches a minimum at detuning
| (4) |
This minimum corresponds to the maximum of group delay . The frequency shift of the maximum group delay could be detected and measured.
The basic elements of our experimental setup include a rubidium atomic vapor cell with an enriched amount of 87Rb isotope; a frequency stabilized diode laser producing the drive and probe beams; and a reference laser stabilized with a reference rubidium cell allowing us to measure the exact frequency of the radiation passing through the atomic cell by observing a beat signal. The amplitude of the probe laser is modulated at kHz with an acousto-optical modulator. We measure the delay of the beat-note of the probe radiation to detect the light dragging phenomenon. Let us now describe the setup in more detail (see Fig.2).
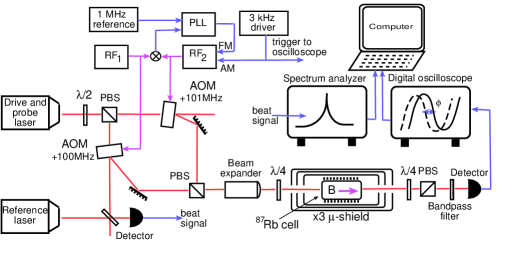
The two-inch-long atomic cell contains 75% of 87Rb and 25% 85Rb. The cell can be kept at a constant temperature ranging from C to C, stabilized to C with a feedback loop. The cell is placed inside a solenoid, which is used to create a bias magnetic field along the propagation direction of the optical beam. This field introduces a MHz Zeeman detuning for the ground state sublevels with . The solenoid and the cell are enclosed in a three-layer -metal shield to cancel stray magnetic fields.
We use a Vortex laser system tuned to the , F=2 , F=1 transition of 87Rb. The laser radiation is split into two parts: drive and probe, whose powers can be varied, and their beam radius is set at mm by the beam expander.
The short term stability of our laser is better than MHz/Hz1/2. However, the long term stability is rather unsatisfactory, so for the accurate frequency measurements we had to use a reference laser locked at the crossover resonance at 85Rb D1 line in an additional cell (not shown in Fig.2). Measuring the beat frequency of these two lasers with a spectrum analyzer allowed us to track the detuning of the first laser from the transition with better than MHz resolution during up to five hours, when the first laser was stepped through GHz range several times.
To split the laser beam into the drive and probe we use a polarizing beam splitter (PBS) preceded by a half-wave plate; then, each beam passes through an acousto-optical modulator (AOM) up-converting one frequency by MHz, and the other by MHz. The MHz frequency difference between the two beams is enforced by phase-locking the AOM drivers’ beat signal to a MHz reference signal in the master-slave phase lock loop (PLL) configuration, and corresponds to in Fig. (1). The AOM in the probe (the slave) channel also performs the function of modulation of the probe amplitude at kHz. The phase of this modulation is later used to determine the group delay of the probe light.
As a result, we obtain the CW drive and amplitude modulated probe beams with orthogonal linear polarizations, and with the frequency detuning exactly matching the ground state splitting for imposed by the solenoid field. To couple these ground states, the linearly polarized drive and probe fields are transformed to opposite circular polarizations by a quarter wave plate. This step occurs after they have been combined by the second PBS and passed through the beam expander to maintain a good quality Gaussian beam of the prescribed radius.
Light that passes through the cell is converted back to linear basis with the second quarter wave plate, and then the drive light is rejected by a polarizer. The extinction ratio is approximately 0.5%. Probe radiation is detected by a photodiode whose output is coupled into a digital oscilloscope, to monitor the signal. We use the phase measurement function of the oscilloscope to determine the group delay of the kHz beat-note, and the amplitude measurement function to measure its transmission. Note that this type of measurement completely rejects the drive leaking into the probe polarization (e.g. due to polarization rotation) and provides us with very clean probe absorption data.
Let us turn now to the measurement results. The minimum full width at half maximum of the EIT resonance that we detected is KHz, which is slightly narrower than the inverse average transit time of atoms through the laser beam , for the beam diameter used in our setup. The additional narrowing of the resonance could orginate from the density narrowing effect of the EIT resonance lukin97prl .
The maximum group delay of the KHz beat note was approximately s. This group delay was detected for a C cell temperature, mW drive and mW probe field powers. Drive and probe fields had approximately 30% and 10% relative transmission respectively.
We first detected the group delay for the beat-note of the probe at a couple of dozens of cell temperatures. The data were taken with a fixed two-photon detuning, drive and probe powers, and varying one-photon detuning. Four typical data curves are shown in Fig.3 (maximum delay increases with temperature). It is easy to see that the curve shapes are non-Lorentzian for any temperature. Moreover, the width of the dependencies increases almost twice as fast with the temperature increase from 45oC to 72oC. Such a shape is determined by the multilevel structure of the system as well by the fact that we study an open transition.

It is easy to see that the center of curves in Fig.3 are shifted each with respect to the other. At low temperatures the center coincides with the resonant frequency of atomic transition, while for large temperatures it shifts to the red. We found the maximum delay and shift of the point of maximum delay for each curve. To ensure consistency of the results we repeated the experiment with a different drive power (2.8 mW). The combined measurement results are shown in Fig.4 by dots and crosses for different drive powers. We also performed measurements of the group delay versus power of the drive radiation at a fixed temperature and placed the data on the same plot as empty circles. The dependencies perfectly agree with each other, confirming the theoretical prediction of Eq.(4), i.e. the frequency shift of the maximum group delay only depends on the maximum delay itself and not on how it is achieved.
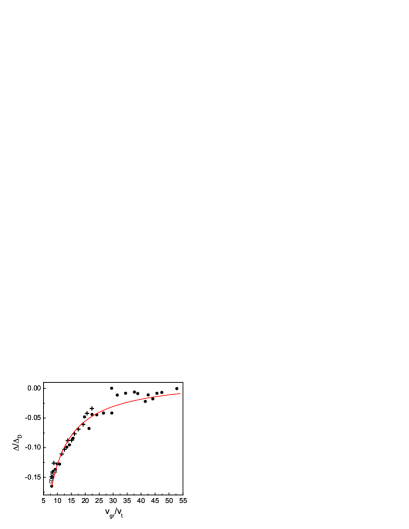
To compare the theoretical predictions and experimental data we plot the function given by Eq.(4) as a solid line in Fig.4. In this function, the width parameter is determined from the widths of experimental curves such as shown in Fig.3 and varies from unity for the low temperature curves to approximately one half for the high temperature curves.
In conclusion, we have demonstrated the effect of light dragging occurring in a hot atomic vapor due to thermal motion of atoms. Our experiment confirms the influence of spatial dispersion of the refractive index of a medium on light propagation. Moreover, we have measured the group velocity dragging for a beat-note of monochromatic waves, which is equivalent to a measurement of differential phase velocity dragging, and is an indirect verification of Lorentz theory for phase velocity of light in moving media. Our results also show that coherent atomic media really possess large light dragging abilities so the ideas to “freeze light” with such a motion are reasonable.
The research described in this paper was carried out under sponsorship of DARPA by the Jet Propulsion Laboratory, California Institute of Technology, under a contract with the National Aeronautics and Space Administration.
References
- (1) W. Pauli, ”Theory of relativity”, (Pergamon, New York, 1958).
- (2) L. D. Landau and E. M. Lifshitz, ”Electrodynamics of continuous media”, (Pergamon, New York, 1984).
- (3) A. J. Fresnel, Ann. Chim. Phys. 9, 57 (1818).
- (4) H. Fizeau, C. R. Acad. Sci. (Paris) 33, 349 (1851); Ann. de Chimie et de Phys. 57, 385 (1859).
- (5) H. A. Lorentz, ”Versuch einer Theorie der elektrischen und optischen Erscheinungen in bewegten Korpern”,(Leiden, 1895); Proc R. Acad. (Amsterdam) 6, 809 (1904).
- (6) P. Zeeman, Proc R. Acad. (Amsterdam) 17, 445 (1914); 18, 398 (1915).
- (7) A. B. Matsko, O. Kocharovskaya, Y. Rostovtsev, G. R. Welch, A. S. Zibrov, and M. O. Scully, Adv. At. Mol. Opt. Phys. 46, 191 (2001).
- (8) R. W. Boyd and D. J. Gauther, Prog. Optics 43, 497 (2002).
- (9) L. V. Hau, S. E. Harris, Z. Dutton, and C. H. Behroozi, Nature 397, 594 (1999).
- (10) M. M. Kash, V. A. Sautenkov, A. S. Zibrov, L. Hollberg, G. R. Welch, M. D. Lukin, Y. Rostovtsev, E. S. Fry, and M. O. Scully, Phys. Rev. Lett. 82, 5229 (1999).
- (11) D. Budker, D. Kimball, S. Rochester, and V. Yashchuk, Phys. Rev. Lett. 83, 1767 (1999).
- (12) A. V. Turukhin, V. S. Sudarshanam, M. S. Shahriar, J. A. Musser, B. S. Ham, and P. R. Hemmer, Phys. Rev. Lett. 88, 023602 (2002).
- (13) M. S. Bigelow, N. N. Lepeshkin, and R. W. Boyd, Phys. Rev. Lett. 90, 113903 (2003).
- (14) U. Leonhardt and P. Piwnicki, Phys. Rev. Lett. 84, 822 (2000).
- (15) E. Arimondo, Progress in Optics 35, 257 (1996).
- (16) S. E. Harris, Phys. Today 50, 36 (1997).
- (17) J. P. Marangos, J. Mod. Opt. 45, 471 (1998).
- (18) I. Carusotto, M. Artoni, and G. C. La Rocca, JETP Lett. 72, 289 (2000).
- (19) V. V. Kozlov, S. Wallentowitz, and S. Raghavan, Phys. Lett. A 296, 210 (2002).
- (20) O. Kocharovskaya, Y. Rostovtsev, and M. O. Scully, Phys. Rev. Lett. 86, 628 (2001).
- (21) V. S. Letokhov and V. P. Chebotaev, ”Nonlinear laser spectroscopy”, (Springer-Verlag, New York, 1977).
- (22) E. E. Mikhailov, Y. V. Rostovtsev, and G. R. Welch, J. Mod. Opt. 50, 2645 (2003).
- (23) A. D. Greentree, D. Richards, J. A. Vaccaro, A. V. Durrant, S. R. de Echaniz, D. M. Segal, and J. P. Marangos, Phys. Rev. A 67 , 023818 (2003).
- (24) M. D. Lukin, M. Fleischhauer, A. S. Zibrov, H. G. Robinson, V. L. Velichansky, L. Hollberg, and M. O. Scully, Phys. Rev. Lett. 79, 2959 (1997).