Blind Analysis in Particle Physics
Abstract
A review of the blind analysis technique, as used in particle physics measurements, is presented. The history of blind analyses in physics is briefly discussed. Next the dangers of experimenter’s bias and the advantages of a blind analysis are described. Three distinct kinds of blind analysis in particle physics are presented in detail. Finally, the BABAR collaboration’s experience with the blind analysis technique is discussed.
I Introduction
A blind analysis is a measurement which is performed without looking at the answer. Blind analyses are the optimal way to reduce or eliminate experimenter’s bias, the unintended biasing of a result in a particular direction.
In bio-medical research the double-blind randomized clinical trial is the standard way to avoid bias. In such experiments both patients and clinicians are blind to the individual assignments of treatments to patients, and that assignment is made randomly. A double-blind randomized trial was first used in 1948 by Hill in a study of antibiotic treatments for tuberculosisDoll . Amazingly, the concept of a double-blind trial dates back to at least 1662, when John Baptista van Helmont made the following challengeDoll :
Let us take out of the hospitals,… 200, or 500 poor People, that have Fevers, Pleurisies, etc. Let us divide them into half, let us cast lots, that one half of them may fall to my share, and the other to yours; I will cure them without blood-letting and sensible evacuation… We shall see how many funerals both of us shall have. But let the reward of the contention or wager, be 300 florens, deposited on both sides…
A notable early use of a blind analysis in physics was in a measurement of the of the electron, by Dunnington Dunnington . In this measurement, the was proportional to the angle between the electron source and the detector. Dunnington asked his machinist to arbitrarily choose an angle around . Only when the analysis was complete, and Dunnington was ready to publish a result, did he accurately measure the hidden angle.
II Experimenter’s Bias
Experimenter’s bias is defined as the unintended influence on a measurement towards prior results or theoretical expectations. Next, we consider some of the ways in which an unintended bias could be present in a measurement.
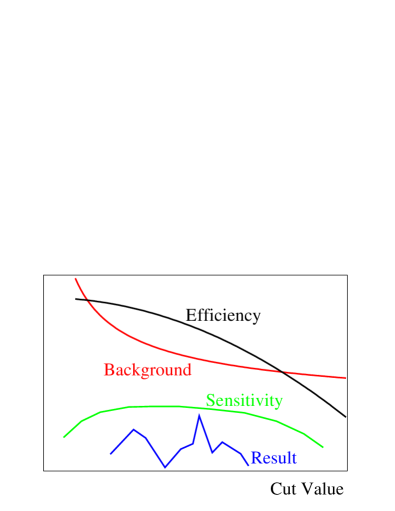
One scenario involves the choice of experimental selection requirements, or cuts. Often, a measurement may be equally well done, in terms of sensitivity or uncertainties, with a range of values for a particular selection cut, and the exact cut value used may be chosen arbitrarily. This is illustrated in the cartoon in Fig 1, where there is a plateau in the sensitivity, and the cut value could be chosen anywhere in that plateau. However, the value of the result may vary, typically within the statistical uncertainty, depending on the exact value of cut chosen. If the cuts are set with knowledge of how that choice affects the results, experimenter’s bias could occur. In this case, the size of the bias could be on the order of the statistical uncertainty.
Another, less subtle, scenario involves measurements of small signals, such as the search for rare processes or decays. Here experimenter’s bias could occur if the event selection is determined with prior knowledge of the effect of that selection on the data. One danger is that the selection cuts can be tuned to remove a few extra background-like events, yielding a result biased to lower limits. Another danger is that the cuts can be tuned to improve the statistical significance of a small signal.
In general, experimenter’s bias may occur if obtaining the correct result is the standard used to evaluate the quality of the measurement. The validity of a measurement may be checked in a number of ways, such as internal consistency, stability under variations of cuts, data samples or procedures, and comparisons between data and simulation. The numerical result, and how well it agrees with prior measurements or the Standard Model, contains no real information about the internal correctness of the measurement. If such agreement is used to justify the completion of the measurement, then possible remaining problems could go unnoticed, and an experimenter’s bias occur.
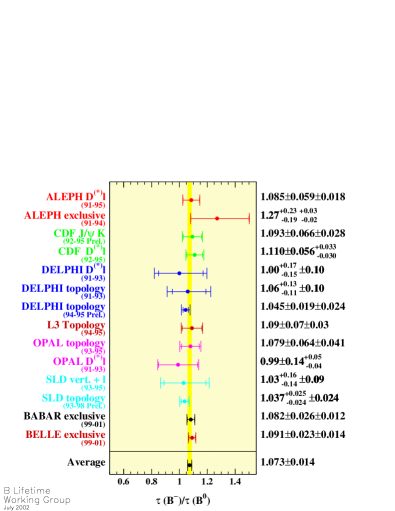
Does experimenter’s bias occur in particle physics measurements? Consider the results on the ratio meson lifetimes shown in Figure 2. The average has a for 13 degrees of freedom; a this small or smaller occurs only 1.5% of the time. At this level, the good agreement between measurements is suspicious, but for each individual result no negative conclusion should be made. Nonetheless, it can be argued that even the possibility of a bias represents a problem. The PDGpdg has compiled a number of measurements that have curious time-histories. Likewise, while it is difficult to draw negative conclusions about a single measurement, the overall impression is that experimenter’s bias does occur. Finally, there are numerous examples in particle physics of small signals, on the edge of statistical significance, that turned out to be artifacts. Here too, experimenter’s bias may have been present.
In all of these cases, the possibility of experimenter’s bias is akin to a systematic error. Unlike more typical systematic effects, an experimenter’s bias cannot be numerically estimated. Therefore, a technique to reduce or eliminate this bias is needed.
III Blind Analysis
A Blind Analysis is a measurement performed without looking at the answer, and is the optimal way to avoid experimenter’s bias. A number of different blind analysis techniques have been used in particle physics in recent years. Here, several of these techniques are reviewed. In each case, the type of blind analysis is well matched to the measurement.
III.1 Hidden Signal Box
The hidden signal box technique explicitly hides the signal region until the analysis is completed. This method is well suited to searches for rare processes, when the signal region is known in advance. Any events in the signal region, often in two variables, are kept hidden until the analysis method, selection cuts, and background estimates are fixed. Only when the analysis is essentially complete is the box opened, and an upper limit or observation made.
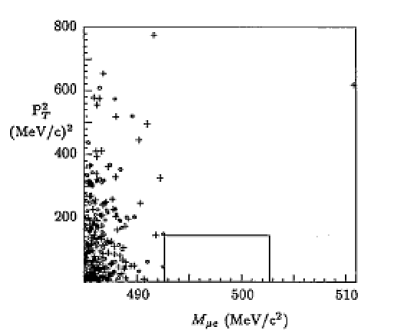
The hidden signal box technique was used111This is the first use known to the author. in a search for the rare decay . This decay was not expected to occur in the Standard Model, and the single event sensitivity of the experiment was one event in decays. Any signal was expected inside the box in and shown in Figure 3; the possible contents of this box were kept hidden until the analysis was completedMolzon .
The use of this method is now a standard method for rare decay searches, when the signal region is known in advance. One additional subtlety lies in the size of the hidden box. Generally, the box is initially chosen to be somewhat larger than the signal region, so that the final signal cuts may be chosen without bias as well. Otherwise, this technique is straightforward to apply.
III.2 Hidden Answer
For precision measurements of parameters, a different technique for avoiding bias must be used. In this case, hiding the answer is often the appropriate method. The KTeV experiment used this technique in its measurement of . The value of was found in a fit to the data, and a small value of order was expected. In this case, KTeV inserted an unknown offset into its fitting program, so that the result of the fit was the hidden value:
| (1) |
where C was a hidden random constant, and the choice of or was also hidden and random. The value of the hidden constant, , was made by a pseudo-random number generator with a reasonable distribution and mean. KTeV could determine its data samples, analysis cuts, Monte-Carlo corrections, and fitting technique while the result remained hidden, by looking only at . The use of the or factor prevented KTeV from knowing which direction the result moved as changes were made. In practice, the resultKTeV99 was unblinded only one week before the value was announced.
The hidden answer technique is well-suited to precise measurements of a single quantity. The complete analysis, as well as the error analysis, may proceed while blind to the result. An additional consideration is whether there are any distributions which will give away the blinded result. Often the exact value of the measurement is not readily apparent from the relevant plots; in this case those plots can be used without issue.
III.3 Hidden Answer and Asymmetry
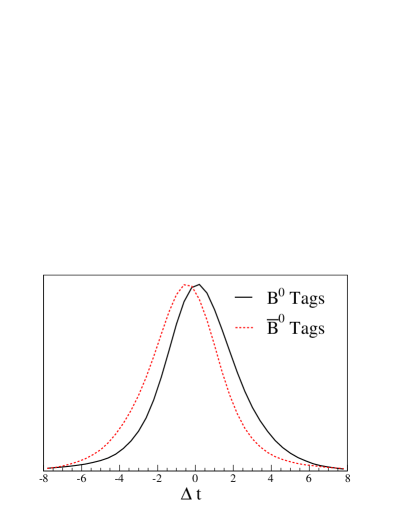
For certain measurements hiding the answer is not sufficient; it may also be necessary to hide the visual aspect of the measurement. One example is an asymmetry measurement, such as the recent -violation measurement by BABAR. In this case, the rough size and sign of the asymmetry can be seen by looking at the distributions for and decays into eigenstates, as shown in Figure 4a. Before violation had been established, and to avoid any chance of bias, a blind analysis was developed to hide both the answer and the visual asymmetry.
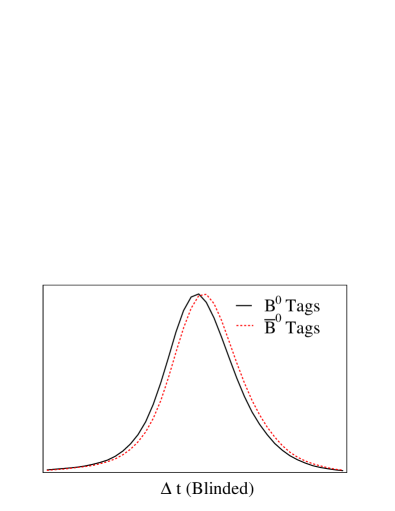
In BABAR’s -violation measurement the result, found from a fit to the data, was hidden as in Equation 1. In addition, the asymmetry itself was hidden by altering the distribution used to display the data.BlindCP To hide the asymmetry the variable:
| (2) |
was used to display the data. The variable is equal to or for or flavor tags. Since the asymmetry is nearly equal and opposite for the different flavors, we hid the asymmetry by flipping one of the distributions. In addition, the -violation can be visualized by the asymmetry of the individual and distributions. In turn, this was hidden by adding the hidden offset which has the effect of hiding the point. The result is shown in Figure 4b, where the amount of -violation is no longer visible (the remaining difference is due to charm lifetime effects). Also it is worth noting that for a given data sample, due to statistical fluctuations, the maximum of the distribution will not exactly correspond to the point, as in the smooth curves shown.
This blind analysis technique allowed BABAR to use the distribution to validate the analysis and explore possible problems, while remaining blind to the presence of any asymmetry. There was one additional restriction, that the result of the fit could not be superimposed on the data, since the smooth fit curve would effectively show the asymmetry. Instead to assess the agreement of the fit curve and the data, a distribution of just the residuals was used. In practice, this added only a small complication to the measurement. However, after the second iteration of the measurement, it became clear that the asymmetry would also remain blind if the only distribution used was of the sum of and events, and that no additional checks were needed using the individual distributions.
III.4 Other Blind Methods
The kinds of measurements already discussed, such as rare searches and precision measurements of physical parameters, are well suited to the blind analysis technique. Other kinds of analyses are difficult to adapt to the methods described. For instance, branching fraction measurements typically require the careful study of the signal sample in both data and simulation, so it is not possible to avoid knowing the number of signal events or the efficiency. In this case, other techniques may be considered. One method is to fix the analysis on a sub-sample of the data, and then used the identical method on the full data sample. One may argue about the correct amount of data to use in the first stage, too little and backgrounds or other complications may not be visible, too much and the technique loses its motivating purpose. Another method is to mix an unknown amount of simulated data into the data sample, removing it only when the analysis is complete.
Another difficult example is the search for new particles, or bump-hunting. In this case, since the signal region is not known a-priori, there is no one place to put a hidden signal box. However, such measurements may be the most vulnerable to the effects of experimenter’s bias. Certainly, there is some history of statistically significant bumps that are later found to be artifacts. The possibility of using a blind analysis technique may depend on the understanding of the relevant background. If the background can be estimated independently of the bump-hunting region, than the analysis and selection cuts may be set independently of the search for bumps. Here again is a case in which the exact method used must be well matched to the measurement in question.
IV Conclusion
The experience of the BABAR collaboration in using blind analyses is instructive. While the collaboration had initial reservations about the blind analysis technique, it has now become a standard method for BABAR BabarBlind . Often the blind analysis is a part of the internal review of BABAR results. Results are presented and reviewed, before they are unblinded, and changes are made while the analysis is still blind. Then when either a wider analysis group or an internal review committee is satisfied with the measurement the result is unblinded, ultimately to be published. With several years of data taking, and many results, BABAR has successfully used blind analyses.
Acknowledgements.
Work supported by the U.S. Department of Energy under contract number DE-AC03-76SF00515.References
- (1) R. Doll, Controlled trials: the 1948 watershed, British Medical Journal 318, 1217, (1998).
- (2) F.G. Dunnington, Phys. Rev. 43, 404, (1933). See also L. Alvarez, Adventures of a Physicist, (1987).
- (3) Review of Particle Properties, Phys. Rev. D66, 010001-14.
- (4) K. Ariska et al. [E791 Collaboration], Phys. Rev. Lett. 70, 1049, (1993).
- (5) A. Alavi-Harati et al. [KTeV Collaboration], Phys. Rev. Lett. 83, 22 (1999).
- (6) B. Aubert et al. [BABAR Collaboration], Phys. Rev. Lett. 86, 2515 (2001).
- (7) A. Roodman, Blind Analysis of , Babar Analysis Document # 41, (2000).
- (8) Blind Analysis Task Force [Babar Collaboration], Babar Analysis Document # 91, (2000).