Metastable level lifetimes from electron-shelving measurements
with ion clouds and single ions
Abstract
The lifetime of the -level in singly-ionized calcium has been measured by the electron-shelving technique on different samples of rf trapped ions. The metastable state has been directly populated by exciting the dipole-forbidden transition. In ion clouds, the natural lifetime of this metastable level has been measured to be (109527) ms. For the single-ion case, we determined a lifetime of (115220) ms. The -error bars at the 2%-level have different origins for the two kinds of experiments: data fitting methods for lifetime measurements in an ion cloud and control of experimental parameters for a single ion. De-shelving effects are extensively discussed. The influence of differing approaches for the processing of the single-ion quantum jump data on the lifetime values is shown. Comparison with recent measurements shows excellent agreement when evaluated from a given method.
pacs:
32.70.Cs - Oscillator strengths, lifetimes, transition moments; 32.80.Pj - Optical cooling of atoms, trappingI Introduction
High-precision atomic lifetime measurements are a challenge for experimental and theoretical atomic physics. Increasing volume and precision of astrophysical observations have generated a growing need for precise atomic lifetime data Traebert (2000). Among all the interesting atomic systems, atoms with a closed inner shell and a single additional valence electron offer the possibility to accurately compare the results of atomic data modeling and experimental values.
There have been various theoretical approaches to the low-lying metastable doublet levels of 40Ca+ which have generated somewhat dispersed metastable lifetime predictions Osterbrock (1951); Warner (1968); Ali and Kim (1988); Zeippen (1990); Guet and Johnson (1991); Vaeck et al. (1992); Brage et al. (1993); Liaw (1995); Biemont and Zeippen (1996). In the past decade the lifetimes of the metastable D-levels of the singly-ionized calcium have also been measured several times Urabe et al. (1992); Arbes et al. (1993); Urabe et al. (1993); Arbes et al. (1994); Knoop et al. (1995); Gudjons et al. (1996); Ritter and Eichmann (1997); Block et al. (1999); Lidberg et al. (1999); Barton et al. (2000); Staanum et al. (2003). Most of these measurements have been carried out in rf traps, showing a clear evolution towards longer lifetimes throughout the years, as error sources have been identified. In particular, before 1999, the coupling of the metastable D-levels to the P-state due to off-resonant excitation by the repumper laser Block et al. (1999), had not been taken into account at all. As will be shown in this paper, ion-ion collisions in a relative hot and dense ion cloud (, ) may also contribute a few percent to the lifetime reduction. These two effects explain the gap between the earlier ion-cloud measurements and recent single-ion measurements. The experiments which have been carried out on single laser-cooled ions show a typical error bar of the order of 2%, with the exception of one experiment Barton et al. (2000), where the announced uncertainty is inferior to 0.6% and which gives the highest value ever measured for the -lifetime. In this article, we present our new measurements of the lifetime of the -state which have been carried out in a different way. In fact, we achieve population of the metastable level by direct pumping of the electric quadrupole transition which connects the ground state to the -state. We have also been able to establish a connection between the different published values, the discrepancy being mainly due to differing data analysis.
Single trapped ions are now extensively used for metrology and quantum information Gill (2002). Storage times can exceed days, and the control of the trapping environment along with the degree of laser stabilization have been improved to access linewidths of optical transitions down to the Hz-level Rafac et al. (2000). Our experimental project aims to propose a frequency standard in the optical domain, based on the interrogation of the electric quadrupole transition of a single laser-cooled Ca+-ion. The measurement of the metastable -level lifetime is an important step in this direction, allowing to identify and to control effects which may reduce this lifetime, and which could thus contribute to the broadening of the clock transition.
In this paper, we briefly present our experimental device, and introduce the technique we have used to measure metastable lifetimes in ion clouds and single ions. We then present the different data processing methods. The fourth part of this article is devoted to the discussion of the uncertainties of our measurements. We finally present and discuss our results in the context of previous experiments.
II Experimental Setup
We use a miniature ion trap to confine single ions and ion clouds up to approximately 500 particles. The trap is a modified Paul trap, a so-called Paul-Straubel trap Schrama et al. (1993) consisting of a cylindrical molybdenum ring with an inner diameter of mm and a total ring height of mm (Figure 1). Two circular mesh electrodes at 5.5 mm on each side from the trap center, allow the definition of well controlled electrical boundary conditions. Two copper tip electrodes in the plane of the trapping ring are used as positioning electrodes to correct for imperfections and asymmetries in the trapping potential and thus to reduce the micromotion of the confined ions. The applied trapping frequency MHz with an rf voltage amplitude of 300 V, gives rise to a total pseudo-potential well depth of eV and motional frequencies around MHz. The trap has been fully characterized and is described in detail in Champenois et al. (2001). The trapping setup is mounted into an ultra-high vacuum vessel and baked out at C during a couple of days. Vacuum conditions can be controlled by the ion pump current, a Bayard-Alpert gauge and a mass spectrometer operating up to 64 a.m.u.. Ions in the trap are created from a calcium oven heated by a direct current of 3 A. The effusive atom beam is crossed with a low-energy electron beam in the center of the trap producing singly-ionized calcium ions.
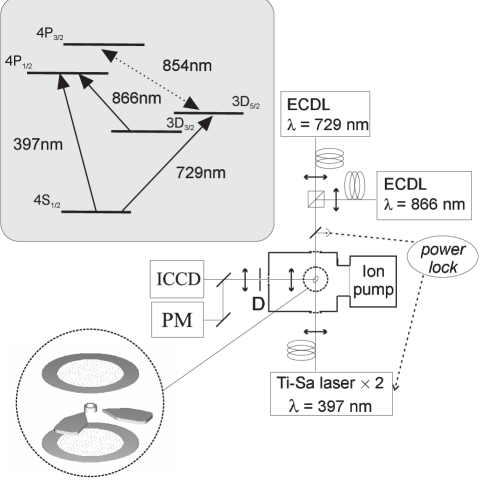
Laser-cooling is carried out on the electric dipole transition at 397 nm using an intracavity frequency-doubled TiSa-laser [Coherent 899]. The output intensity of this laser is stabilized by a single-pass acousto-optical modulator (AOM), the error signal is fed back from a beam pick-up photodiode after crossing the trap. The optical power used for laser-cooling is about 50 W in the case of an ion cloud, and an order of magnitude lower for a single ion, focussed in a 20m-diameter waist (measured at 1/e2 power level). The linewidth of this laser has been found to be below 10 MHz in the course of our experiments. Due to a branching ratio to the -level larger than 5%, repumping from this level is required, and is assured by a single-mode diode laser at 866 nm mounted in a Littrow-configuration external cavity (ECDL). This diode laser is stabilized to a low finesse (=200) reference cavity reducing its linewidth to about 1 MHz and improving its frequency stability. Stable operation during a whole day is achieved by locking the length of the reference cavity to a hyperfine transition of neutral caesium making use of an additional ECDL at 852 nm and a standard saturated-absorption setup. Typical power for the 866 nm-diode is about 200 W focussed into a 70 m-diameter waist. A broad-area laser diode is used to probe the electric quadrupole transition at 729 nm . The nominal output power of this laser diode is 100 mW and its free-running linewidth is as large as 2 nm. This diode has been set up in an external cavity in Littrow configuration and pre-stabilized by electronic feedback onto a low-finesse reference cavity (=200) . We thus obtain a laser linewidth in the MHz-range and a laser intensity of approximately 350 W per 60 m-diameter waist size in the trap Houssin et al. (2003).
Two mechanical shutters in the 729 nm-beam line allow to cut the light from this laser completely. Their closing time is in the ms-range, inferior to the smallest measurement interval used throughout the experiment. All the laser beams used in this experiment are brought to the ion trap by single-mode optical fibers. This ensures the spatial filtering of the laser beams and gives rise to well controlled waist sizes at the position of the ion. However, the main advantage of these fibers is to increase the pointing stability of the laser beams, which improves the day-to-day reproducibility of the measurements essential for trapping single ions.
Detection of the fluorescence of the ions at 397 nm is made outside the vacuum vessel (Figure 1). The fluorescence signal is spatially filtered by a small diaphragm (diameter below 500 m) and then projected onto an intensified CCD camera (ICCD) and a photomultiplier (PM) in photon counting mode. A variable beamsplitter between these two devices allows to choose the fraction of signal sent to the photomultiplier between 10 and 100 %. The maximum fluorescence count is about 10000 counts/sec for a single ion. Data is collected and stored by a personal computer, that also controls the ion creation process and actuates the laser shutters. Excellent temporal synchronization is assured by buffer-controlled read-out on the data acquisition board. The typical duration of a measurement bin is 50 ms for the ion cloud measurements and 30 ms for the single-ion measurements.
III electron shelving
All our lifetime measurements have been performed in the same trap, in a very similar way for a small ion cloud or a single ion. In both cases, ions have been laser-cooled on the strong electric dipole transition and detected by the scattered 397 nm-photons. We have used the technique of electron-shelving proposed by H.G. Dehmelt Dehmelt (1975) for the whole set of measurements. This method allows to observe transitions on the forbidden electric quadrupole line via the switching of the strong laser-cooling transition at 397 nm. In our experiment the -state has been populated by direct optical pumping of the dipole-forbidden transition, technique which has not yet been applied in the lifetime measurements with single trapped Ca+-ions. The direct excitation of this electric quadrupole transition allows an unambiguous definition of initial conditions.
III.1 measurements in an ion cloud
A typical ion cloud contains 50 to 100 Ca+-ions which are laser-cooled to a temperature of about 50 K, temperature which is defined as a measure of the kinetic energy of the trapped particles. This temperature value stands for an equilibrium between the heating of the ions by the trapping field and the laser-cooling.
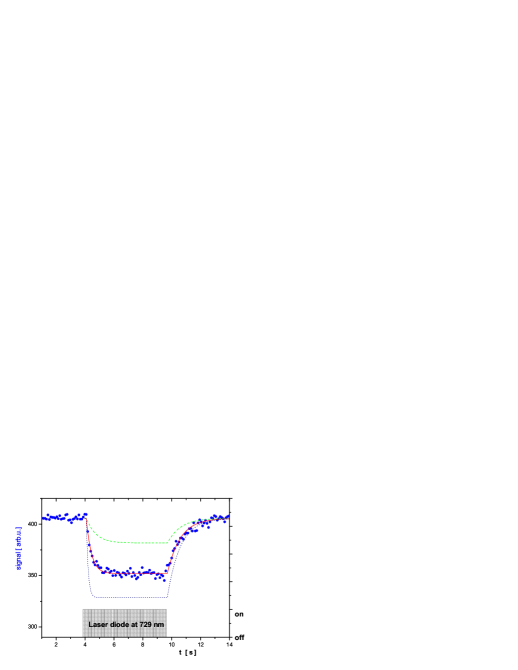
To measure the -level lifetime in an ion cloud we use approximately 350 W of 729 nm-power. Once the resonant laser beam is admitted onto the ions, a fraction of the ions is pumped into the -state and the observed fluorescence signal at 397 nm decreases. The experimental signal is shown in figure 2. When the population of the -state has reached an equilibrium state which is represented by a constant fluorescence level, we shut off the 729 nm diode laser. The ion population then decays to the ground state with a time constant governed by the -state natural lifetime. This decay can be observed on the 397 nm fluorescence signal as the decaying ions return into the laser-cooling cycle and scatter blue photons. The revival function of the 397 nm fluorescence is fitted with a least-squares method (LSF) by the function where is the measured lifetime for a given set of experimental parameters, the net ion signal and the low-level signal being composed by the fluorescence signal of the ions remaining in the laser-cooling cycle and the background signal due to stray light. Actually, the measured lifetime is the natural lifetime of the -level affected by different de-shelving effects as will be discussed in section IV. The result for the measured lifetime in an ion cloud is ms with an 1-statistical uncertainty of 7.5 ms.
We have made simulations in an ion cloud of the population of all the atomic levels involved (, , , ) with the use of the density matrix formalism taking into account the ion motion in the trap. The oscillatory movement of the ion cloud is described by a distribution of the velocity amplitudes at a single frequency Schubert et al. (1989). In this coupled four-level system, the fraction of ions which are pumped into the metastable -state depends on the relative detuning of the three lasers used for cooling, repumping and probing of the clock transition, a phenomenon comparable to the occurrence of dark resonances. The simulation shows, that it is possible to pump almost the entire ion population into the metastable state if the ions are nearly at rest Champenois et al. (2004). The second parameter which is critical for the reproduction of the shelving curves is of course the laser power. The lines in figure 2 visualize the simulated fluorescence curves for a cloud of 50 ions with a temperature of 100 K, assuming that the fluorescence is directly proportional to the -population. In the plotted simulations the relative laser detuning has been fixed while the power levels of the probing laser at 729 nm are varied. The right choice of relative laser detunings and absolute laser power levels enables us to reproduce accurately both the speed of the decrease of the fluorescence as ions leave the laser cooling cycle (t=4-9 sec) and the fraction of the ions being pumped into the -level. As a matter of course, the revival of the fluorescence depends only on the lifetime of the 3-state for the given set of experimental parameters.
III.2 measurements with a single ion
Experiments with single ions have been carried out during twelve 6h-runs with single ions laser-cooled to temperatures below 1K. As the temperature of the ion is estimated from the asymmetric Doppler profile which is largely depending on the optical power used for laser-cooling, this value is an upper limit to the estimate of the kinetic energy.

When the electron-shelving technique is applied to a single ion, the observed fluorescence signal becomes binary. Actually, while the ion is in the laser-cooling cycle, a large number of blue photons is scattered giving rise to a high photon count rate (”bright” level), see figure 3. When the 729 nm laser diode is admitted onto the ion, it will be pumped into the -level. The fluorescence rate at 397 nm will then abruptly fall to the low level, which corresponds to the background light (”dark” level). As soon as we detect a ”dark” level signal, the 729-nm laser is shut off to avoid any coupling between the levels, as discussed in detail in section IV. The sudden changes in fluorescence due to transitions between atomic levels are called quantum jumps. Figure 3 shows the good distinction between the bright and the dark level. This allows to define an unambiguous threshold value for the determination of the duration of the quantum jumps. Typically, we have set the threshold value at the half of the net signal value, which is the difference between the mean upper trace and the mean lower trace. The timebase of the data acquisition has been chosen to give a maximum separation of bright and dark level together with best temporal resolution. Thus, variation of the threshold value separating dark and bright level between one third and two third of the net signal did not result in variations of the quantum jump length distribution.

The duration of the dark intervals have been processed by two different methods. First, they have been binned in a histogram and fitted by a least-squares method (LSF) using an exponential decay curve () with two free parameters (A and ) at a 95% confidence level (figure 4). Taking into account the de-shelving by the 866 nm-diode as discussed in section IV, the obtained lifetime value is = 1088 ms with a fitting uncertainty of 15 ms. This fitting procedure assumes that the measured number of events for each bin spreads around the fitted equation with a Gaussian probability distribution. Actually, the probability of very long events is in most cases very low (see figure 4), suggesting that deviations from the mean are not governed by a Gaussian distribution. It is then appropriate to apply the most general evaluation method, assuming a multinomial distribution, and calculating the lifetime by a maximum likelihood estimate (MLE). Recent measurements Barton et al. (2000); Staanum et al. (2003) have evaluated the metastable lifetime by using the method of the MLE obtaining values larger than 1150 ms. We have used the following formula Staanum et al. (2003) to calculate the lifetime by
| (1) |
where is the bin size of the histogram, is the mean value of the measured dark intervals of duration , and is the total number of measured events. The statistical uncertainty for each data set can be exactly computed by
| (2) |
Depending on the number of quantum jumps per run, the statistical uncertainty has been found to be below 3%. Extrapolation to zero 866nm-intensity gives a value for the natural lifetime of = 1152 ms, with a fitting uncertainty of 19 ms, which is discussed in section IV.2.
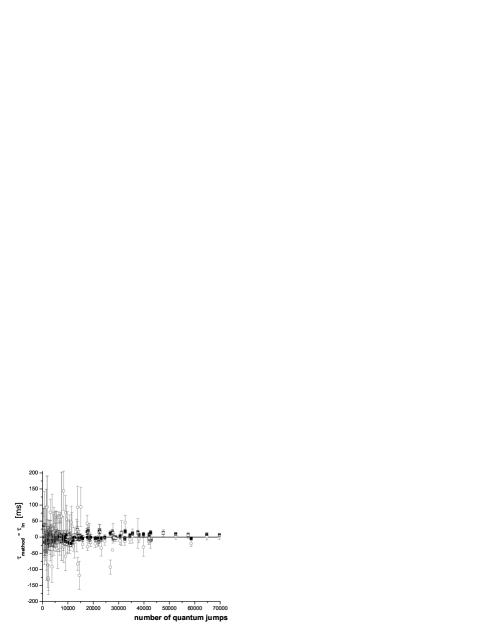
To determine the appropriate method for the evaluation of the quantum jump data, we have simulated quantum jump events using the Monte-Carlo method, governed by a fixed input lifetime and with the same time base as in our experiment. These quantum jump lengths have been allotted randomly in files of different size starting at about 500 quantum jumps up to about 100 000. Each file has been processed by a least-squares fit to an exponential decay curve of the histogram of durations and by the maximum-likelihood estimate for the whole data set. The two data processing methods have been carried out in a totally identical way to the treatment of the experimental data. The obtained values are plotted in figure 5 as a function of the number of quantum jump events contained in the processed file. As can be seen, LSF data are more widely scattered around the input lifetime of the simulation. At about 10000 events the scattering of the MLE data is roughly a factor of three smaller than for LSF, values for both methods converge on a 2%-level only for runs with more than 40000 valid quantum jumps. Actually, the MLE method is well known in mathematics as a precise unbiased estimator, it reaches asymptotically the Cramér-Rao bound which describes the best attainable error Kendall (1961). In general, as the average time needed to record one quantum jump is of the order of two or three seconds including the preparation time, a few-hour run of data acquisition yields several thousands quantum jumps. In this range the difference between both methods may easily reach 10% of the absolute values, the 5.5%-discrepancy of our experimental results largely fits into this window. In summary, the number of quantum jump events we acquire in the course of a one-day run, imposes the use of MLE to reach minimum statistical uncertainties.
IV Evaluation of uncertainties
Among the uncertainties on the measured lifetimes of the metastable -level of Ca+ we distinguish between the ones which are due to physical effects which may affect the apparent lifetime of the state and those due to data analysis.
IV.1 De-shelving effects
The lifetimes we measure in the course of our experiments are function of the experimental parameters as various physical effects tend to shorten the observed lifetimes. The major de-shelving effects are collisions with the residual gas, heating or loss of the ions, and coupling of the atomic levels by laser light. The measured lifetime can therefore be expressed as
| (3) |
with the residual particle density in the trapping device. We will discuss the influence of these de-shelving effects in detail in the following, their quantitative influence on the measured lifetimes is summarized in table 1.
| ion cloud measurement | quantum jump measurements | ||
| evaluation method | LSF | LSF | MLE |
| ms | ms | ms | |
| fitting uncertainty | 7.5 ms | 15 ms | 19 ms |
| data analysis | 17.5 ms | - | - |
| collisions | (2.1 1.9)ms and (16.8 12) ms | 3.5 ms | 3.5 ms |
| heating | 1.1 ms | - | - |
| ion loss | 8.4 ms | - | - |
| total error bar () | 27 ms | 16 ms | 20 ms |
We have looked for an eventual effect of the trapping potential and of the detuning of the 397 nm laser. Both parameters could influence the temperature of the trapped ions and eventually give rise to an increased amount of collisions. Nevertheless, we could not evidence any variation of the measured lifetime in the limit of the announced error bars.
IV.1.1 Collisional effects
The apparent lifetime of the metastable state can be reduced by inelastic collisions with (neutral) particles from the residual gas background. The base pressure of the ultra-high vacuum vessel is below mbar as measured by the ion pump current and the two gauges. From our previous measures of quenching and j-mixing reaction rates in hot ion clouds Knoop et al. (1995, 1998) and from the measured composition of the residual gas background by the mass spectrometer, we can deduce that the only non-negligible component giving rise to inelastic collisions is hydrogen. In fact, the partial hydrogen pressure for ion cloud experiments is inferior to mbar, and below the resolution of the mass spectrometer ( mbar) for single ion experiments. The difference in the pressure values for both types of experiments is due to the duration and frequency of the ion creation process.
For the ion cloud experiments the residual hydrogen pressure results in a value of s-1 due to quenching while the contribution of the fine-structure mixing collisions is s-1.
The observation of quantum jumps in a single ion allows the direct measurement of the collision rate in the absence of the 729-nm laser. Every once in a while, the ion undergoes a quantum jump due to an inelastic collision with a particle from the residual gas. We have recorded these quantum jumps which are the result of collisional transfer between the fine-structure levels and from the ground-state. At a base pressure of mbar we have measured an average of 1 quantum jump every 5 minutes resulting in a collision rate of s-1.
IV.1.2 Ion heating
Temperature changes in the ion cloud could play a role in the determination of lifetimes due to changing collision rates and to varying frequency overlap (and therefore varying excitation efficiency) between the ions and the applied lasers. In the ion cloud experiments we have adjusted the 729-nm laser power to make sure that not more than one half of the ion cloud is pumped into the metastable state. As the laser-cooling is permanently applied to the rest of the ion cloud, sympathetic cooling of the dark ions prevents these from heating Larson et al. (1986). We can yet estimate the influence of ion heating from the signal variations at fixed laser frequencies, the upper limit is s-1.
As for the single ions, heating becomes visible if the laser-cooling parameters (mainly the frequency and the power of the 397-nm laser) are largely detuned. After a dark interval the ion will then slowly return to the ”bright” fluorescence level over several measurement bins. In our lifetime measurements, we have made sure that the laser-cooling parameters are optimized and that the ion signal returns to the upper fluorescence trace in a time shorter than one measurement bin (30 ms), even for dark times which are superior to 10 seconds. Moreover, to ensure efficient cooling of the ion, we maintain it in the laser-cooling cycle for at least 600 ms before the 729 nm laser is again admitted to the trap.
IV.1.3 Ion loss
The revival function of the fluorescence in the ion cloud could be biased by competing decay processes, in particular ion loss. Ion loss is not visible on a single revival function but it will be detectable on the over-all fluorescence signal after a one-hour run. The upper limit for the influence of ion loss on the lifetime measurements in an ion cloud is given by s-1.
If the ion is lost, while we are observing quantum jumps, we have to reload a new ion. To make sure, that the vacuum conditions are identical throughout the whole set of experiments, we wait for about half an hour before we restart data acquisition.
IV.1.4 Level coupling by laser light
All the laser beams used in this experiment may couple the different atomic levels due to the Stark effect induced by their electromagnetic field. However, atomic level coupling by the 397 nm laser is negligible in our experiment, laser power at this wavelength being around 50 W for an ion cloud and below 10 W for the experiments with a single ion.
729 nm
One important factor for the reduction of the metastable lifetime is coupling by the 729-nm laser. In fact, even at low laser powers, this radiation may induce transitions to the ground state by stimulated emission on the line. We have taken precautions to avoid any coupling by this laser.
In any case we have to shut off the laser by a mechanical shutter in front of the trap for the observation of the revival function in the ion cloud measurements. The applied power at 729 nm is measured by a beam pick-up photodiode at the entrance of the trap. The instant when the power falls to zero is used to fix the starting point for the fit of the revival function.
In the single ion experiments complete extinction of the laser at 729 nm is essential to avoid reduction of the length of the dark intervals. We use a system of two synchronized mechanical shutters, one at the entrance of the optical fiber and one at its output, to guarantee maximum isolation from this radiation. When both shutters are closed, the 729-nm light level is inferior to the detection limit. For the excitation of quantum jumps, the 729-nm laser is applied to the laser-cooled ion, when the fluorescence level falls below threshold, the shutters are immediately closed. During the first measurement bins the 729-nm radiation is thus still present in the trap and we have to remove these earliest points to make sure that the decay conditions are well defined. In our evaluation of the distribution of the quantum jumps, we use data starting only at the fifth bin, which means that we do not take into account the first 120 ms of a quantum jump, and that quantum jumps whose duration is equal or inferior to that value are completely omitted. As a consequence, low-signal bins due to noise, which are typically of the length of one bin are also eliminated.
866 nm
The main effect which reduces the lifetime of the metastable state is the coupling by the repumper laser at 866 nm Block et al. (1999), which is necessary for laser-cooling. We insist on this point, as this ”helper” laser is often applied with optical power levels largely beyond saturation to compensate for spatial and spectral instabilities.
The determination of the laser intensities seen by the ions is difficult to realize with high precision. On the one hand, absolute calibration of a power meter is in general not constant in time. More delicate still is the measure of the waist size in the ultrahigh-vacuum vessel. We have measured the waist sizes on different days by a commercial instrument (Melles Griot BeamAlyzer) just in front of the entrance of the trap by deviation with a high-quality mirror. This measurement is just an estimate of the waist dimension, as the position and shape of the focal point after the vacuum windows are certainly distorted. Additionally, the trajectory of the ion may be smaller than the waist of the laser. As a consequence, the error bar on the laser intensity seen by a single ion is difficult to estimate and may easily reach 10%, and up to 30 % for very low power levels (below 1).
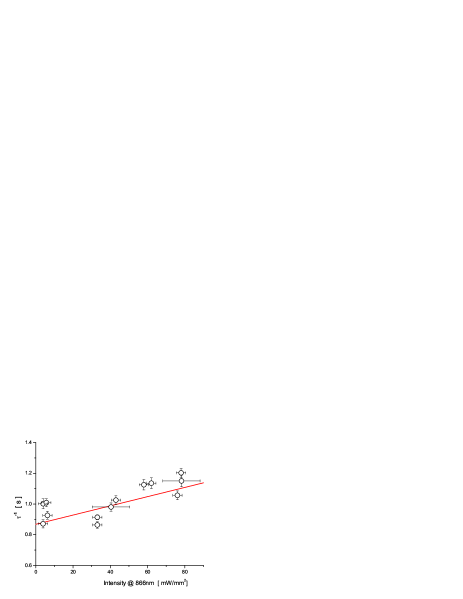
We have checked our lifetime measurements versus the intensity of the repumper laser (see figure 6), observing a reduction of the apparent lifetime of the -level due to the AC Stark effect which couples the - and -states. Data points are somewhat scattered, due to the finite number of quantum jumps per run (cf section IV.2) and the above discussed uncertainty in the power measurement. The extrapolation to zero is made by a weighted least-squares fit to all the measured data points taking into account errors in both coordinates Press (1988). On a 2-scale, all points but one fall into the confidence level limits of the fit. As a matter of fact, the points at lower power levels have a larger intensity error bar, and do thus contribute less than may be expected from the linear representation. The measured lifetime of the ions varies as where I is the intensity of the laser at 866 nm in mW/mm2, and and are the measured and natural lifetimes, respectively. The quantitative dependence of the lifetime on the 866 nm-intensity we have found is of the same order of magnitude as in previous measurements Block et al. (1999); Barton et al. (2000).
IV.2 Data analysis effects
To determine the -level lifetime from the ion-cloud experiments we fitted more than 1700 revival graphs using a least-squares fitting method. Because we could not evidence any dependence of the lifetime on any experimental parameter, the complete set of decay constants has been taken into account to establish the final value. It has been found for these values that different methods of data analysis gave slightly different results. Actually, the mean value of the fitted time constants is not identical to the fit of the sum of the revival curves. Furthermore, harmonic and geometric mean are not identical. We have simulated shelving data of the ion cloud at a given decay rate having the same Gaussian noise pattern as our experimental data. These generated data are free from experimental bias such as ion loss or laser instabilities. Fitting these data demonstrated the variations from the different evaluation approaches, which could be as large as 1.6 % and forms the major contribution to the total error bar.
For a single ion, the total number of quantum jumps taken into account is superior to 40000. As has been discussed in section III.2 the number of quantum jumps which can be acquired in a one-day run is limited to roughly 10000. For measurement times longer than this, temperature drifts start to play a role in our actual experimental set-up, and ion loss may also occur. For the experimental points in figure 6 the mean quantum jump number per set of experimental parameters is of the order of 4000, giving a statistical uncertainty of about 2-3% per data set. These individual uncertainties together with the uncertainties on the power measurements are then used to weight the data points in the extrapolation of the lifetime values to zero repumper power, resulting in an overall statistical uncertainty of 1.8%.
Table 1 summarizes the quantitative influence of the different effects which define the precision of our measurements. Data analysis effects play a major role in the evaluation of the electron-shelving curves in a small ion cloud, whereas the main error contributions in single-ion measurements come from the limited number of quantum jumps and the estimation of the applied laser intensity independent of the data processing method. The total error bars represent an uncertainty on the measurement of the lifetimes of 2.5% in the case of the ion cloud and 1.5% and 1.8% for the single-ion experiments.
V Discussion and conclusions
From the described measurements, the natural lifetime of the -level lifetime has been found to be ms in an ion cloud and ms in a single ion. These two values are very close, though their 1 error bars do not overlap. This discrepancy could be an evidence that ion-ion-collisions in the trap eventually contribute to the reduction of the lifetime. In the laser-cooled ion cloud the particle density of the Ca+-ions is roughly . If we suppose an eventual lifetime reduction on the 1%-level, we can estimate the upper limit of the contribution of ion-ion collisions to be cm3s-1.
As has been discussed in section III.2, we consider that the estimation of the lifetime in single ion measurements is optimal when made by the method of maximum likelihood. Nevertheless, we have also evaluated our data by using the least-squares minimization of the exponential fitting curve and have found (1088 16) ms. This value is in very good agreement with experimental values which have been determined in the past by least-squares methods Block et al. (1999); Lidberg et al. (1999) with comparable number of events and probability distributions. One of the causes generating the discrepancy between these earlier values and recent measurements Barton et al. (2000); Staanum et al. (2003) as well as our value ms could thus possibly be the choice of the data processing method, which may account for differences of a couple of percent depending on the number of considered quantum jumps per run.
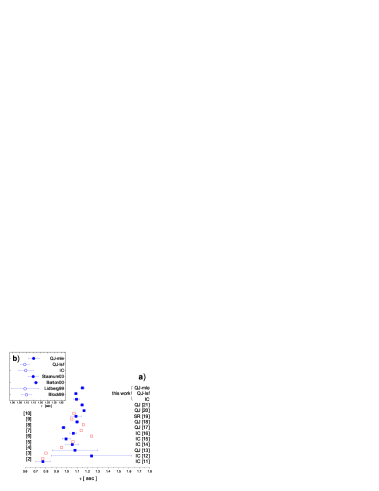
Figure 7 shows all the measurements and calculations that have been carried out on the Ca+-ion over the last years. A wide variety of theoretical models has been used to calculate the lifetime of the metastable state. If we consider only the more recent publications, the values still span over more than 20% of the average lifetime value. Since 1999, experimental measurements are converging towards a value around 1100 ms. Usually, lifetimes are given with a 1 error bar, which corresponds to a poor confidence level. We have plotted the most recent measurements with a error bar standing for a 95% confidence level (see inset on figure 7). Values obtained in the storage ring Lidberg et al. (1999) suffer from a strong collisional background and thus exhibit the largest error bars. The other values have been obtained on laser-cooled single ions in linear and spherical traps. In the figure, a graphical distinction has been made between values obtained by a least-squares fit of the exponential decay curve or maximum likelihood estimates.
In general, the overlap of the recent experimental results is very good, and in particular, the agreement of our value with the one from the Åarhus group Staanum et al. (2003) is excellent. The all-over precision of the experimental determination of the metastable lifetime measurement is very high, making the Ca+-ion an ideal candidate for the comparison with theoretical models.
In conclusion, we have measured the lifetime of the metastable state to a 2.0%-level and shown the influence of the data processing method on the obtained value. Measurement of the -level lifetime would be interesting to allow direct comparison of the fine-structure levels. The actual experimental protocol does not allow such a measurement due to the coupling by the repumper laser. A comparable metastable-level lifetime has been measured in the Ba+-ion Yu et al. (1997). We plan to apply this latter technique for the measurement of the lifetime in Ca+.
The high degree of control of our experimental parameters, that we need for the preparation of the metrological project, has now been achieved . The next step will be the localization of the ion in the trap to better than a fraction of the emitted wavelength, giving access to the Lamb-Dicke regime, where the first-order Doppler broadening can be eliminated Dicke (1953). Stabilization of the clock laser to an ULE cavity will be required to make the laser linewidth compatible with the observed ion features.
Acknowledgements.
This work has benefitted from fruitful discussions with Peter Staanum, David Lucas and Bruno Torrésani. Our project has been financially supported by the Bureau National de Métrologie.References
- Traebert (2000) E. Traebert, Physica Scripta 61, 257 (2000).
- Osterbrock (1951) D. E. Osterbrock, Astrophys. J. 114, 469 (1951).
- Warner (1968) B. Warner, Mon. Not. R. astr. Soc. 139, 115 (1968).
- Ali and Kim (1988) M. Ali and Y. Kim, Phys. Rev. A 38, 3992 (1988).
- Zeippen (1990) C. Zeippen, Astron. Astrophys. 229, 248 (1990).
- Guet and Johnson (1991) C. Guet and W. Johnson, Phys. Rev. A 44, 1531 (1991).
- Vaeck et al. (1992) N. Vaeck, M. Godefroid, and C. Froese-Fischer, Phys. Rev. A 46, 3704 (1992).
- Brage et al. (1993) T. Brage, C. Froese-Fischer, N. Vaeck, M. Godefroid, and A. Hibbert, Phys. Scripta 48, 533 (1993).
- Liaw (1995) S. Liaw, Phys. Rev. A 51, R1723 (1995).
- Biemont and Zeippen (1996) E. Biemont and C. Zeippen, Comments At. Mol. Phys. 33, 29 (1996).
- Urabe et al. (1992) S. Urabe, M. Watanabe, H. Imajo, and K. Hayasaka, Opt. Lett. 17, 1140 (1992).
- Arbes et al. (1993) F. Arbes, T. Gudjons, F. Kurth, G. Werth, F. Marin, and M. Inguscio, Z. Phys. D 25, 295 (1993).
- Urabe et al. (1993) S. Urabe, K. Hayasaka, M. W. H. Imajo, R. Ohmukai, and R. Hayayashi, Appl. Phys. B 57, 367 (1993).
- Arbes et al. (1994) F. Arbes, M. Benzing, T. Gudjons, F. Kurth, and G. Werth, Z. Phys. D 29, 159 (1994).
- Knoop et al. (1995) M. Knoop, M. Vedel, and F. Vedel, Phys. Rev. A 52, 3763 (1995), and earlier references therein.
- Gudjons et al. (1996) T. Gudjons, B. Hilbert, P. Seibert, and G. Werth, Europhys. Lett. 33, 595 (1996).
- Ritter and Eichmann (1997) G. Ritter and U. Eichmann, J. Phys. B: At. Mol. Opt. Phys. 30, L141 (1997).
- Block et al. (1999) M. Block, O. Rehm, P. Seibert, and G. Werth, Eur. Phys. J. D 7, 461 (1999).
- Lidberg et al. (1999) J. Lidberg, A. Al-Khalili, L.-O. Norlin, P. Royen, X. Tordoir, and S. Mannervik, J. Phys. B 32, 757 (1999).
- Barton et al. (2000) P. Barton, C. Donald, D. Lucas, D. Stevens, A. Steane, and D. Stacey, Phys. Rev. A 62, 032503 (2000).
- Staanum et al. (2003) P. Staanum, I. Jensen, R. Martinussen, D. Voigt, and M. Drewsen, EGAS abstracts p. 123 (2003), and http://arXiv.org/abs/physics/0311103.
- Gill (2002) P. Gill, Proceedings of the Sixth Symposium on Frequency Standards and Metrology (World Scientific Ltd, Singapore, 2002).
- Rafac et al. (2000) R. Rafac, B. Young, J. Beall, W. Itano, D. Wineland, and J. Bergquist, Phys. Rev. Lett. 85, 2462 (2000).
- Schrama et al. (1993) C. Schrama, E. Peik, W. Smith, and H. Walther, Optics Communications 101, 32 (1993).
- Champenois et al. (2001) C. Champenois, M. Knoop, M. Herbane, M. Houssin, T. Kaing, M. Vedel, and F. Vedel, Eur. Phys. J. D 15, 105 (2001).
- Houssin et al. (2003) M. Houssin, P. Courteille, C. Champenois, M. Herbane, M. Knoop, M. Vedel, and F. Vedel, Appl. Optics 42, 4871 (2003).
- Dehmelt (1975) H. Dehmelt, Bull. Am. Phys. Soc. 20, 60 (1975).
- Schubert et al. (1989) M. Schubert, I. Siemers,and R. Blatt, Phys. Rev. A 39, 5098 (1989).
- Champenois et al. (2004) C. Champenois, M. Knoop, G. Hagel, M. Houssin, C. Lisowski, M. Vedel,and F. Vedel, to be published.
- Kendall (1961) M.G. Kendall,and A. Stuart, The Advanced Theory of Statistics Vol. 2 (Charles Griffin & Company Ltd, London, 1964).
- Knoop et al. (1998) M. Knoop, M. Vedel, and F. Vedel, Phys. Rev. A 58, 264 (1998).
- Larson et al. (1986) D. Larson, J. Bergquist, J. Bollinger, W. Itano, and D. Wineland, Phys. Rev. Lett. 57, 70 (1986).
- Press (1988) W.H. Press, B.P. Flannery, S.A. Teukolsky,and W.T. Vetterling, Numerical Recipes, chap. 15.3 (Cambridge University Press, 1988).
- Yu et al. (1997) N. Yu, W. Nagourney, and H. Dehmelt, Phys. Rev. Lett. 78, 4898 (1997).
- Dicke (1953) R. H. Dicke, Phys. Rev. 89, 472 (1953).