Quasireplicas and universal lengths of microbial genomes
Abstract
Statistical analysis of distributions of occurrence frequencies of short words in 108 microbial complete genomes reveals the existence of a set of universal ”root-sequence lengths” shared by all microbial genomes. These lengths and their universality give powerful clues to the way microbial genomes are grown. We show that the observed genomic properties are explained by a model for genome growth in which primitive genomes grew mainly by maximally stochastic duplications of short segments from an initial length of about 200 nucleotides (nt) to a length of about one million nt typical of microbial genomes. The relevance of the result of this study to the nature of simultaneous random growth and information acquisition by genomes, to the so-called RNA world in which life evolved before the rise of proteins and enzymes and to several other topics are discussed.
pacs:
PACS number: 87.14.Gg, 87.23.Kg, 89.70.+c, 89.75.-k, 02.50.-r, 05.65.+bGenomes are books of life for organisms and necessarily carry huge amounts of information. By and large bigger genomes carry more information than smaller ones (there are noted exceptions). Yet as far as we know genomes grew and evolved stochastically, modulated by natural selection Dawkins . This raises a puzzling question: how does genomes grow stochastically and simultaneously accumulate information? This paper uses the set of all 108 sequenced complete microbial genomes as data in exploring ideas on randomness, entropy, information and growth with the aim of finding an answer. What emerges is the discovery of a set of universal “root-sequence lengths” governed by a simple exponential relation shared by all the microbial genomes and a model for genome growth that reproduces observed genomic data and that serves as at least a partial answer: genomes are “quasireplicas”grown mainly by maximally stochastic short segmental duplications from random root-sequences of a universal length of about 200 nt.
In what follows we do some groundwork by first discussing the relation between the relative spectral width of a distribution of occurrence frequencies for a set of random events and the size of the set, and the same for the set where all frequencies are multiplied by a factor, and then showing a simple relation between the spectral width and the Shannon information for such sets. We then examine certain statistical properties of complete microbial genomes, present the results and analyze them by way of our growth model.
Consider a set of occurrence frequencies for types of events, =, with mean frequency and standard deviation (std) =. If each frequency is increased by a factor of then and std for the new set , an -multiple of , will both increase by a factor of so that the relative spectral width, , will not change.
Suppose is a set of frequencies of random events of equal likelihood. Then the event probability versus frequency will be nearly a Poisson distribution (provided ) and std = , where 1 is a factor depending only on and approaches unity when is large. That scales as for large is the basis for a well known effect in thermodynamics: the average of some measure of a random system gains sharpness as the system gains size, and achieves infinite sharpness in the thermodynamical (large ) limit.
Let be the frequency set for a “small” system of random events, be the set for a “large” system of random events, and , the -multiple of , be the set for the system . By definition both and are totally random while is only partially so. We have and ; has the large size of and the large of . Compared to , has the randomness of , but repeated times. Compared to , is less random and more ordered by possessing a periodicity.
Shannon expressed the information in a system in terms of decrease in uncertainty Shannon . Shannon’s uncertainty, or entropy, for the system is . We define the information of the system as , which accords with the thermodynamical notion that an increase in entropy results in a decrease in information. We are interested in cases when most of the ’s are non-zero, then acquires its maximum value when all and one finds for a bell-shaped distribution
| (1) |
where the proportional coefficient is about 0.5; it is exactly 0.5 if has a Gaussian distribution. This reveals the close relation between information and relative spectral width. For the three systems , and discussed above, . That is, the partially ordered system has the size of the larger system and the higher information content of smaller system . Summarizing, we have: (i) Given two totally random systems the larger system carries less information; (ii) Given two systems of the same size the one with the larger has more order and carries more information. We should note that since they are simply “periodic”, -multiples do not represent the best route by which a system grows and acquires information. In general, a large or is a necessary but not sufficient condition for high information content. In what follows, pending a verification of Eq. (1), we shall use the terms information and relative spectral width interchangeably.
Consider now single strands of DNA, or nucleotide sequences and view them as linear texts written in the four bases, or letters, A, C, G, T Mantegna94 ; Karlin95 . For a sequence of nucleotides (nt) we denote by , or a -distribution, the set of frequencies , where is the occurrence frequency of the -letter word, or -mer, that may be obtained by moving a sliding window of width across the genome; = and =. To measure the information of a real genomic sequence relative to those expected of a random sequence of the same length (and base composition, see below) we define “relative spectral information” for bell-shaped distributions to be:
| (2) |
where is the factor associated with . A random sequence is expected to have 1.
Suppose , an -replica, is obtained by replicating times a sequence , then every -distribution of is an -multiple of the corresponding -distribution of . In particular, if is a random sequence, then we expect (when ) to a high degree of accuracy, independent of . This motivates the following: Given sequence of length and -distribution , is defined as the root-sequence length of for -mers. For as far as -mers are concerned, (not necessarily an -replica) has the same relative spectral information as that of a random “root-sequence” of length . Only an -replica of a random sequence is expected to have ’s independent of for .
The 108 complete microbial genomes currently in the GenBank GenBank are heterogeneous in length - 0.4 to 7 million bases (Mb) - and base composition - 20 to 80% A+T. In most cases the numbers of A’s and T’s (and of C’s and G’s) in a genome are very similar. We therefore characterize the base composition of a genomes by a single parameter , the combined probability of A and T, or C and G, whichever is greater.
In Fig. 1 the 5-distributions (green/gray curves) of random sequences 2 Mnt long with equal to 0.5 (A), 0.6 (B) and 0.7 (C), respectively, are shown together with the per 2 Mnt 5-distributions (black) of three genomes with matching values: A. fulgidus aful (A), S. pneumoniae spne (B) and C. acetobutylicum cace (C). Only the distributions in (A) for the sequences satisfy the bell-shape requirement to make Eq.(1) directly applicable. In this case the random distribution is indeed Poissonian and the genomic distribution is much wider, so that information-wise, as far as 5-mers are concerned, a 2 Mnt stretch of the A. fulgidus genome is like the 400-replica of a random sequence merely 5 knt long.
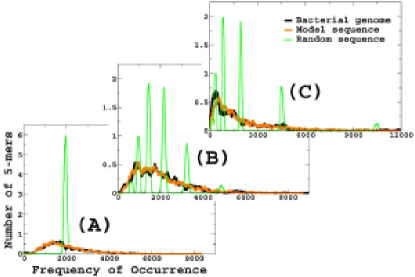
For random sequences with the single Poisson distribution is split into smaller Poisson distributions (Fig. 1 (B) and (C)), one for each of the subsets of -mers with AT’s (called -sets), whose respective means are , = 0 to . For the genomes the distributions for the -sets are so broadened that no individual peak is discernable. Notably in cases when , the for the whole distribution is mostly determined by the spread of the ’s, which gives , rather than by the information of the sequence. We thus generalize the definition for given in Eq.(2) to be the weighted average over the relative spectral information of the -sets:
| (3) |
where is a binomial, . Since A and T (and C and G) are counted together and the number of each monomer in the sequence is fixed, the binomial factor is taken to be . In practice, to circumvent large fluctuations in induced by small unevenness in the A/T (or C/G) contents - this can occur when is very large at =2 and 3 - each frequency is divided by a factor , where runs over the four bases and . To verify Eq. (1), we also define a “relative Shannon information” where in Eq. (3) is replaced by .
Fig. 2 shows log-log plots of and versus sequence length computed from a “genome” set composed of 108 complete microbial genomes GenBank and two control sets with lengths and base compositions matching those in the genome set: a “random” set of random sequences and a “replica” set of 100-replicas of random sequences. The results for the control sets are shown in the left-panel ((A) and (B)) of Fig. 2 and they are essentially independent of , sequence length and base composition and have the expected values: (A) 0.062 - this verifies Eq (1); (B) 0.11 for the random set and 12 for the replica set. Each set contains 972 pieces of data and in each plot about 50% of the error comes from data for =2 (“” in the figure) and 25% from =3 (“”). This is because for these cases are very large and magnify fluctuations in in Eq (3).
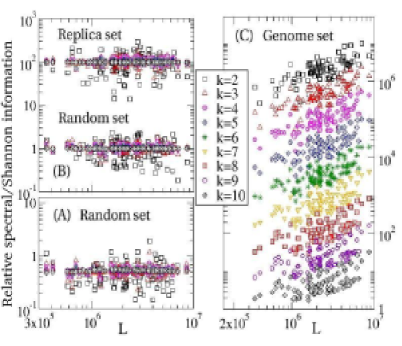
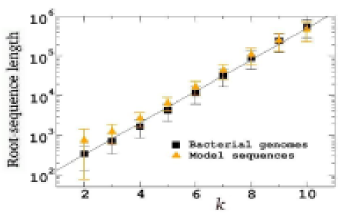
The right-panel of Fig. 2 shows for the genome set, where each piece of data was multiplied by a factor of to delineate data into different groups for better viewing. Still essentially -independent, the data are otherwise entirely different from those of the control sets: (i) For given they form a band (std is about 50% of mean) that depends linearly on , implying that is a universal root-sequence length, i.e., the same for all microbial genomes. (ii) For given , the mean decreases approximately linearly with increasing , such that the universal lengths (squares in Fig. 3) satisfy an approximate exponential relation of the form
| (4) |
with nt and . We remark that the property revealed by the log-log plot in Fig. 2 (C) is different from Zipf’s law Zipf and its variants that have been much discussed for -mer frequencies ( 6) in biological sequences Mantegna94 ; Luscombe02 .
The universality of the ’s suggests the existence of a universal mechanism for (microbial) genome growth from proto-genomes of a universal initial length. The very large values of (hence the shortness of the ’s) for the smaller ’s imply a mechanism involving a great deal of replication or duplication. One obvious mechanism, growth mainly by whole-genome replications Ohno70 ; Hughes01 is ruled out because that would yield -independent ’s, contrary to data. The observed strong -dependence of suggests a more complex duplication process.
We show that “universal genomes” generated in a simple and biologically plausible growth model Hsieh02 ; Hsieh03 possess properties similar to those of microbial genomes. In the model the initial condition of a genome is a random sequence about 200 nt long with a base composition characterized by a given value of . The condition 300 nt is necessary if the large values of for the small ’s are to be attained. The genomes then grows by random short segmental duplications - or quasireplication - possibly modulated by random single mutations. The model shares some features with those used to explain the power-law behavior of the occurrence frequency of genes in genomes Yanai00 ; Qian01 , except that there the units of duplication are genes, not the short oligonucleotides used here. The quasireplication process is maximally stochastic: a segment of length , chosen according to the probability density function , is copied from one site and inserted into another site, both randomly selected. The Erlang function, the integer =2 and the length scale =6.7 (nt) were determined by data, implying a typical length of nt for the duplicated segments.
In Fig. 3 the ’s (triangles) extracted from a set of 108 model sequences with length and base composition matching those in the genome set and generated in silico by quasireplication are compared with the ’s for the genome set (squares). The two sets of lengths essentially agree although those from the model sequences have a slightly weaker -dependence. The -distributions of 5-mers computed from three representative model sequences with = 0.5, 0.6 and 0.7, respectively, are shown as orange curves in Fig. 1. These results show that our very simple growth model, in being able to produce sequences that faithfully exhibit signature global properties of microbial genomes, likely has captured the essence of the real genomic growth process. We believe that without the two main ingredients of our model, very short initial genome length ( 200 nt) and random duplication of short segments, no simple growth model can produce the results shown in Fig. 3.
We call sequences generated in our model quasireplicas. Unlike an -replica, a quasireplica is globally aperiodic. If the length of a quasireplica is , then the maximum for which Eq. (4) applies is given by . For a quasireplica acts as an -replica where , while for it appears essentially as a random sequence. Quasireplicas are partially ordered, highly complex and evidently capable of carrying large amounts of information. Our study shows that microbial genomes are self-organized quasireplicas belonging to the class given by nt and of Eq. (4). It is a common feature of complex self-organized systems to exhibit power-law relations Bak and the relation between our model and Eq. (4) is being explored.
Quasireplicas are extremely robust. We have verified that, provided the typical duplicated segment length is significantly greater than , quasireplication (including simple replication) of a quasireplica begets a longer quasireplica of the same class. We are currently studying eukaryotic genomes in terms of quasireplicas and results will be reported elsewhere. Based on findings obtained so far we make the following proposition: the ancestors of microbial genomes underwent a fundamental transition in their growth and evolution shortly after they had reached a length of about 200 nt, by which time they had acquired a rudimentary duplication machinery, and then grew (and diverged) mainly by short-segment quasireplication to become quasireplicas of the order of 1 Mnt long. Assuming this proposition to be substantially true we mention some implications.
It seems that by adopting the natural method of quasireplication for growth, microbial genomes also adopted a superb strategy for information acquisition and accumulation, and in doing so they left a clear evolutionary track: the universal root-sequence lengths. This seems to put the onset of quasireplication in the position of being another, hitherto unknown, major transition in evolution Smith . Before that transition the ancestral genomes and their prebiotic precursors somehow acquired a store of information - including a rudimentary duplication machinery - and after the transition the genomes evolved via quasireplication. The smallness of the genomes at the transition - less than a quarter of the size of a present-day gene coding for a typical enzyme - implies that at the time they must have lived in an “RNA world” devoid of proteins Gilbert86 ; Joyce02 . It is likely that the ribozymes that made up the duplication machinery at that time were not much bigger than the smallest ribozymes now extant, about 31 to 50 nt Forster87 ; hence the average duplicated segment length of about 20 nt would have been effective in propagating coded information which, presumably, could later be locally varied under the combined forces of mutation and natural selection for adaptation to new purposes. An RNA world reigned no more than 600 million years, from about 4.2 (when the earth cooled down) to 3.6 (when protein must have appeared) billion years ago - probably even much shorter Joyce02 . It is not necessary that genomes grew to their respective current lengths during that period. It is sufficient that during that period, growth by short segmental quasireplication produced basic quasireplicas which, after the rise of proteins and enzymes, could be further expanded upon via quasireplication by duplicating longer segments, including genes Yanai00 ; Qian01 . Whatever path the genomes actually took, their rate of evolution must have been tremendous during the RNA era, and quasireplication probably had a better chance of meeting that challenge than any other alternative.
This work is supported in part by the grant 91-2119-M-008-012 from the National Science Council, ROC. HCL thanks H.Y. Lee and Ceaga Lee for discussions.
References
- (1) R. Dawkins, The Blind Watchmaker, (Penguin, 1988).
- (2) C. E. Shannon, Bell Sys. Techn. J. 27 (1948) 379.
- (3) R. N. Mantegna, et al., Phys. Rev. Lett. 73 (1994) 3169.
- (4) S. Karlin and C. Burge, Trends in Gen. 11 (1995) 283.
- (5) The GenBank, http://www.ncbi.nlm.nih.gov/PMGifs/ Genomes/micr.html (Version January 26, 2003).
- (6) H.P. Klenk, et al., Nature 390 (1997) 364.
- (7) H. Tettelin, et al., Science 239 (2001) 498.
- (8) T. Shimizu, et al., Proc. Natl. Acad. Sci. (USA) 99 (2002) 996.
- (9) G. K. Zipf, Human Behavior and the Principle of Least Effort, Addison-Wesley, Boston, 1949).
- (10) N. M. Luscombe, et al., Gen. Biol. 3 (2002) res.0040.1.
- (11) S. Ohno, Evolution by Gene Duplication, (Springer Verlag, New York, 1970).
- (12) A. L. Hughes, et al., Genome Res. 11 (2001) 771.
- (13) L. C. Hsieh, et al., Phys. Rev. Lett. 90 (2003) 018101.
- (14) L. C. Hsieh, et al., AAPPS Bull. 13 (2003) 22.
- (15) I. Yanai, et al., Phys. Rev. Lett. 85 (2000) 2641.
- (16) J. Qian, et al., J. Mol. Biol. 313 (2001) 673.
- (17) P. Bak, et al., Phys. Rev. Lett. 59 (1987) 381.
- (18) J. Maynard Smith and E. Szarthmary, The Major Transitions in Evolution, (Oxford Univ. Press, London, 1997).
- (19) W. Gilbert, Nature 319 (1986) 618.
- (20) G. F. Joyce, Nature 418 (2002) 214.
- (21) A. C. Forster and R. H. Symons, Cell 49 (1987) 211.