Internal Motility in Stiffening Actin-Myosin Networks
Abstract
We present a study on filamentous actin solutions containing heavy meromyosin subfragments of myosin II motor molecules. We focus on the viscoelastic phase behavior and internal dynamics of such networks during ATP depletion. Upon simultaneously using micro-rheology and fluorescence microscopy as complementary experimental tools, we find a sol-gel transition accompanied by a sudden onset of directed filament motion. We interpret the sol-gel transition in terms of myosin II enzymology, and suggest a “zipping” mechanism to explain the filament motion in the vicinity of the sol-gel transition.
pacs:
87.16.Ka, 87.15.La, 87.15.Nn, 87.16.NnEucaryotic cells show an amazing versatility in their mechanical properties. Not only can they sustain stresses ranging from some tenths to hundreds of Pascals, but they can equally well perform such complex processes as cytokinesis and cell locomotion. A vital role for these and other cellular functions is played by the cytoskeleton, the structural framework of the cell composed of a network of protein filaments. A major component is filamentous actin (F-Actin), whose physical properties are by now well characterized legoff-etal:02 . The length distribution, spatial arrangement and connectivity of these filaments is controlled by a great variety of regulatory proteins.
An important family of these regulatory proteins are cross-linkers, which can be further classified as passive or active. The function of passive cross-linkers, e.g. -actinin, is mainly determined by their molecular structure and the on-off kinetics of their binding sites to actin. Upon changing the association-dissociation equilibrium and hence the degree of cross-linking by varying the temperature the network can be driven from a sol into a gel state tempel-etal:96 . Depending on both the concentration and the affinity of these cross-linkers for F-actin there is a tendency to either form random networks or bundles wachsstock-schwarz-pollard:93 . Motor proteins of the myosin family can also act as active cross-linkers. When both of its functional head groups are bound to two different filaments they can use the energy of adenosine-triphosphate (ATP) hydrolysis to exert relative forces and motion between them. However, such an event is very unlikely under physiological conditions and ATP saturation, because then myosin II spends only a short fraction of its chemomechanical cycle attached to the filament (duty ratio: howard_book ). Active relative transport yet becomes possible due to the concerted action of several motors if in vitro myosin II proteins assemble into multimeric minifilaments humphrey-etal:02 .
In this letter we study actin networks containing the heavy meromyosin (HMM) subfragment lacking the light meromyosin domain responsible for myosin II assembly. Our focus is on the viscoelastic phase behavior and internal dynamics of such networks during ATP depletion. We use an experimental setup combining microrheology with fluorescent microscopy of labeled filaments. This allows us to identify a sol-gel transition accompanied by a sudden onset of directed filament motion.
Monomeric actin (G-actin) was prepared from rabbit skeletal muscle as described by Spudich and Watt Spudich:1971 . In order to reduce residual cross-linking and capping proteins it was purified by an additional step using gel column chromatography (Sephacryl S-300). Actin was sterile filtered and kept in G-buffer Spudich:1971 on ice. Myosin II was obtained from rabbit skeletal muscle according to a procedure by Margossian and Lowey Margossian:1982 . Then, HMM was prepared from this myosin II by TLCK-treated chymotrypsin digestion following Kron et al. Kron:1991 with one modification: After the chymotrypsin treatment the solution was dialyzed against a large volume of low-salt buffer. The concentration was determined by absorption spectroscopy (absorption coefficient cm2/mg at nm) Weeds:1977 . HMM was stored either by rapid immersion of droplets in liquid nitrogen or by mixing with % sucrose. The frozen droplets or small aliquots of the mixed solution where stored at C. Function tests for both myosin and HMM were performed by motility assays according to Kron and Spudich Kron:1986 .
Fluorescently labelled reporter filaments were produced by polymerizing G-actin in slightly modified F-buffer (Spudich:1971 , using mM ascorbic acid instead of DTT) in presence of equimolar tetramethylrhodamineisothiocyanate labelled phalloidin at room temperature. The actin concentration was M. For storage, the reporter filaments were kept on ice and used within three days. The surrounding actin network was prepared in F-buffer Spudich:1971 . The ATP concentration was adjusted to values between M and mM. An antioxidant system ( mg/mL glucose, mg/mL glucose oxidase, mg/mL catalase, Vol.-% mercaptoethanol) was added to the buffer solution. Then, approximately – L of the fluorescently labelled reporter filaments were carefully diluted in mL of this antioxidant buffer. Second to last, HMM was added. With the final addition of G-actin polymerization was started. We used L of this solution for fluorescence microscopy measurements. The rest was carefully mixed with magnetic beads (Dynabeads M-450, Dynal, Hamburg, Germany; 4.5 m radius) and used for magnetic tweezers experiments, as described in Keller:2001 .
All experiments were performed with freshly prepared actin kept on ice for at most days. We worked with and M actin solutions, corresponding to an actin concentration of and mg/mL, equivalent to a mesh size and m, respectively, Schmidt:1989 . The ratio of labelled to unlabelled actin was between and . The molar ratios of actin to HMM were , and , corresponding to HMM concentrations between and nM. After approximately – min, % of G-actin is polymerized into F-actin Detmers:1981 . Measurements were started at least min after the polymerization was initiated. % of the reported filament transport events happened min or later after polymerization start.
Fluorescence measurements were performed in a closed sample chamber (containing approximately L) with an inverse microscope (Zeiss Axiovert 200, oil immersion objective (N.A. 1.3)) and a CCD camera (Orca C4742-95-12ER, Hamamatsu, Herrsching, Germany). bit images of size pixels (using binning) were stored directly on the hard disk of a personal computer using the on-line image processing software “Open Box” developed in this laboratory Keller:2001 . The frame rate was approximately Hz. A given region in the sample could be observed for several minutes before the contrast of the image was decreased by photo bleaching significantly.
We now discuss our results obtained with a magnetic tweezers micro-rheometer Keller:2001 ; Schmidt:1996 . Magnetic beads of m diameter, embedded in the network during polymerization, were subjected to an oscillating magnetic force of – pN. Figure 1 shows the resulting oscillatory motion, analyzed by a particle tracking procedure with an accuracy better than nm and time resolution less than ms.
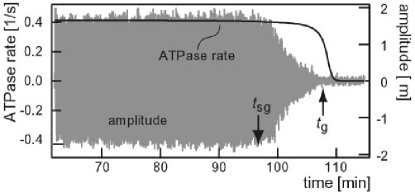
All our data show a characteristic time , where the bead amplitude starts to shrink drastically. This is followed by a transition regime, , during which the bead amplitude falls below the noise level. We interpret this as a sol-gel transition caused by the continuous depletion of ATP. For , ATP is present in abundance producing a fast release of HMM from actin such that it cannot act as a cross-linker. In this first phase we have a network with the mechanical properties of a semidilute solution of F-actin. When ATP starts to lack, the residence time of HMM on actin increases, which in turn induces progressive cross-linking of the filaments leading to a stiffening of the network. In addition to their role as passive cross-linkers HMM also can actively generate forces between filaments. These two different roles are not easily distinguished when looking at rheology data alone, but become evident from the dynamics of the embedded reporter filaments, which we discuss below.
Upon using known features of myosin II enzymology we can give an almost quantitative picture of the dynamics of the HMM molecules in the actin network and the resulting time-dependence of the bead amplitudes during the process of ATP consumption. A rough estimate of the consumption rate is , where is the initial ATP concentration and is the total HMM concentration. This estimate neglects cooperative effects of preferential binding of HMM molecules close to already bound HMMs orlova97 . From the experimental data in Fig. 1 one gets s-1 for each HMM, which is much closer to the ATPase rate in the absence of actin than in a saturated F-actin solution howard_book . We explain this as a consequence of the diffusive search of the HMM for an actin filament being the rate limiting process. The characteristic rate of search and binding to an actin filament can be estimated as , where is the rate for diffusing a distance comparable to the mesh size ; is the diffusion constant of HMM in water and is the volume fraction of actin in solution. From experimental data we estimate 111For the estimate we take the Einstein-Stokes relation , where kg s/m, J, and the hydrodynamic radius of HMM is nm. Our estimate for the volume fraction is within an uncertainty of keller:thesis . s-1 which is of the right order of magnitude.
Starting from these considerations we calculated the ATP consumption rate as a function of time using known rates from the literature 222We use the enzymatic rates of table 14.2 in Ref. howard_book . A detailed analysis and study of the inhibition effect of ADP will be published in a more extended article keller:unpublished . with the exception of , which was computed along the lines explained above. The results are shown as the solid line in Fig. 1. The sol-gel transition occurs at a time when ATP depletion becomes significant and the typical ATPase rate starts to decrease strongly. Note that we have taken into account the inhibition effect of ADP, which increases in solution because of the ATP hydrolysis. Indeed, ADP plays an important role in both the shape of the ATPase rate and in the estimate of and . For example, an increase of the initial ADP concentration decreases while it increases keller:unpublished .
Our experimental setup allows us to simultaneously measure the amplitude of embedded beads and the dynamics of fluorescently labelled reporter filaments. At the beginning of the experiment, while the network is still not fully polymerized, these filaments show a rather uniform diffusive behavior similar to free filaments in aqueous solutions. Towards the end of the polymerization process, the movement of the reporter filaments becomes more and more restricted by the surrounding network. In this phase, , the actin filaments show thermal undulations and perform Brownian motion along the cylindrical cages formed by the surrounding F-actin. In contrast to an actin network containing myosin II minifilaments humphrey-etal:02 , here long term directed motion of F-actin is observed only rarely. During the sol-gel transition, , any drift that sometimes was observed in the sample chamber came to a rather abrupt end indicating the stiffening of the network. At the same time single filaments that shortly before had hardly shown any fluctuations, suddenly started long term directed motion inside the three dimensional network (Fig. 2a–c).
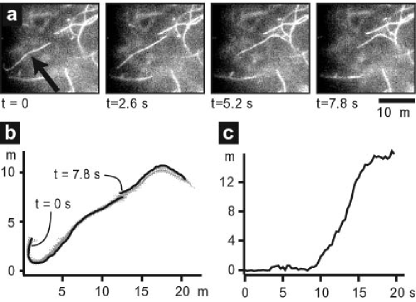
For our study, moving filaments were evaluated. The phenomenon of moving filaments in the actin-HMM network occurs in a narrow time slot of some minutes in the proximity of , i.e. when ATP depletion starts. There are also some rare events of directed filament motion outside this time window. In some regions of the sample up to % of the filaments in focus move, in others only a small fraction is mobile. The described phenomena occur under different buffer conditions, different actin and HMM concentrations and different molar actin-to-HMM ratios. Also, aging of HMM stock solutions is affecting the motion. Therefore, only experiments performed on the same day with the same actin preparation and HMM stock solution were compared. The values obtained for the filament mean run length and mean velocity are compatible with two dimensional motility assays at low ATP concentration howard_book . The longitudinal motion occurred at speeds up to m/s over distances up to m. Single filaments were moving continuously for up to s. The movement consists of an acceleration phase, a phase of constant speed and a deceleration phase (cf. Fig. 2c). Due to experimental limitations, not all the observed filaments could be monitored in all three phases. In many cases, the filaments moved a distance of approximately their own visible length and then paused.
What is causing this sudden onset of directed filament motion in the vicinity of the sol-gel transition? We interpret it as follows. In a three-dimensional actin network double-headed myosin can exert relative forces between filaments only if its heads are simultaneously attached to two different filaments while one of its heads is performing a power stroke. Since under saturating ATP condition myosin II has a very low duty ratio, such events are extremely rare. Actin filaments can be transported only if a certain amount of motors work together like in the thick filament of a sarcomere. A similar effect seems to be at work in recent experiments where myosin II molecules arrange themselves into minifilaments humphrey-etal:02 . In the present study we use HMM, which does not form such minifilaments. Hence cooperativity of the motors must be achieved by a different route. Now, ATP is needed to trigger the dissociation of the motor from the filament, and an initial ATP concentration is depleted due to the ATP-hydrolysis of the motor. This prolongs the time a myosin head stays bound to a filament (duty ratio), which increases the chance for the other head to also bind to a filament while the first one is still bound. As a consequence one can have two opposing effects. First, an increasing fraction of HMM molecules acts as cross-linkers in the actin network, and stiffens it. This explains the sol-gel transition observed by the sudden decrease in the amplitude of the oscillating magnetic bead (see Fig. 1), and also the stop of a drift in the sample chamber as mentioned above. Second, the probability that myosin molecules can exert directed forces onto actin filaments is increased. One may envisage the following “zipping” mechanism, illustrated in Fig. 3a–d. After one myosin dimer happens to bind two anti-parallel filaments simultaneously, thermal fluctuations in the vicinity of the binding site are reduced. This enhances the probability that nearby myosin molecules also bind to both filaments and leads to a nucleation process which zips the filaments together and generates relative filament motion. During the transport the overlap region may grow. This would explain the sudden onset of filament motion with a moderate acceleration phase. Such an interpretation is also supported by the broad distribution of run lengths and run times seen in our traces; zipping of the filaments can either occur at one of the ends leading to a maximal run length identical to the filament length or along the contour which potentially greatly reduces the run length due to entanglement effects.
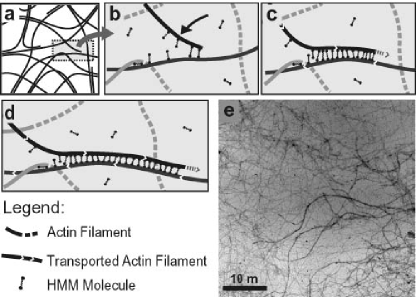
We have explored how the observed effects depend on actin, , and HMM concentration, , and obtained the following tendencies. Doubling from to M while keeping M constant reduces the average transport length by a factor of . Within the “zipping” mechanism this can be attributed to entanglement effects. Reducing from to M with M fixed lowers the average transport speed from to m/s. This may be understood as a result of the reduced number of motors in the zipped region between the filaments. In general we observe broad distributions in running length, time and speed. This may be due to heterogeneities in the network (see Fig. 3e), length distribution of actin filaments, their relative orientation kruse-julicher:00 as well as the location of the initial seed in the zipping process. Future experiments with a much larger number of traced filaments and samples are certainly necessary to explore the details of this fascinating dynamic phenomenon.
We thank H. Kirpal for HMM preparations, M. Rusp for actin preparations and her help with the electron microscope, and J. Schilling for providing the image processing software “Open Box”. This research has been financially supported by the Deutsche Forschungsgemeinschaft (SFB 413) and the Fonds der Chemischen Industrie. A.P. is supported by a Marie-Curie Fellowship under contract no. HPMF-CT-2002-01529. We acknowledge helpful discussions with K. Kroy and G. Lattanzi.
References
- (1) L. LeGoff, O. Hallatschek, E. Frey, and F. Amblard, Phys. Rev. Lett. 89, 258101 (2002).
- (2) M. Tempel, G. Isenberg, and E. Sackmann, Phys. Rev. E 54, 1802 (1996).
- (3) D. Wachsstock, W. Schwarz, and T. Pollard, Biophys. J. 65, 205 (1993).
- (4) J. Howard, Mechanics of Motor Proteins and the Cytoskeleton (Sinauer Associates, Sunderland, MA, 2001).
- (5) D. Humphrey et al., Nature 416, 413 (2002).
- (6) J. A. Spudich and S. Watt, J. Biol. Chem. 246, 4866 (1971).
- (7) S. S. Margossian and S. Lowey, Methods Enzymol. 85, 55 (1982).
- (8) S. J. Kron et al., Methods Enzymol. 196, 399 (1991).
- (9) A. G. Weeds and B. Pope, J. Mol. Biol. 111, 129 (1977).
- (10) S. J. Kron and J. A. Spudich, Proc. Natl. Acad. Sci. U. S. A. 83, 6272 (1986).
- (11) M. Keller, J. Schilling, and E. Sackmann, Rev. Sci. Inst. 72, 3626 (2001).
- (12) C. F. Schmidt et al., Macromolecules 22, 3638 (1989).
- (13) P. Detmers et al., J. Biol. Chem. 256, 99 (1981).
- (14) F. G. Schmidt, F. Ziemann, and E. Sackmann, Eur. Biophys. J. 24, 348 (1996).
- (15) A. Orlova and E. Egelman, J. Mol. Biol. 265, 469 (1997).
- (16) M. Keller, A. Parmeggiani, E. Sackmann, and E. Frey, (unpublished).
- (17) K. Kruse and F. Jülicher, Phys. Rev. Lett. 85, 1778 (2000).
- (18) M. Keller, Ph.D. thesis (TU München, 2003)