On the origin of the deviation from the first order kinetics in inactivation of microbial cells by pulsed electric fields
Abstract
A computer model was developed for estimation of the kinetics of microbial inactivation by pulsed electric field. The model is based on the electroporation theory of individual membrane damage, where spherical cell geometry and distribution of cell sizes are assumed. The variation of microbial cell sizes was assumed to follow a statistical probability distribution of the Gaussian type. Surviving kinetics was approximated by Weibull equation. The dependencies of two Weibull parameters (shape n and time , respectively) versus electric field intensity E and width of cell diameters distribution was studied.
I Introduction
Pulsed electric fields (PEF) processing is a promising method of food preservation. Many investigators have shown the effectiveness of PEF application for killing bacteria in liquid foods (Barbosa-Canovas et al., 1998; Barsotti & Cheftel, 1998; Wouters & Smelt, 1997). However, there still exist a considerable gap in understanding the inactivation mechanism. The important problem is to elucidate how kinetics of killing depends on the type of bacteria and treatment protocol (electric field strength E, form of pulse, pulse duration ti, total time of treatment).

The phenomenon of PEF-inactivation of microbial cells is related to selective damage of biological membrane. Electrical conductivity of the membrane is very low. The reported values are of order of (Kotnik et al., 1998). Therefore, the highest drop of potential occurs on the membranes. The transmembrane potential of a spherical cell depends on the angle between the external field direction and the radius-vector r on the membrane surface, where potential is to be determined (Fig. 1). This potential may be determined using the well-known Schwan’s equation (Schwan, 1957),
| (1) |
where is the cell diameter, and is a parameter depending on electrophysical and dimensional properties of the membrane, cell and surrounding media. In dilute suspension of cells, parameter is close to 1 (Kotnik et al., 1998).
So, the cell transmembrane potentials in suspension of cells depend on the cell diameter and angle and for the single cell value of is maximal at cell poles and decreases to zero at . That is why the membrane damage probability is maximal at membrane poles and that bigger sized microbial cells are killed before smaller ones. Microbial cells always show a variety of shapes and dimensions (Bergey, 1986). Their size may vary depending on their age, the nutrients in the growth medium, release mechanisms of microbial particles etc. (Harding, 1975; Reponen et al., 1992). So, microbial cells killing probability can also change from cell to cell.
After PEF treatment during time in the electric field the surviving fraction is defined as the ratio of the number of undamaged microbial cells to the total number of microbial cells (Barbosa-Canovas et al., 1998). If all the cells are spherical and are of the same size, then their damage may be considered as statistically independent events, and the time dependence can be approximated by the first-order kinetic equation:
| (2) |
where is a time parameter that corresponds to the effective inactivation time of cells in the external electric field E.
Unfortunately, in most cases, the simplest approximation of the first-order kinetics is not applicable for description of the microbial inactivation experiments in pulsed electric fields (Barbosa-Canovas et al., 1998). Hulsheger et al. (1983) proposed an empirical equation of type
| (3) |
where and are the threshold treatment time and electric field intensity, and k is an empirical parameter. Although this equation is very popular, it has no theoretical justification.
The models widely used presently for describing the survival curves are Fermi, log-log and log-logistic models (Barbosa-Canovas et al., 1998; Peleg, 1996; Alvarez et al., 2000) but they are also of an empirical nature. Specifically, the Weibull distribution may be a useful generalization that that includes exponential first order kinetics as a special case (Peleg, 1995, 1999)
| (4) |
where is a time parameter and is a shape parameter. In the case when =1, Eq. (4) reduces to Eq. (2).
The time parameter in Weibull distribution accounts for the effective inactivation time, and shape parameter accounts for the concavity of a survival curve (van Boekel, 2002). Weibull distribution was applied for fitting experimental PEF inactivation data (Alvarez et al., 2002), but physical meaning of the obtained parameters and was not elucidated yet.
A possible deviation from the first order PEF inactivation kinetics may be caused by existence of a variety of microbial shapes and dimensions. The purpose of this paper is to analyse how the form of the survivor curves can reflect existence of a distribution of cell diameters.
II Computational model and details of calculations
The Monte Carlo technique was used for simulation of PEF inactivation kinetics of microbial cells. Initial number of microbial cell in suspension was put as No=107. A Gaussian law distribution function of cell diameters was assumed (Fig.1)
| (5) |
where and represent the average diameter and the standard deviation, respectively.
An arbitrary microbial cell was chosen in suspension for a given time . Then, a random point on the membrane surface was chosen by generating of cos value randomly in the intervals -. The lifetime of a membrane on the surface of a cell depends on its diameter , angle , and intensity of external field . It was found on the basis of the transient aqueous pore model (Weaver & Chizmadzhev, 1996), that:
| (6) |
where ) was calculated from Eq. (1). Here, is the parameter ( in the limit of very high electric fields), and are the line and surface tensions of membrane, respectively, is the Boltzmann constant, is the absolute temperature, is the voltage parameter (the dimension of is Volts), is the specific capacitance of a membrane, are the relative dielectric permittivities of the aqueous phase and of the membrane, respectively.
The probability of the chosen cell damage was approximated by the first-order kinetic equation as . This procedure was repeated for all the cells in the suspension. Then, the number of killed cells was enumerated for the given time t, surviving fraction was calculated, time was increased by a time step and procedure was repeated from beginning.
In this work, the voltage scale parameter was estimated as V from data obtained by Lebedeva (1987) for the general lipid membranes (N, N/m, , , F/m2 at K). The time scale parameter was put as s (Lebedeva, 1987). Dimensionless reduced field intensity was defined as , where was estimated as kV/cm at .
III Results and discussion
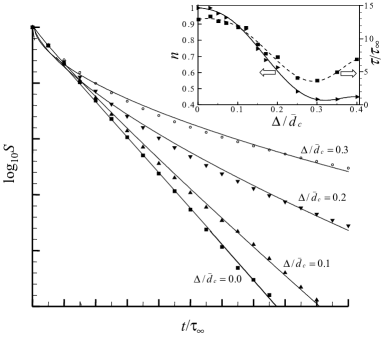
Figure 2 presents some examples of the calculated survivor curves for suspension of cells (symbols) at the given value of reduced field intensity (22.7 kV/cm, at m). The first order kinetics law is only observed for suspensions of identical cells (). In other cases, the noticeable deviations from the first order kinetics are observed and the more pronounced deviations are observed with increase of .

The solid lines drawn through the symbols are the best fit to data simulated using the Weibull function (Eq. 4). The Weibull law seems to be very appropriate for approximation of calculated survival curves (in all the cases the correlation coefficient was higher than 0.993). Insert to Fig.2 shows the shape and relative time parameters of Weibull distribution versus relative width of cell diameter distribution . In these estimations the fitting was done within the time interval . At s (Lebedeva, 1987) this time interval corresponds to s. Both the shape parameter and the relative time parameter initially decrease with increases of the standard deviation . Then, a small elevation of these values is observed, which can be explained by the distortion of the Gaussian distribution at higher values of . But this model always gives only upward concavity, i.e. .
Parameters and are also very sensitive to the value of electric field intensity (Fig. 3). Dependencies of versus are rather complex, but in all cases parameter increases with increase of the distribution width . Relative time parameter decreases considerably with field intensity increase, but it is practically independent of . So, it is possible to conclude that upward concavity of survivor curve is rather sensitive both to the field intensity and to the variability of microbial diameter distribution, but the effective inactivation time is insensitive to the variations in cell diameters.
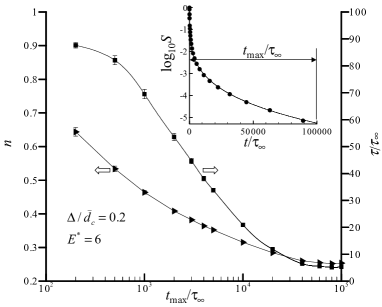
The numerically estimated shape and relative time / parameters are rather sensitive to the time interval of Monte Carlo data fitting with Weibull function Eq. (4). Fig. 4 shows a typical example of and / versus / dependencies for fitting of the same survival curve when upper bound of the time interval is varied. In fact, is a relative total time of treatment. In all cases, the apparent consistency between Monte Carlo data and Weibull function with adjusted parameters and / was rather good, and the correlation coefficients lied in the interval 0.993-0.998. But at the same time, parameter and are sensitive to the upper cutting boundary , and this fact reflects existence of an intrinsic inconsistency between unknown survival function and Weibull function.
IV Conclusion
The discussed illustrative examples show that geometry of the survival curve is very sensitive to the distribution of cell diameters. The Weibull function seems to be appropriate for approximation of the calculated survival curves. The parameters of this function and are rather sensitive to the width of distribution of the cells diameters, electric field intensity and total time of treatment. We would note, that the proposed model is based on several restrictive assumptions. The survival kinetics may reflect many intrinsic details of the real microbial cells. For explanation of the survival curves, experimentally observed for PEF-inactivated population, it is necessary to introduce into the model the experimentally determined distribution functions of cell diameters. It is also desirable to use in calculations more realistic law of an individual membrane damage, based on experimentally estimated data for the given bacterial population. The possible effects of sub-lethal damage, when bacterial damage needs some critical destructive exposure, also were not considered in this model. A deviation from the first-order kinetics may be also influenced by others factors, such as existence of bacterial geometry anisotropy and distribution of bacterial orientations. So, in future it is seems to be important to find correlations between variations in factors, influencing bacterial geometry, dimension distribution function, details of membrane damage and parameters of bacterial inactivation kinetics. Such work should be done in order to improve practically important PEF-treatment regimes for reaching a desirable value of microbial inactivation.
Acknowledgements
The authors are indebted to the anonymous referee for helpful comments on the manuscript and valuable suggestions. The authors would like to thank the ”Pole Regional Genie des Procedes” (Picardie, France) for providing the financial support. Authors also thank Dr. N.S. Pivovarova and Dr. A.B. Jemai for their help with preparation of the manuscript.
References
Alvarez, I., Raso, J., Palop, A., Sala, F. J., 2000. Influence of different factors on the inactivation of Salmonella senftenberg by pulsed electric fields. International Journal of Food Microbiology 55, 143-146.
Alvarez, I., Pagan, R, Raso, J, Condon, S., 2002. Pulsed electric field inactivation of Listeria monocytogenes described by the Weibull distribution. In: Cano, M. P., Morante P. (Eds.), EMERTEC 2002, Symposium on Emerging Technologies for the Food Industry. Madrid, Spain 11-13 March 2002, p. 116.
Barbosa-Canovas, G.V., G ngora-Nieto, M.M., Pothakamury, U.R., Swanson, B.G., 1998. Preservation of foods with pulsed electric fields. Academic Press, London.
Barsotti, L., Cheftel, J.C., 1998. Traitement des aliments par champs electriques pulses. Science des Aliments 18, 584-601.
Bergey, L., 1986. Manual of systematic bacteriology. Williams and Wilkins, Baltimore.
Harding, H., 1975. Effect of pH and sucrose concentration on conidium size and septation in four Bipolaris species. Canadian Journal of Botany 53, 1457-1464.
Hulsheger, H., Potel, J., Niemann, E.G., 1983. Electric field effects on bacteria and yeast cells. Radiat. Environ. Biophys. 22, 149-162.
Kotnik, T., Miklavcic D., Slivnik, T., 1998. Time course of transmembrane voltage induced by time-varying electric fields: a method for theoretical analysis and its application. Bioelectrochemistry and Bioenergetics 45, 3-16.
Lebedeva, N.E., 1987. Electric breakdown of bilayer lipid membranes at short times of voltage effect. Biologicheskiye Membrany, 4 , 994-998 (in Russian).
Peleg, M., 1995. A model of microbial survival after exposure to pulsed electric fields. Journal of the Science of Food and Agriculture 67, 93-99.
Peleg, M., 1996. Evaluation of the Fermi equation as a model of doze response curves. Applied Microbiology and Biotechnology 46, 303-306.
Peleg, M., 1999. On calculating sterility in thermal and non-thermal preservation methods. Food Research International 32, 271-278.
Reponen, T., 1995 Aerodynamic diameters and respiratory deposition estimates of viable fungal particles in mold problem dwellings. Aerosol Science and Technology 22, 11-23.
Schwan, H. P., 1957. Electrical properties of tissue and cell suspensions. In: Lawrence, J. H., Tobias, A. (Eds.), Advances in biological and medical physics, vol. 5. Academic Press, New York, pp. 147-209.
van Boekel, M.A.J.S., 2002. On the use of the Weibull model to describe thermal inactivation of microbial vegetative cells. International Journal of Food Microbiology 74, 139-159.
Weaver, J.C., Chizmadzhev, Y.A., 1996. Theory of electroporation: a review. Bioelectrochemistry and Bioenergetics 41, 135-160.
Wouters, P. C., Smelt, J.P.P.M., 1997. Inactivation of microorganisms with pulsed electric fields: Potential for food preservation. Food Biotechnology 11, 193-229.