Electric field-controlled water permeation coupled to ion transport through a nanopore
Abstract
We report Molecular Dynamics (MD) simulations of a generic hydrophobic nanopore connecting two reservoirs which are initially at different Na+ concentrations, as in a biological cell. The nanopore is impermeable to water under equilibrium conditions, but the strong electric field caused by the ionic concentration gradient drives water molecules in. The density and structure of water in the pore are highly field dependent. In a typical simulation run, we observe a succession of cation passages through the pore, characterized by approximately bulk mobility. These ion passages reduce the electric field, until the pore empties of water and closes to further ion transport, thus providing a possible mechanism for biological ion channel gating.
pacs:
61.20.Ja, 68.08.Bc, 87.16.Ac, 87.16.UvWater and ion permeation of nanopores is a key issue for biological membrane-spanning ion channels and aquaporins, as well as for materials like zeolites, gels and carbon nanotubes. Recent simulations report intermittent filling of hydrophobic nanopores by water under equilibrium conditions hummer:nature ; beckstein:jpc ; allen:prl . However, imbalances in ion concentrations in the inside and outside of cell membranes create strong electric fields hille . Experiments on water near interfaces show that strong fields can induce considerable electrostriction of water toney:nature . The nonequilibrium behavior of confined water and ions in strong fields should therefore be very important for ion permeation and ion channel function. In particular, biological ion channels “open” and “close” to ion transport in response to changes in the electric field across the membrane. This behavior, know as voltage gating, is crucial to their function, but its mechanism is so far not well understood hille . Related approaches kuyucak:2001 to ion transport include the application of a uniform external electric field crozier:prl ; chung:2002 , more specific models of particular proteins berneche:nature ; tieleman:2001 ; roux:1994 ; lopez:2002 , Brownian Dynamics chung:2002 and continuum theories nonner:1998 . Here we present the results of MD simulations in which a strong electric field across the pore is explicitly created by an ionic charge imbalance, as in a cell. We follow the relaxation of this nonequilibrium system to equilibrium.
Our generic model ion channel consists of a cylindrical hydrophobic pore of length Å and radius to Å, through a membrane slab which separates two reservoirs containing water and Na+ and Cl- ions, as shown in Fig. 1. One reservoir has initial concentrations M (12 cations) and M (8 anions), while for the second reservoir, M (4 cations) and M (8 anions). This imbalance of charge generates an average electric field of V/Å across the membrane. These ion concentrations and electric field are typically five times larger than under ”normal“ physiological conditions, but they could be achieved in the course of a rare, large fluctuation at the pore entrance. The enhanced ion concentrations in the initial state were chosen to improve the signal-to-noise ratio in the simulation and to allow the detection of novel transport mechanisms. The chosen pore dimensions are comparable to those of the selectivity filter of a K+ channel zhou:nature ; berneche:nature .
The simulation cell contains two pores in sequence along the z-axis, one of which is shown in Fig.1. The reservoir to the right of this pore thus forms the left reservoir for the other pore. Due to periodic boundary conditions, the right reservoir of the latter is also the left reservoir of the first. In this arrangement, the simplest to allow the use of full three-dimensional periodic boundaries, the flows of ions in response to the concentration gradient will be anti-parallel in the two channels. The relaxation towards equilibrium, where the two reservoirs are individually electroneutral, will thus involve an indirect coupling between the two pores.
The water molecules are modelled by the SPC/E potential berendsen:jpc which consists of an O atom, carrying an electric charge e, and two H atoms with e. The O-atoms on different water molecules interact via a Lennard-Jones (LJ) potential with parameters kJmol-1 and Å . The model is rigid, with OH bond length Å and HOH angle . The Na+ ions have LJ parameters kJmol-1, Å and e and for the Cl-, kJmol-1, Å and e spohr:1999 .
Ions and water O-atoms interact with the confining pore and membrane surfaces by a potential of the LJ form , where is the orthogonal distance from the nearest confining surface. The potential parameters are kJmol and Å . If is the geometric radius of the cylindrical pore, one may conveniently define an effective radius by the radial distance from the cylinder axis at which the interaction energy of a water O-atom with the confining surface is , leading at room temperature to Å ; similarly the effective length of the pore is Å . Ion-water, ion-ion, water-surface and ion-surface cross terms are defined using the usual Lorentz-Berthelot combining rules. Polarizability of the membrane allen:jpcm and of the water molecules and ions is neglected.
The total simulation cell including both of the channels is of dimensions Å and Å and contains 1374 water molecules, 16 Na+ and 16 Cl- ions. Molecular Dynamics simulations were carried out with the DLPOLY2 package dlpoly , using the Verlet algorithm frenkelsmit ; allen with a timestep of 2fs. The pressure was maintained at bar and the temperature at K using a Berendsen barostat and thermostat berendsen:jcp . Electrostatic interactions were calculated using the particle-mesh Ewald method essmann:jcp .
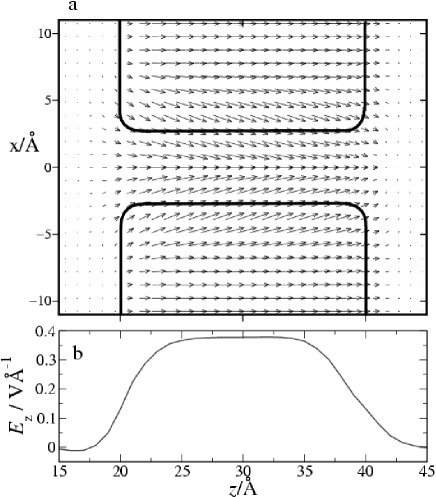
Water permeation of the pore is strongly affected by the electric field. The effective channel radius chosen for most of the simulations (Å) is such that under equilibrium conditions (i.e. with equal numbers of anions and cations on both sides and hence no electric field), the channel is empty of water and ions hille . However, the ionic charge imbalance across the the membrane causes the pore to fill spontaneously with water. The electric field throughout the system was monitored by measuring the electrostatic force on phantom test particles on a three dimensional grid crozier:prl . Fig. 2a shows the average local electric field around one pore before the first ion moves through a channel. It is nearly zero in the reservoirs. Inside the pore the field is very strong (V/Å) and has a small inward radial component. The profile of the -component of the field is shown in Fig. 2b and is constant inside the pore.
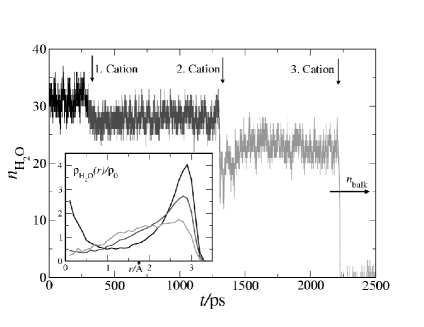
During the course of the simulation, a number of Na+ ions move through the pore. Each of these events changes the reservoir charge imbalance and reduces the electric field in the pore. This has a dramatic effect on the behavior of the water, as shown in Fig. 3 in which the number of water molecules inside one pore is plotted as a function of time for a typical simulation run.
Initially, the water in the pore undergoes strong electrostriction, comparable to experimental observations toney:nature , with an average density
| (1) |
twice as large as that of bulk water in equilibrium. If we assume bulk density of water inside a channel of radius and length we expect an average number of molecules inside the channel with
| (2) |
is indicated with an arrow on the right-hand side in Fig. 3. At each ion crossing, the number of water molecules inside the pore drops but is still larger than . In this particular simulation run shown in Fig.3 three cations went through this pore. After the third ion crosses (ns), the electric field is no longer strong enough to sustain channel filling and the pore spontaneously empties of water, thereby becoming impermeable to further ion transport. However the other pore in the simulation cell remains filled and the final ion crossing eventually occurs through this pore which after that also empties of water. Finally equilibrium is restored to the system and both channels are empty of water. On repeating the simulation 5 times we observe that the closing of one pore after the third ion passed through it occurs in all runs.
The structure of water in the filled pore is strongly affected by the field, as shown in the inset of Fig. 3. Before the first ion crossing, water forms clear layers near the pore wall and along the z-axis. The central layer disappears after the first ion crossing and the outer layer becomes less well-defined. After a further ion crossing, water is more-or-less evenly distributed.
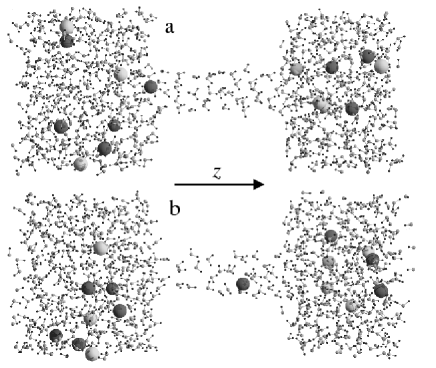
Ion transport through the pore is found to occur essentially at constant velocity. Fig. 1 shows snapshots from a typical simulation run just before (a) and while (b) a sodium ion passes through the channel. Within the reservoirs the anions and cations diffuse among the water molecules. When a cation in the Na+-rich reservoir comes close to the channel entrance, it experiences the strong axial field shown in Fig. 2 and is dragged into the channel. Analysis of simulation runs, with the same initial charge imbalance but different initial configurations, shows that once the first ion enters the channel, it moves with a constant velocity which is approximately the same in all runs, and then reverts to diffusive motion at the other end of the channel.
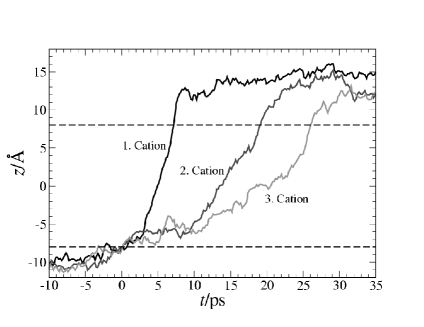
Fig. 4 shows typical cation positions along the z-axis, as a function of time, for the first, second and third ion crossings, as shown in Fig. 3. The second ion also traverses the channel at constant, somewhat reduced velocity, although it appears to pause for approximately 10ps at the channel entrance, perhaps in order to shed its bulk-like solvation shell. We observe that this “pausing time” is rather widely distributed between simulation runs. The cation mobility , defined by , can be calculated from the slopes of the trajectories in Fig. 4, together with the measured electric fields, as in Fig.2. The resulting values are for the first ion, for the second ion, and for the third ion. These values are close to the value of obtained from the self-diffusion constant in the reservoir , using Einstein’s relation , but seem to increase with the magnitude of the electric field inside the pore. This enhancement of the mobility correlates with the change of structure of the water inside the channel, shown in the inset of Fig. 3. The tetrahedral hydrogen bond network which water forms under equilibrium conditions is disrupted inside the pore under high electric fields.
Simulations of wider (Å) pores and with different lengths give qualitatively the same results. The critical electric field for water permeation is, however, sensitive to the pore radius and length. This suggests that voltage-dependent gating in ion channels, if it were to occur by changes in water permeation of a hydrophobic section of the pore allen:prl ; hille , might be strongly dependent on channel geometry.
The key finding which emerges from our simulations is the strong correlation between water and ion behavior under non-equilibrium conditions. Ionic charge imbalance across the membrane induces water permeation of the hydrophobic pore and thus makes it permeable to ions. This suggests that voltage gating of ion channels may be linked to the coupling between water and ion permeation in pores far from equilibrium. The structure and density of water in the pore is dramatically affected by the strong electric field. The passage of a cation through the channel causes an abrupt jump of the electric field, and an ensuing jump in the number of water molecules inside the pore. Ion passage through the pore occurs at constant velocity and with a mobility coefficient similar to that of the bulk solution at equilibrium.
Acknowledgements.
The authors are grateful to Jane Clarke and Michele Vendruscolo for a careful reading of the manuscript. This work was supported in part by the EPSRC. R. J. A. is grateful to Unilever for a Case award.References
- (1) G. Hummer, J. C. Rasaih, and J. P. Nowortya, Nature 414, 188 (2001).
- (2) O. Beckstein, P. C. Biggin, and M. S. P. Sansom, J. Phys. Chem. 105, 12902 (2001).
- (3) R. Allen, S. Melchionna, and J.-P. Hansen, Phys. Rev. Lett. 89, 175502 (2002).
- (4) B. Hille, Ionic Channels of Excitable Membranes (Sinauer, 1992).
- (5) M. Toney, Nature 368, 444 (1994).
- (6) S. Kuyucak, O. S. Andersen, and S.-H. Chung, Rep. Prog. Phys. 64, 1427 (2001).
- (7) P. S. Crozier, R. L. Rowley, N. B. Holladay, D. Henderson, and D. D. Busath, Phys. Rev. Lett. 86, 2467 (2001).
- (8) S.-H. Chung, T. W. Allen, and S. Kuyucak, Biophys. J. 83, 262 (2002).
- (9) S. Berneche and B. Roux, Nature 414, 73 (2001).
- (10) D. P. Tieleman, P. C. Biggin, G. R. Smith, and M. S. P. Sansom, Quart. Rev. Biophys. 34, 473 (2001).
- (11) B. Roux and M. Karplus, Ann. Rev. Biophys. Biomol. Str. 23, 731 (1994).
- (12) C. F. Lopez, M. Montal, J. Blasie, M. L. Klein, and P. B. Moore, Biophys. J. 83, 1259 (2002).
- (13) W. Nonner and B. Eisenberg, Biophys. J. 75, 1287 (1998).
- (14) Y. Zhou, J. M. Morais-Cabral, A. Kaufman, and R. MacKinnon, Nature 414, 43 (2001).
- (15) H. J. C. Berendsen, J. R. Grigera, and T. P. Straatsma, J. Phys. Chem. 91, 6269 (1987).
- (16) E. Spohr, Electrochim. Acta 44, 1697 (1999).
- (17) R. Allen, J.-P. Hansen, and S. Melchionna, J. Phys.: Condens. Matt. 15, 5297 (2003).
- (18) W. Smith and T. R. Forester (1999), the DLPOLY_2 User Manual.
- (19) D. Frenkel and B. Smit, Understanding Molecular Simulation: From Algorithms to Applications (Academic Press, 1996).
- (20) M. P. Allen and D. J. Tildesley, Computer Simulation of Liquids (Clarendon Press, 1987).
- (21) H. J. C. Berendsen, J. P. M. Postma, W. F. V. Gunsteren, A. DiNola, and J. R. Haak, J. Chem. Phys. 81, 3684 (1984).
- (22) U. Essmann, L. Perera, M. L. Berkowitz, T. Darden, and H. L. L. G. Pedersen, J. Chem. Phys. 103, 8577 (1995).