STUDY OF NEAR-FIELD VIBRATION SOURCES FOR THE NLC LINAC COMPONENTS
Abstract
The vibration stability requirements for the Next Linear Collider (NLC) are far more stringent than for the previous generation of Colliders. To meet these goals, it is imperative that the effects of vibration on NLC Linac components from near-field sources (e.g. compressors, high vacuum equipment, klystrons, modulators, pumps, fans, etc) be well understood. The civil construction method, whether cut-and-cover or parallel bored tunnels, can determine the proximity and possible isolation of noise sources. This paper presents a brief summary and analysis of recently completed and planned studies for characterization of near-field vibration sources under either construction method. The results of in-situ vibration measurements will also be included.
1 Introduction
To maintain the desired luminosity of the NLC, the focusing components on the main Linac must be kept at a few nanometers above a few Hz. These components can be affected by far-field (natural) and near-field (man-made) vibration sources. This paper is concerned only with near-field sources (e.g. mechanical and electrical equipment, RF generating equipment, etc). These sources are mainly located either in the Support tunnel, Fig.1, or far away ( 100 m) from the Beam tunnel. The characterization of near-field vibration sources and its effects on the main Linac components is part of an ongoing R&D program at NLC that is presented in this paper. The first part of the paper will present the influence of the vibration induced by RF power generating elements and by the RF itself. The second part will deal with the transfer of vibration from surface to the tunnel invert.
2 RF Vibration Characterization
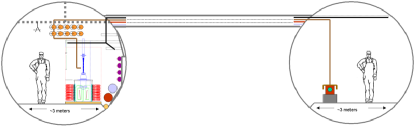
At first, we will focus on the vibration contribution of high power generating RF components. The study was carried out near the supporting structure of the 8 pack project [1]. The 8 pack project is the test bench of klystrons and their modulator to produce high power RF for the Next Linear Collider Test Accelerator (NLCTA). One of the geophone sensors was placed at the base of the modulator at 76 cm above the concrete floor and the second one was located on the concrete floor at 1.2 m away from the base of the modulator support, or at its base (0 m). The signals of the Mark-4 geophones were measured simultaneously.
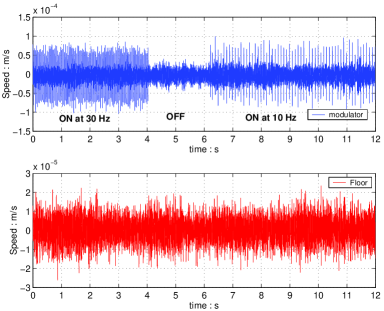
We performed tests in two different conditions of the modulator. In the first case, the water cooled modulator was under a 20 kV voltage and was running at 30 Hz or 10 Hz (at this voltage the klystrons was not conducting, thus did not deliver RF power). In the second case the modulator was running at 10 Hz and was under 400 kV (the klystron was delivering 40 MW of RF power at 1.6 s).
Fig.2 shows the response of the sensors vs times for the modulator under a 20 kV. In this case the modulator was running at different frequencies. The seismometer located at the base of the modulator clearly shows vibrations due to modulator pulsed operation, while the geophone located on the concrete floor does not indicate any change due to the modulator running conditions.
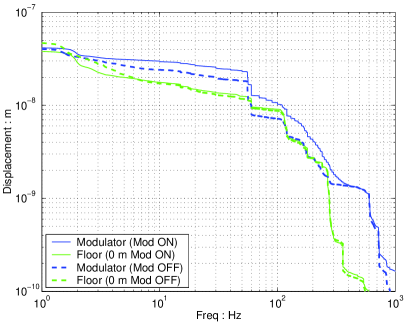
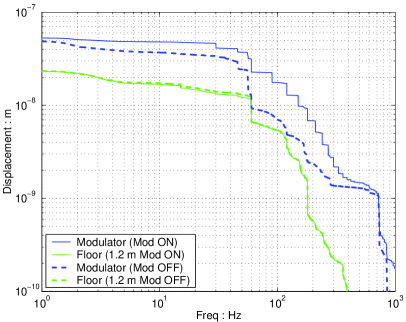
Fourier analysis also does not reveal any additional noises due to modulator on the floor. Fig.3 and Fig.4 show the average integrated displacement (AID) of the two seismometers. The blue lines are the response of the sensor placed at the base of the modulator, where the difference between the modulator on and off cases is clearly seen. The green lines are the response of the sensor placed on the concrete floor either at 1.2 m or at the base of the stand (0 m), and the on and off cases overlap.
Interesting that, when the modulator is under 400 kV and delivering power to the klystron, its vibration is slightly less than for a 20 kV running modulator. One can also note that background noise was different in the conditions of Fig.3 and Fig.4 (see green curves below 60 Hz) which was due to different level of activity of the construction crew working at NLCTA.
The main conclusion of the modulator vibration study is that the transmission of vibration from the modulator to the concrete floor is not significant, and, on the level of background noise at NLCTA, not noticeable.
We also studied vibrations of accelerating structures due to cooling water (reported earlier, see [2]), and due to RF pulse (presented below). When the klystrons are delivering power, the RF heating produces acoustical vibration in the accelerating structure. Possible vibration produced by the RF were measured by 3 piezo-accelerometers placed on the accelerating travelling wave structure bolted on its support or girder, placed on the girder, and placed on the waveguide. The X-rays coming out from the structure when filled by the RF did not affect the measurements of our accelerometers.
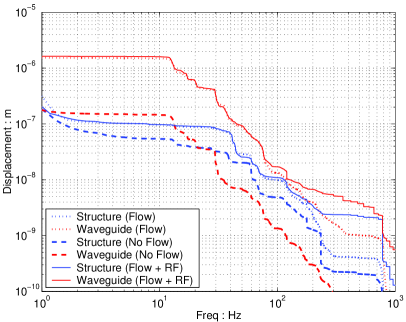
These measurements, Fig.5, show that feeding a structure (60 cm long travelling wave structure H60Vg3R), via its waveguide, with 100 MW at 400 ns of RF power at 60 Hz (corresponded to about 70 MV/m accelerating gradient) does not lead to any significant increase of vibration in comparison to vibrations produced by cooling water. The water induced vibrations dominate, but they are tolerable, since, with an appropriate design, the vibration transmission to the linac quadrupoles is rather small [2]. Vibration of the loosely supported RF waveguide is higher than of the RF structure, but apparently this does not significantly increase vibration of either structure or the quadrupoles.
3 Vibration transfer from surface to beam tunnel
One of the questions to be addressed is whether there is a significant difference in the vibration attenuation characteristics between a tunnel bored at great depth (in bedrock) or excavated in cut-and-cover construction at lesser depth, with regard to vibrations generated at the surface. A study was carried out at SLAC [3], representing the vibration attenuation characteristics of the soil, assuming the SLAC beam line housing to be representative of a cut-and-cover construction. The second vibration measurement study is currently underway in the Red Line tunnels in Los Angeles. This study will establish the vibration characteristics between two tunnels, along the tunnel as well as from surface to the tunnel. The following is a brief presentation of data from the study carried out at SLAC.
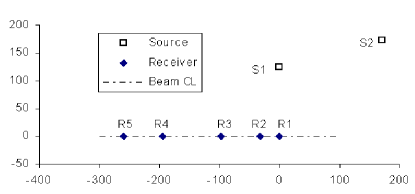
Fig.6 shows the relative locations of sources and the receivers. The receivers locations were on the floor along the centerline of the beam. The sources were on the ground surface. Drive location S1 was at the same approximate elevation as of the Klystron gallery floor, which lies about 36 ft ( 11 m) above the elevation of the receiver locations. Drive location S2 was about 10 ft ( 3 m) uphill from S1.
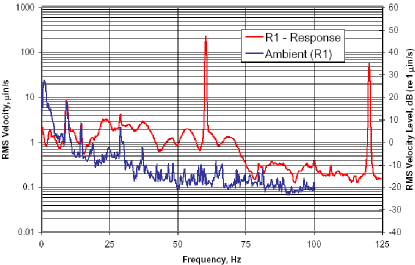
Fig.7 shows two spectra. One is the ambient measured at the receiver location R1. The other is a fast Fourier transform of the response to several hammer blows. Several observations may be made. The peaks at 60 Hz and 120 Hz are electronic artefacts. The peaks centered at 8.75 Hz and at 14.25 Hz in both ambient and response have a nearly identical amplitudes. The peak at 18.75 Hz has a slightly different amplitude. At these frequencies, the “response” (red line) is being governed more by ambient than by the input force, so the transfer functions derived from the “response” will be invalid. The “ambient” (blue line) at frequencies less than 7 Hz (in this case) lies above the “response”. This suggests that there is some variability to the ambient environment at these low frequencies, and these will degrade the accuracy of transmission function at lower frequencies.
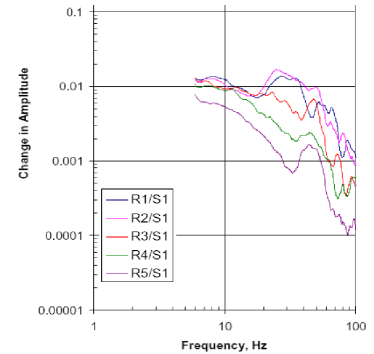
Fig.8 shows a smoothed spectra which were calculated by log averaging the amplitudes over a 10 Hz interval centered on the plotted point. It provides the transfer function (showing change of amplitude) measured at R1 to R5 using S1 as a drive point, Fig.6.
| Source (S1) to | Attenuation at Given Frequency | |||
| Receiver(m) | 10 Hz | 20 Hz | 30 Hz | 60 Hz |
| R1(39) | 0.024 | 0.0084 | 0.012 | 0.005 |
| R2(40.2) | 0.012 | 0.012 | 0.014 | 0.004 |
| R3(48.6) | 0.011 | 0.0084 | 0.006 | 0.001 |
| R4(69.9) | 0.010 | 0.004 | 0.002 | 0.001 |
| R5(86.7) | 0.005 | 0.002 | 0.0009 | 0.0003 |
The Table 1 summarizes the apparent attenuation at several frequencies at which mechanical equipment usually operates. The figures in Table 1 represent the attenuation factor A for a vibration with its source near S1 propagating along the same path. Let us give an example how such data can be used. Suppose a pump is installed at S1, and it produces vibrations at 30 Hz of amplitude X. The amplitude at 30 Hz that we would measure at R5 would be the greater of either ambient or 0.0009X. Suppose we take the ambient measured shown for the tunnel in (Fig.7) as representative the tunnel in general. The amplitude at 30 Hz is about 1.5 m/s. If we were to place a pump at S1 and be sure to avoid having its vibrations exceed ambient at R5, we would need to impose a limit on the resulting vibration at S1 of 1.5/0.0009=1.7 mm/s.
4 Conclusion
It has been shown that the vibration transmitted by the RF generating equipment to the floor is insignificant. Hence, klystrons and or modulators running in the Support tunnel of the NLC should not effect alignment of the Linac. Vibration contribution of an RF pulse to an accelerating structure has also been found negligible relative to water-cooling. Thus, it leaves electrical and mechanical rotating equipment as possibly a dominating source of vibration. The attenuation factors presented in the paper can be used in planning stage of the NLC project for specifying and locating the mechanical rotating equipment, as well as to assess their vibration effects on the focusing components on the Main Linac and provide a means for establishing the vibration budgeting scheme for the project.
References
-
[1]
http://www-project.slac.stanford.edu/lc/local/Projects/
8Pack/8Pack.html.
-
[2]
F. Le Pimpec et al.
In Nanobeam, Lausanne (CH), 2002.
SLAC-PUB-9558 .
- [3] http://www-project.slac.stanford.edu/lc/ilc/TechNotes/ LCCNotes/PDF/LCC-0115.pdf.