Also at P.N. Lebedev Physics Institute, Moscow, Russia] Also at D.I. Mendeleev Institute for Metrology, St. Petersburg, Russia] Also at Ludwig-Maximilians-University, Munich, Germany]
High-Precision Optical Measurement of the 2S Hyperfine Interval in Atomic Hydrogen
Abstract
We have applied an optical method to the measurement of the hyperfine interval in atomic hydrogen. The interval has been measured by means of two-photon spectroscopy of the transition on a hydrogen atomic beam shielded from external magnetic fields. The measured value of the hyperfine interval is equal to Hz and represents the most precise measurement of this interval to date. The theoretical evaluation of the specific combination of and hyperfine intervals is in moderately good agreement with the value for deduced from our measurement.
pacs:
12.20.Fv, 32.10.Fn, 32.30.Jc, 42.62.FiThe frequency of the hyperfine interval has been measured twice during the last 50 years by driving the magnetic-dipole radio-frequency transition in a hydrogen thermal beam Kusch ; Hessels . The relative accuracy of these measurements ( ppb) exceeds the accuracy of the theoretical prediction for the hyperfine interval which is restricted by an insufficient knowledge of the proton structure. However, the specific combination of the and hyperfine intervals
| (1) |
can be calculated with high precision due to significant cancellations of nuclear structure effects (see Karsh1 and references therein). As the hyperfine splitting in hydrogen , known experimentally to several parts in (see e.g. Ramsey ), does not restrict the accuracy of (1), it is possible to compare the experimentally measured hyperfine interval with deduced from the theoretical value. The quantum-electrodynamics theory (QED) for the state-dependent contribution to the hyperfine splitting can thus be tested to the level up to and . This test is limited only by the experimental uncertainty.
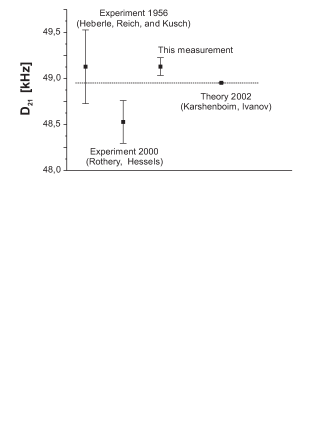
The recent theoretical value of is equal to Hz and corresponds to a hyperfine interval of Hz Karsh1 . In 1956 Heberle, Reich, and Kusch measured for the first time Kusch . Their result was equal to Hz which is in an agreement with . In 2000 Rothery and Hessels Hessels improved the accuracy and obtained the value of Hz. We have performed a totally independent optical measurement of . The result of our measurement is Hz which is up to now the most precise value for the hyperfine interval in atomic hydrogen. Both recent results are in a moderately good agreement (within ) with the theoretical value.
For the measurement of the hyperfine interval in atomic hydrogen we have applied two-photon spectroscopy to a cold hydrogen atomic beam which is shielded from magnetic fields. Using a high-finesse cavity as a frequency flywheel we deduce the hyperfine interval as the frequency difference between two extremely stable laser light fields which excite the respective transitions between the different hyperfine sublevels of the and states in atomic hydrogen. The differential measurement cancels some important systematic effects typical for two-photon spectroscopy on atomic beams. Applying this optical method, we achieve a level of accuracy which is nearly 2 times better than the accuracy of the recent radio-frequency measurement Hessels . Along with the previous optical Lamb shift measurement Hbook , our present measurement demonstrates the perspectives of precision optical methods in fields where traditionally radio-frequency techniques have been used.
The hydrogen spectrometer setup, described in detail elsewhere Huber , has been modified by magnetic compensation and shielding systems and an optional differential pumping system Fischer . A dye laser operating near 486 nm is locked to an ultra-stable reference cavity made from ULE by means of the Pound-Drever-Hall lock. The drift of the cavity, suspended in a vacuum chamber with a two-stage active temperature stabilization system, is typically 0.5 Hz/s.
The frequency of the dye laser light is doubled in a -barium borate crystal, and the resulting UV radiation near 243 nm is coupled into a linear enhancement cavity inside a vacuum chamber. Atomic hydrogen, produced in a radio-frequency discharge at a pressure of around 1 mbar, flows through teflon tubes to a copper nozzle cooled to 5 K with a helium flow-through cryostat. Hydrogen atoms thermalize in inelastic collisions with the cold walls of the nozzle. The atomic beam escapes from the nozzle coaxially to the mode of the enhancement cavity. On their way through the laser field some atoms are excited via Doppler-free two-photon absorption from the ground state to the metastable state. In the detection region, these atoms are quenched in a small electric field and emit Lyman- photons which are counted by a photomultiplier. Slow atoms are selected by time resolved spectroscopy Huber so that the second-order Doppler shift and the time-of-flight broadening are reduced, yielding typical linewidths around 2 kHz at 121 nm both for the (singlet) and (triplet) transition lines.
A turbo pump evacuates the main volume of the vacuum system to mbar. The excitation region, separated from the main volume by a non-magnetic metal housing, is differentially pumped by a large cryopump. Two small holes in the front and back walls of the housing allow the excitation light to enter and exit this high vacuum zone and collimate the atomic beam. With hydrogen atoms escaping from the cold nozzle, the pressure in the excitation region is typically 3 mbar. An additional lockable opening in the housing allows to measure at a worse pressure of mbar. By increasing the temperature of the cryopump, it is also possible to work at even higher pressures up to mbar. All parts adjacent to the hydrogen beam are covered with graphite to reduce stray electric fields in the excitation region which would quench the hydrogen population and shift the transition frequencies due to the DC Stark effect.
To reduce the magnetic field along the excitation region we use a two-stage magnetic shielding setup together with external compensation coils. We have measured the residual field inside the first shielding stage made from 100 m thin -metal foil which encloses the entire excitation region, the detector, and the nozzle to be less than 20 mG. Inside this shielding, 1 mm thick -metal tubes located along the enhancement cavity axis cover about 90% of the whole excitation path of the hydrogen atoms. The evaluated averaged shielding factor of the second shielding stage is more than 20.
An external magnetic field shifts the magnetic sublevels of the hydrogen and states according to the Breit-Rabi equation Bethe . For two-photon processes, allowed transitions obey the selection rules and . In our experiment, we excite two-photon transitions from different magnetic sublevels of the hydrogen ground state to corresponding sublevels of the state. In small magnetic fields, when the triplet splitting vanishes, the 2S hyperfine interval is given by
| (2) |
where the symbol denotes the transition frequency between sublevels with quantum numbers and at 121 nm. A magnetic field shifts approximately as kHz/.
The dye laser is locked to a TEM00 mode of the reference cavity. Its frequency can be changed by means of a double-passed broadband AOM placed between the laser and the cavity. The frequency shift corresponding to 121 nm is 8 times higher in absolute value than the frequency shift of the synthesizer driving the AOM. The factor 8 arises due to the double-passed AOM, the optical frequency doubling, and the two-photon excitation of the hydrogen atoms. The intensity of the light used to lock the laser to the reference cavity is stabilized. All synthesizers providing the radio frequencies in our experiment are locked to the 10 MHz signal of a commercial HP5071A cesium frequency standard (specified Allan standard deviation within one second). The standard introduces a negligible error to the measured value.
During 16 days of measurements we have recorded about 2000 hydrogen spectra for the triplet and singlet transitions. A single spectrum consists of about 30 data points, each measured for 1 second. For our fitting procedure we have chosen the spectra recorded at a delay time of s (time between the blocking of the excitation light and the start of photon counting), for which the spectrum asymmetry is considerably reduced. A typical count rate for the triplet transition in its maximum is 350, while the averaged ratio between triplet and singlet count rates is . We ascribe the deviance of this value from 3 to different recombination rates in the nozzle for hydrogen atoms in the singlet and triplet ground states.
One measurement run consists of hydrogen spectra recorded one after another within approximately 5 minutes. After each run, we change the frequency of the laser light to excite the other transition. During a measurement day, we have switched about 50 times between the triplet and singlet transitions. The intensity of the excitation light is monitored after the enhancement cavity and has been kept as constant as possible during the whole day of measurement.
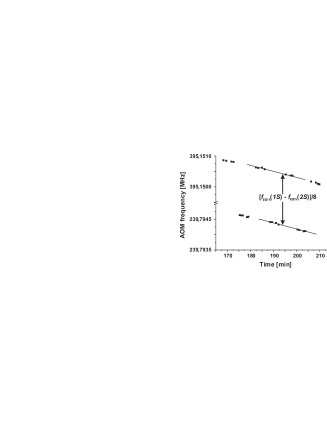
As the laser is locked to the same mode of the cavity, the cavity drift is the same for both singlet and triplet transitions. To determine the drift, we have fitted each hydrogen spectrum with a Lorentzian function in the time and frequency domains. A part of a day drift data set is shown on Fig.1. To reduce the effect of a nonlinear cavity drift, the drift data are fitted stepwise within the short time periods (about 20 minutes each) covering 2 singlet and 2 triplet runs. During this time period the drift can be well approximated linearly, and we have fitted the data by means of linear regression with the same slope. The fit procedure has been performed analytically delivering the slope (cavity drift), offset frequency, and corresponding errors. According to the hydrogen level scheme and the measurement technique, the offset frequency is equal to . From this, the hyperfine interval and the difference can be calculated using the precise experimental value for .
A numerical simulation of the two-photon excitation process in the hydrogen beam shows that the maximum of the excitation probability distribution for the delayed atoms is shifted in space towards the first half of the excitation region where the residual magnetic fields are the smallest. A conservative estimation of a shift arising from the less shielded paths in the direct vicinity of the nozzle and the detector gives a value of 0.5(0.5) Hz.
An external electric field mixes the 2 level with the adjacent 2 and 2 levels, shifting its energy. While in first order perturbation theory the level is not shifted in a DC electrical field, the and levels are shifted differently because of their different energy spacing from the levels. According to a calculation of the DC Stark shift with the hyperfine structure taken into consideration, the shift of the hyperfine interval is equal to Hz . The stray electrical fields within the excitation region of our setup are estimated to be below 30 mV/cm Huber corresponding to a shift of Hz.
The AC Stark shift of a two-photon transition scales inversely to the energy difference between real levels (in our case and levels) and virtual levels Beausoleil . The hyperfine intervals are on the order of one GHz, while virtual energy levels are about away from both and levels. Therefore, the differential AC Stark shift of the hyperfine components in the hydrogen atom is about of the AC Stark shift of the transition frequency. The typical AC Stark shift of the transition in our experiment is on the level of 500 Hz, corresponding to a negligible differential shift of the hyperfine interval assumed that the light intensity is kept constant.
However, inevitable small fluctuations of the 243 nm light intensity cause different AC Stark shifts of each hydrogen spectrum. We have corrected for the intensity fluctuations, using the experimental value of 2.6 Hz/mW for the AC Stark shift Niering , which shifts the final value of the interval by 2 Hz. Besides correction, we have added a conservative 2 Hz error to the error budget, which may arise from the evaluation of the light intensity circulating in the enhancement cavity.
Due to the second-order Doppler effect the measured line shape of the two-photon transition is not symmetric, and the line center is shifted. For both singlet and triplet transitions, the excited atoms are from the same atomic beam, and the same velocity class is selected by the precisely defined delay time. Therefore, the second-order Doppler effect cancels for the differential measurement of the hyperfine interval. We have evaluated different velocity classes of hydrogen atoms corresponding to different delay times and observe essentially no effect on the evaluated hyperfine interval. As an independent test we have fitted a theoretically simulated lineform for the delay time of s with a Lorentzian function and found that the possible error of the line center definition is less than 2 Hz. This error is also added to the error budget.
According to Jamieson , the interaction cross section for atomic hydrogen in the state is different for triplet and singlet states, and the pressure shift of the hyperfine interval is comparable to the pressure shift of the triplet level. The previous hyperfine interval measurement Hessels indicates for a pressure shift of MHz/mbar, which is of the same order of magnitude as the pressure shift of the transition in hydrogen which is MHz/mbar McIntyre ; Kleppner .
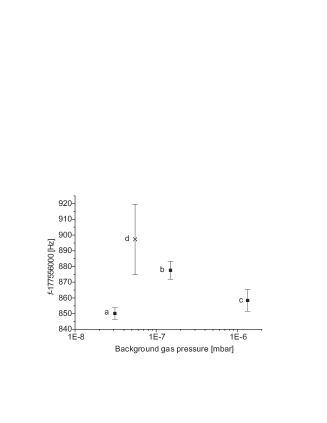
We have performed four sets of measurements at different background gas pressures. The data are plotted on Fig.2, each point representing an averaged result. Points a, b, c have been measured with approximately the same hydrogen flow through the nozzle, whereas point d is the result of a one day measurement with two times increased hydrogen flow. Within the available range of pressures, we observe no clear systematic dependence of the 2S hyperfine interval frequency on the background gas pressure. However, there is some scatter of the data. The estimated 2S triplet shift due to background gas pressure is MHz/mbar. In the final averaging of the data points a, b and c, we correct for such a shift, but add a conservative 10 Hz error to the error budget.
As mentioned above, we have measured for one day in the differential pumping configuration with the hydrogen flow increased 2 times (point d on Fig.2) to investigate the effect of a pressure shift in the hydrogen beam. Slow atoms interact more frequently with the rest of the beam than the atoms of average thermal velocity, therefore the pressure shift should be different for them. We have evaluated the hyperfine intervals for all delay times and find some non-systematic difference on the level of 5 Hz. Accounting for the worse statistics of this day of measurement, we have added an error of 10 Hz for the possible pressure shift in the hydrogen beam.
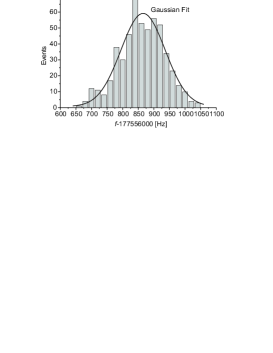
One of the main processes causing the data scattering is a nonlinear drift of the laser frequency on the time scale of 30 min. This process does not cancel in our fit procedure, and has to be averaged. During the 16 days of measurement the cavity drift can be considered as random and we expect no systematic shift due to it. Fig.3 represents the distribution of the hyperfine interval data without the data of point d. The distribution is symmetrical and can be approximated with a Gauss function of 140 Hz width. Statistical averaging yields a value for of Hz.
| Frequency [Hz] | Error [Hz] | |
|---|---|---|
| Averaged interval frequency | 177 556 860 | 3 |
| Residual magnetic fields | 0.5 | 0.5 |
| DC Stark shift | -1 | 1 |
| AC Stark shift | 0 | 2 |
| Lineshape effects | 0 | 2 |
| Pressure shift (background gas) | 0 | 10 |
| Pressure shift in the beam | 0 | 10 |
| final result | 177 556 860 | 15 |
The effects which contribute errors and shifts to the hyperfine interval in our measurement are summarized in Table 1. Fig.4 represents the values corresponding to the several hyperfine interval measurements in atomic hydrogen as well as the present theoretical value Karsh1 . The 15 Hz error, compared to the THz frequency of the interval, corresponds to the resolution of our system on the level. The error rivals the 20 Hz error of the radio-frequency hyperfine interval measurement in deuterium deuterium , which can also be performed optically.
Our current measurement along with other precision experiments on the hyperfine structure of and levels in hydrogen and ion Prior offers a test of QED on level of accuracy comparable to tests on pure leptonic atoms such a muonium and positronium Karsh1 .
The participation of N.K. in this work was supported by the Alexander von Humboldt-Stiftung. The work of S.G.K. was supported in part by RFBR grant # 03-02-16843. The authors wish to thank A. Pahl for calculations concerning the DC Stark effect and Eric Hessels for useful discussions.
References
- (1) J.W. Heberle, H.A. Reich, and P. Kusch, Phys. Rev. 101, 612 (1956)
- (2) N.E. Rothery and E.A. Hessels, Phys. Rev. A 61, 044501 (2000)
- (3) S.G. Karshenboim and V.G. Ivanov, Phys. Lett. B 524, 259 (2002); Euro. Phys. J. D 19, 13 (2002)
- (4) N. Ramsey. In: Quantum Electrodynamics, ed. by T. Kinoshita (World Scientific, Singapore 1990), p. 673; Hyp. Interactions 81, 97 (1993)
- (5) M. Niering et al., Phys. Rev. Lett. 84, 5496 (2000)
- (6) F. Biraben et al. In: The Hydrogen Atom. Precision Physics of Simple Atomic Systems, ed. by S.G. Karshenboim et al. (Springer, Berlin Heidelberg 2001), p. 17
- (7) A. Huber et al., Phys. Rev. A 59, 1844 (1999)
- (8) M. Fischer et al., Can. J. Phys. 80, 1225 (2002)
- (9) H.A. Bethe and E.E. Salpeter, Quantum Mechanics of One- and Two-Electron Atoms (Plenum, New York 1977), p. 216
- (10) R.G. Beausoleil and T.W. Hänsch, Phys. Rev. A 33, 1661 (1986)
- (11) D.H. McIntyre et al.,Phys. Rev. A 41, 4632 (1990)
- (12) Th. C. Killian et al., Phys. Rev. Lett. 81, 3807 (1998)
- (13) M. Jamieson, A. Dalgarno, and J.M. Doyle, Mol. Phys. 87, 817 (1996)
- (14) H. A. Reich, J. W. Heberle, and P. Kusch, Phys. Rev. 104, 1585 (1956).
- (15) M. H. Prior, E. C. Wang, Phys. Rev. A 16, 6, (1977)