Dynamics and Topological Aspects of a Reconstructed Two-Dimensional Foam Time Series Using Potts Model on a Pinned Lattice
Abstract
We discuss a method to reconstruct an approximate two-dimensional foam structure from an incomplete image using the extended Potts model on a pinned lattice. The initial information consists of the positions of the vertices only. We locate the centers of the bubbles using the Euclidean distance-map construction and assign at each vertex position a continuous pinning field with a potential falling off as . We nucleate a bubble at each center using the extended Potts model and let the structure evolve under the constraint of scaled target areas until the bubbles contact each other. The target area constraint and pinning centers prevent further coarsening. We then turn the area constraint off and let the edges relax to a minimum energy configuration. The result is a reconstructed structure very close to the simulation. We repeated this procedure for various stages of the coarsening of the same simulated foam and investigated the simulation and reconstruction dynamics, topology and area distribution, finding that they agreed to good accuracy.
keywords:
Foams , Image Reconstruction , Potts ModelPACS:
82.70.Rr , 07.05.Pj , 87.57.Gg, , and
1 Introduction
This paper addresses the reconstruction of domain boundaries from experimental images of foams, cellular images which consist of sets of compact domains separated from each other by sharp boundaries which meet at vertices. The data to be reconstructed contain only partial information, in particular the positions of vertices (two dimensions) or edges (three dimensions) in the complete image. This task, which is a special case of the problem of image segmentation, recurs in many fields, e.g. medical imaging and cartography [1, 2, 3]. An ISI Web of Science search reveals nearly 2000 references on image segmentation. Even when the image data is complete, a typical voxel image requires reconstruction to obtain information about domain shapes, volumes and adjacencies. In real images the presence of noise further complicates reconstruction [4].
The general reconstruction problem is underdetermined. Unless we supply further constraints, an arbitrary number of different domain patterns with different numbers of domains and domain area distributions can have the same set of vertices or edges. As a result, almost all reconstruction of three-dimensional foams has been manual, which is inconvenient and time consuming and greatly limits the numbers of bubbles which we can examine [6, 7, 8, 9, 10, 11, 12].
However, in the case of many domain patterns of real interest, e.g. metallic polycrystals, foams and biological cells, the patterns are well behaved in a manner which is clear to the eye, though difficult to quantify completely. For example, in two dimensions, boundaries meet at three-fold vertices at approximately 120∘ angles and are relatively smooth and constant in curvature. Many of these regularities, known as Plateau rules [5], result from the physical processes generating the domain boundaries: the presence of a surface tension or surface energy causes boundaries to be approximately minimal surfaces.
In these cases we can proceed quite far in reconstructing the complete two-dimensional pattern from the vertex positions and we present an algorithm that accomplishes this reconstruction with accuracy good enough for many practical purposes. The algorithm is attractive in that it uses a physical simulation of the development of minimal surfaces which in some sense duplicates the original formation of the pattern. One great advantage is that it works directly with real pixel-wise input data. We illustrate several pathological cases where the algorithm fails and discuss ways to fix these errors.
2 Motivation
Why do we need an algorithm that can reconstruct minimal surface partitions from vertex positions? Whole subfields of physics and mathematics have developed to study the structure of complex minimal surfaces (for a review see the web site of Kenneth Brakke and his program Surface Evolver at http://www.susqu.edu/facstaff/b/brakke/).
The division of space into subdomains with minimum partition area has attracted attention of scientists in fields ranging from Geography and Physics to Mathematics and Computer Science [13, 14]. The more restricted question of which geometric structure, replicated infinitely and filling space without leaving gaps, has minimum surface area, is known as the Kelvin Problem after Lord Kelvin who first proposed a solution in 1887 [15].
Dry liquid foams (i.e. foams in which the liquid fraction is below about 1%) are a good probe of the various proposed solutions to the Kelvin problem. The idealized model of a foam retains only the surface energy (proportional to the surface area) of the bubbles. Where bubbles contact each other, they form a cell face of negligible thickness. The bubble wall membranes bend, forming surfaces of constant mean curvature. The faces contact each other at edges known as Plateau borders where water accumulates and these edges in turn meet at Plateau vertices at the tetrahedral angle.
Foams also exhibit a complex dynamics in which gas passes from bubbles of higher pressure to lower pressure bubbles [16, 17]. Since smaller bubbles tend to have higher pressures because of geometric constraints, bubbles gradually disappear and the pattern coarsens [16, 17]. The same general phenomena with additional complications occur in metallic polycrystals, sintered ceramics, ferromagnets, micelles, ferrofluids and biological tissues and organs [16, 18, 19, 20]. Domain growth is a common feature of most of these patterns, though the time scales differ depending on the diffusion mechanisms controlling boundary motion. If the initial conditions are reasonably homogeneous, most of these materials develop geometrically similar structures [21]. Thus, understanding the kinetics and geometry of a coarsening foam can provide information on a broad class of important materials.
Unfortunately, determining the three-dimensional structure of a foam is surprisingly difficult. Foams scatter light extremely effectively, so seeing deep inside a liquid foam is difficult [22, 23]. Optical tomography is only possible for very dry foams, in which the Plateau borders but not the faces are visible [7, 8, 9, 10, 11, 12]. Magnetic resonance imaging (MRI) can also reveal a foam’s three-dimensional structure [24]. MRI measures the nuclear magnetic resonance (NMR) signal from protons in the hydrogen in the water present in the sample. However, since foams contain very little water, which mostly concentrates in the Plateau borders, the MRI signal is very weak and the best result we obtain is an image of the Plateau borders, which looks like a skeleton of the foam as in fig. 1. Recent synchrotron CT images provide higher quality images [25], but seeing the faces between bubbles remains effectively impossible.
The raw image is missing crucial information, e.g. the bubble volumes, because of the absence of the bubble membranes. The same problem can occur in confocal microscopy of cells, CT, MRI and ultrasound imaging of tissues and X-ray and neutron imaging of solids. An added difficulty is that the signal-to-noise ratio of such images is often close to one.
Reconstruction of foam structure from partial information is, then, essential to the study of cellular patterns. The concept underlying our reconstruction is energy minimization, in the sense that reconstructing the pattern is equivalent to finding the minimum energy partition consistent with the partial information available about the structure. Since the pattern itself results from constrained energy minimization, the use of an energy minimization method in reconstruction seems natural and appealing. In three dimensions, this partial information consists of a pixel image of the edges of bubbles (Plateau borders) and the reconstruction consists of finding the surfaces that connect the edges with minimum energy. In two dimensions, on the other hand, the corresponding partial data are the positions of the vertices of the domains and the reconstruction connects the vertices to obtain a minimum energy configuration. Although the results we present here concern two-dimensional reconstruction only, the method extends to three dimensions without major conceptual modifications.
We now summarize our method to reconstruct the two-dimensional structure starting solely from the positions of the vertices and our knowledge of minimal surfaces. Subsequent sections provide details and results. The method consists of three main independent steps:
-
•
Finding the centers of bubbles in the pattern to be reconstructed.
-
•
Reconstructing the pattern by nucleating a bubble from each center using the extended large- Potts Model.
-
•
Growing the nucleated bubbles until evolution stops.
Minimum distance maps provide the positions of the centers and the initial target areas (Each bubble receives a target area which we adjust during the simulations to achieve the minimum surface energy for each bubble) [26]. A continuous pinning field traps the moving bubble edges.
We employ this method to reconstruct several patterns from a foam evolution time series obtained from a coarsening simulation. In order to test the validity of our results, we perform a detailed analysis of the dynamics and spatial structure of the reconstructed foam and compare it with the simulation and theoretical and experimental results found in the literature.
3 The Potts Model
The Potts Model [27] is a generalization of the Ising model to more than two spin components. Although initially proposed to study critical phenomena in statistical physics, the Potts Model finds a wide variety of applications, including the simulation of metallic grain growth [28, 29, 30], soap foams [31, 32, 33], magnetic froths [34] and biological cells [35].
We map the foam structure onto a rectangular lattice containing sites. Each lattice site contains an integer (a spin) which corresponds to a particular bubble (number of bubbles = number of spins). The boundary between two bubbles is the set of links between lattice sites associated to the spins of those bubbles. The boundary energy associates a positive energy (equivalent to a surface tension) with boundary links and zero energy for links within bubbles.
Coarsening has two time scales. Surface tension and viscous dissipation determine the time, , which describes the relaxation of an edge towards equilibrium without volume (or area in two dimensions) variation. After a perturbation, the pattern returns to obeying the Plateau rules after a delay of . The second time scale, , depends mainly on gas permeability and foam polydispersity and controls the coarsening rate. In liquid foams is typically fractions of a second while is minutes or hours. In metals the two times are usually comparable, as they are in the simple Potts Model, so the foam only obeys Plateau’s rules approximately. Wejchert et al. [31] introduced an area constraint energy term to simulate equilibration in a foam, where boundary equilibration is much faster than diffusion. If we constrain the area for a fixed number of Monte Carlo steps (mcs as defined below) per volume diffusion step we can choose any ratio we like between the time scales.
The Hamiltonian including surface energy and the area constraint has the general form:
| (1) |
The first term in eq. 1 accounts for the surface energy. The sum in runs over all the sites in the lattice and the sum in runs over sites neighboring . The parameter sets the energy/unit surface area. The second term is the area constraint. The sum in runs over all the bubbles in the pattern. is a parameter specifying the strength of the area constraint, the current area of the bubble, and the target area of the same bubble. Because of the surface energy, each bubble’s area is usually smaller than its target area.
Most Potts simulation use a modified Metropolis Monte Carlo dynamics [36] in which we select a boundary lattice site at random and randomly propose to change its spin to the value of one of the neighboring spins (Kawasaki dynamics [37] and Glauber dynamics [38] are also possible). If the resulting change of energy is less than or equal to zero, we accept the new spin configuration. However, if the change in energy is positive, we accept the new configuration with Boltzmann probability:
| (2) |
where is the temperature assigned to allows for thermal fluctuations to overcome local energy minima. We define a Monte Carlo step as a sequence of random site selections.
4 Generation of the input data
We may use any experimental picture of a two-dimensional foam as input data, once we know the vertex positions. To compare the statistical properties of the reconstructed foam to those of the original foam, we need a controlled series of well characterized foam structures. To develop and test our reconstruction procedures, we generate two-dimensional foam structures at different stages of a coarsening evolution using the Large-Q Potts Model [32].
The Hamiltonian contains the surface term only:
| (3) |
The sum ranges up to third-nearest neighbors, or 20 sites around the site. In our simulation . In order to minimize finite size and edge effects we use a square lattice with periodic boundary conditions. We start the simulations with square bubbles and finish with just a few tens of bubbles.
We performed the main part of the numerical simulation at . However, in order to overcome metastable traps, we periodically increased the temperature for short periods during the simulation, alternating 40 mcs at temperature (relaxation period) with 5 mcs at (fluctuation period). This method produces very realistic foam structures [32]. Thus the Potts Model basis of both original and reconstructed structures does not bias our error estimates.
5 Pinning Field
Our inspiration for a continuous attractive pinning field to keep vertices fixed comes from Zener pins [39, 40, 41, 42, 43, 44], which simulate the microstructural evolution of materials in the presence of a second phase dispersion of particles. The presence of insoluble precipitates inhibits grain growth, greatly affecting the mechanical properties of the material.
Srolovitz et al. [39] extended the Potts Model to simulate grain growth in the presence of a second phase particle dispersion. Their model incorporates particles by assigning a particular spin to the lattice sites the particles occupy. The kinetics is the regular Monte Carlo dynamics for the Potts Model. Other groups [40, 41, 42] have also used this procedure to obtain properties including grain size, characteristic exponents, etc. for such pinned materials. Krichevsky and Stavans [43] and Herrera et al. [44] performed two-dimensional experiments on foam evolution in the presence of pinning centers, using a square array of pins and randomly distributed pins respectively.
We construct a continuous attractive pinning field around a point size Zener pin at each vertex in the source image, contributing a Hamiltonian term:
| (4) |
where is a constant that determines the pinning coupling strength and is the distance from the site to the closest pin. This term causes edges, and ultimately the reconstructed vertices, to move towards and eventually trap on the pins. The field F has its maximum value of at the position of the pins and falls off as the inverse of the distance (). It contributes a negative energy at each place where a link between two different bubbles is present (see eq. 4). Therefore, boundaries and vertices cost less energy when located close to a pinning center, producing an attractive pinning force on the vertices.
We choose the value of to produce a circular region around each center where the attraction of that center dominates, i.e., the center will definitely attract any edge or vertex within this circle. In our simulations, we chose the circles’ radii to be 20 pixels, which gives a value for the field, at the edge of the circles, of about 0.05. With , the pinning energies are strong enough to ensure that almost no edges or vertices will slip off a pin. In the region between two pins closer than 40 lattice sites, the closest pin will attract the vertex due to the stronger pinning field in that direction. This situation becomes less significant when we impose the cutoffs discussed below.
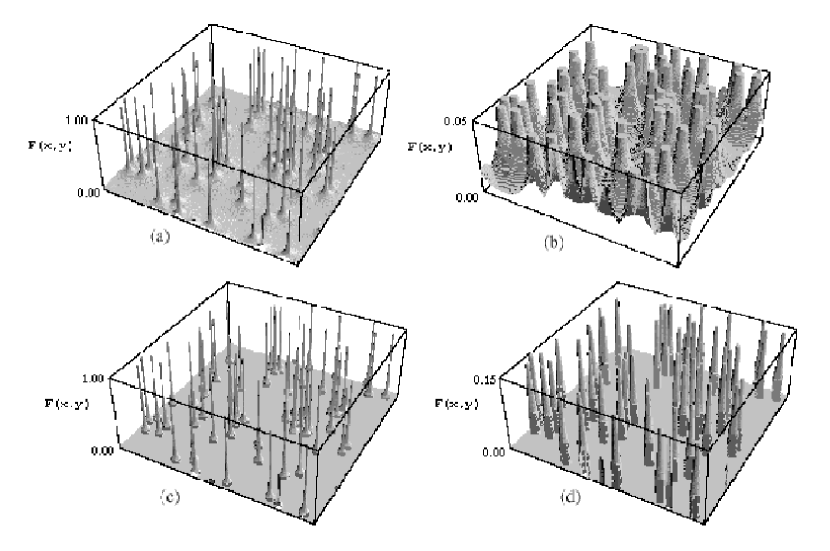
Figure 2a shows the entire range of the pinning field for a particular foam configuration while fig. 2b shows the same field scaled to show the field within 20 pixels of the pins. The pinning field within the circles (visible in the top plane in fig. 2b) around each pin is much stronger than other energy components. The great advantage of this method compared to simple Zener pins is that in the final patterns almost all pins lie in edges. If the nucleation algorithm has missed bubbles, then the number of pins may be larger than the number of vertices in the reconstructed pattern and a few pins may not correspond to vertices. If the nucleation algorithm creates extra bubbles then a few vertices may not correspond to pins.
A drawback of this implementation is that the lattice becomes very stiff and, although the vertices pin appropriately, the edges are not free to relax. To overcome this problem, we impose a cutoff on the field, after a certain number of mcs. After the cutoff, the field still falls off as but we limit its range to a certain radius around each pin. This procedure keeps the vertices pinned but frees most of the edge length from the pinning field, allowing edges to straighten in order to minimize surface energy. We apply successively shorter range cutoffs until the range of the pinning field is about four lattice sites. Figure 2c-d shows the field configuration after a cutoff for 20.
6 Reconstruction
6.1 Centers of Bubbles
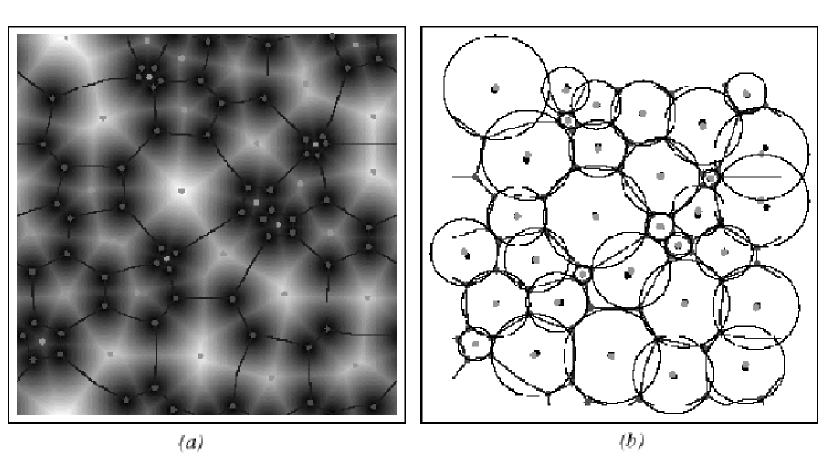
Our first step is to find the bubbles’ centers. We follow Glantz and Prause and use a Euclidean distance map to find the centers [6, 26, 45, 46, 47, 48, 49, 50, 51]. We construct such a map by picking a lattice site, calculating its distance from all the vertices and storing the minimum of these distances for that site. Repeating this procedure for all lattice sites produces the map [51, 52, 53]. Figure 3a shows the map for a typical foam configuration. We assume that the centers of the bubbles sit on the local maxima in the map. Figure 3b shows the positions of the calculated centers (green) compared to the real ones (black) obtained from center of mass calculations. The agreement is fairly good. In three dimensions, this process is essentially the same, with the sole change that the distances are calculated from the sites to the edges.
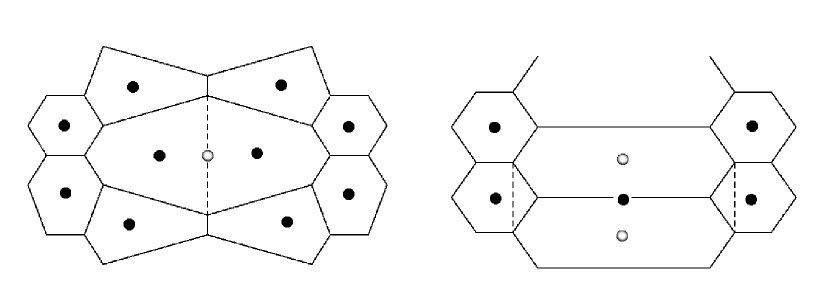
This method, however, has some pathologies. Multiple maxima may be present within a bubble. We treat this problem by combining any two maxima that are closer to each other than to the closest vertex. The solution has an intrinsic flaw: when a bubble is long and thin, its centers may be closer to neighboring bubble centers than to the closest vertex, causing the disappearance of the bubble. Alternatively, the centers in a stretched bubble may be further from each other than from the nearest edge, causing the center map to create an extra bubble. Figure 4 illustrates these two situations.
Saddle points are another problem. The center point of an edge is a saddle point in the Euclidean map and if the edge is long enough, the saddle point may look like a maximum because of errors resulting from lattice discretization. An effort to exclude saddle points when searching for maxima may result in missing centers for small bubbles. If the initial bubble size distribution is narrow (bubbles are roughly the same size) and the domains are fairly isotropic, then no errors result. We are currently working to quantify the consequences and thresholds of these errors. Overall, we lose a few very small or elongated bubbles. During foam coarsening, these bubbles have a short lifetime (they disappear rapidly), so the error in most cases is quite small and has the effect of reconstructing a foam pattern that seems slightly later in time than the source pattern.
These pathologies result from the distance algorithm, i.e., the first part of our method. Our main reconstruction procedure, however, is independent of the method we use to find the centers of bubbles which we can improve or replace, e.g. the method proposed by Kammerer and Glantz [58].
6.2 Nucleation
Once we have chosen a set of bubble centers we nucleate a bubble with unique spin and area of one pixel at each center and set the remaining sites to spin 0. The spin 0 domain behaves like a big bubble which shrinks while the others coarsen. The bubbles coarsen under a target area constraint. These target areas are roughly the areas each bubble will have at the end of coarsening. We defined the pinning field above. The Hamiltonian is:
| (5) |
where we have generalized the area constraint. The area coupling constant is:
| (6) |
where is a constant and is the largest of the target areas. With a uniform as in previous applications, the area term is larger for bigger bubbles than for smaller bubbles. Therefore, the former ”swallow” the latter in order to minimize energy. To overcome this problem, we weight the coupling constant by making it inversely proportional to the bubble target area.
To estimate the tentative target area, we used the area of a circle centered at the bubble’s calculated center with radius equal to the distance to the closest vertex. Figure 3b illustrates this procedure. Clearly this approximation works better for isotropic bubbles. We could also use the average distance to the neighboring vertices or other estimates. The geometrical element that fills two-dimensional space with minimum surface energy is the hexagon. The area of a hexagon that fits inside a circle is about 10% smaller than the area of the circle itself. Therefore, we use 90% of the areas of the circles in fig. 3b as the tentative target areas. The method we use to obtain the tentative target areas plays only a small role, if any, in the final reconstruction.
To ensure that all the bubbles grow at comparable rates, we increase their target areas in steps to their full values. During the first 50 mcs we set the target areas to 10% of their full values, so after 50 mcs, all the bubbles have grown to 10% of their final sizes. After each 50 mcs, we increase the target areas by 10%, so the target areas reach their full values after 500 mcs.
After all the bubbles have achieved their final areas and the structure has pinned, we turn off the area constraint and impose a cutoff on the pinning field, as discussed above, to allow the interfaces to relax, and the areas to change, in order to obtain the lowest energy configuration.
For many purposes the approximate reconstruction is adequate. However, if we wish to measure the growth rates of bubbles to high accuracy we are examining small differences of large areas so even a small error in the areas gives a large error in their growth rates. We are developing procedures to correct the bubbles’ areas [54].
6.3 Results
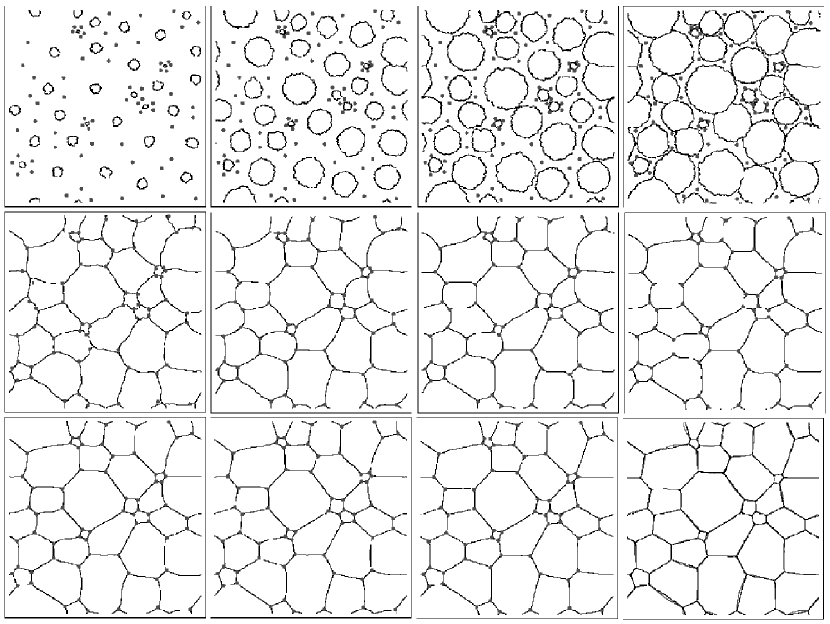
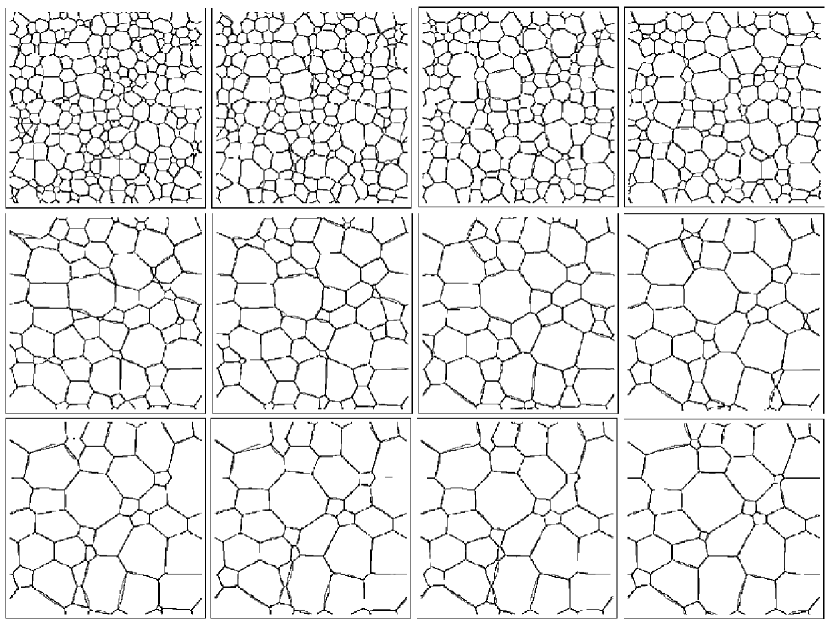
Figure 5 shows (up to 25000 mcs) the growth of bubbles and structures reconstructed for a simulated foam coarsened for 50000 mcs. The last picture in the series shows a snapshot of the simulation superimposed on the reconstruction. Our reconstructions used the same alternating temperature approach as our coarsening simulations. We set to allow the vertices to find the pinning centers faster. The parameters for all reconstruction simulations were 1, 1, 1000, and 0.1. We repeated the same procedure for many different configurations and obtained the reconstructed foam coarsening of fig. 6.
6.4 Analysis of Results
During nucleation and growth of bubbles, the bubbles are at first circular and grow at the same pace due to the rescaling of their target areas. Eventually they impinge on one another, forming interfaces and vertices. The contact between bubbles keeps them from growing further and both the area constraint and pins further inhibit global coarsening.
Once the bubbles fill the lattice, their configuration is already close to the final one. Most of the vertices have already trapped on pinning centers and most untrapped vertices eventually trap during the relaxation of edges and rearrangement of areas after we turn off the target area constraint and impose cutoffs on the pinning field. The residual pinning field hinders further coarsening.
Although defects in the center calculation cause most errors in the reconstructed pattern, the nucleation of bubbles and relaxation of edges can introduce additional imperfections. A particular vertex may attach to the wrong pin or an edge may be missing. A bubble which was originally very long and thin might receive a target area much different from its original area because the anisotropy makes the nearest vertex much closer to the center than the average distance to the vertices. Since all bubbles nucleate as circles, an edge may miss a pin during the nucleation of a long, thin bubble, leaving a pin inside the bubble which never captures the edge. After this bubble achieves its final target area, it will still have to jump over an energy barrier in order to squeeze into a long, thin shape. A pair of stretched bubbles just before a process (topological transition where a four-fold vertex decays into two three-fold vertices) in the original image will almost never reconstruct properly because it is so near the much lower energy state after the that the reconstruction jumps over the real configuration to the lower energy configuration. However, the real foam pattern would evolve rapidly to this state so the effective error is small.
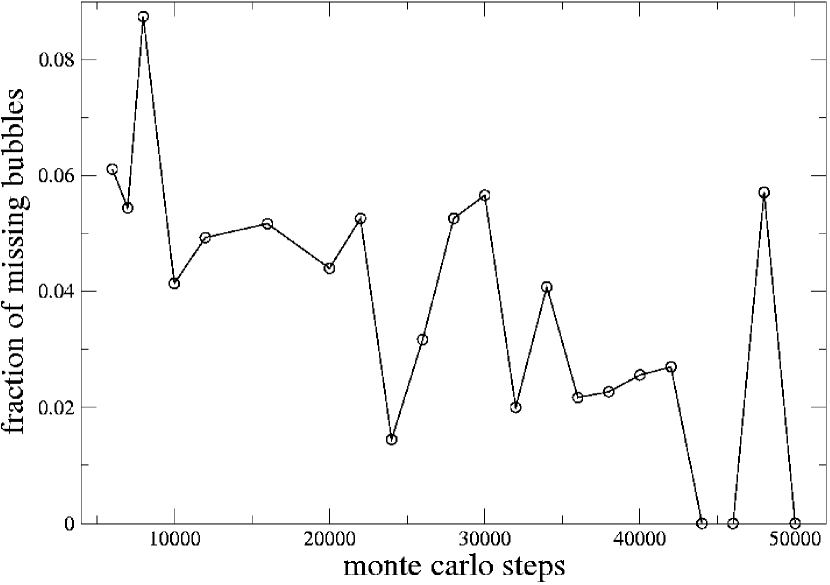
Even after a vertex pins, it may break loose. Vertices in less energetically favorable configurations, like those undergoing s or joining edges that make angles much smaller than 120∘, may detach from the pins despite very strong coupling to the pinning field. These extreme situations create loose vertices that evolve locally with the dynamics of an unpinned foam which may complete s in progress or lead to the disappearance of bubbles. As a result, the reconstructed structure may depart slightly from the original configuration as in fig. 6. Errors are less common in more homogeneous, isotropic foams. Figure 7 shows the fraction of missing bubbles as a function of time.
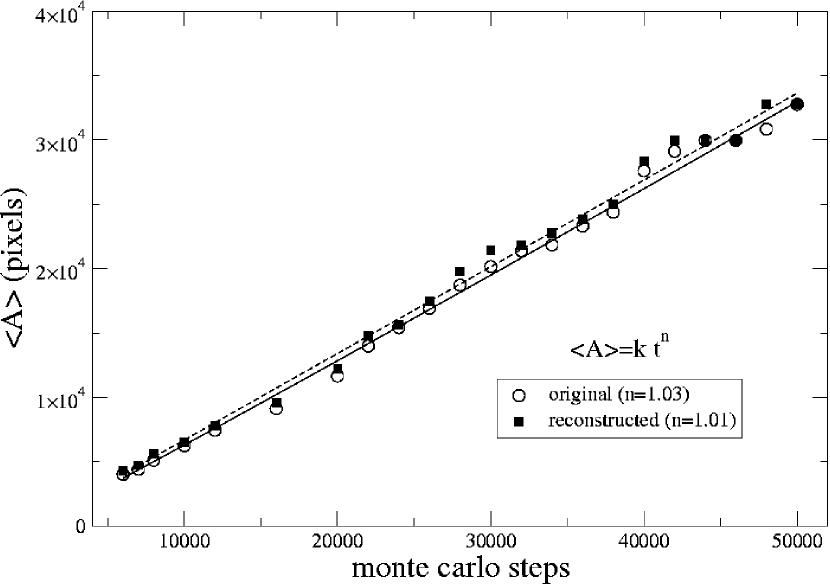
How do these deviations affect the global coarsening described in [28, 32, 55, 56]? If we characterize coarsening by fitting the average area per bubble as a function of time to a power law:
| (7) |
we obtain a growth exponent characterizing the coarsening. For a foam-like material, the characteristic exponent must be [32]. Besides the mean bubble area, the basic measures of the state of a foam are the distribution of the number of sides (the probability that a randomly selected bubble has sides), and the normalized area distribution (the probability that a bubble has an area which is a given fraction of the mean bubble area). The distributions show dynamical scaling, i.e. they become time invariant at long times. We define the th moment of the side distribution as:
| (8) |
where is the average number of sides of a bubble in the pattern (for infinite patterns 6). The second moment, , measures the r.m.s. width of the distribution while and measure the asymmetry and the flatness of the side distribution.
To test these properties and quantify the errors, we analyzed the coarsening dynamics of both the simulated and reconstructed foams. Figure 8 shows the time evolution of for both foams. Both curves follow a power law, with exponents for the original foam (solid line in the figure) and for the reconstructed foam (dotted line). Both exponents are consistent, within error, with the expected value of one. Thus, the reconstructed foam has the same global dynamics as the original and theory.
Figure 9 shows the mean deviation of the reconstructed areas from the original areas given by:
| (9) |
as a function of time, including and excluding missing bubbles in the calculation. The superscripts O and R stand for the original and reconstruction, respectively. The sum in eq. 9 runs over all bubbles in the foam. Both curves decrease slightly due to the increasing length scale of the pattern. The time averaged deviation is including missing bubbles and excluding them. Hence, the area of a reconstructed bubble differs by about 5.4% from the area of the original bubble.
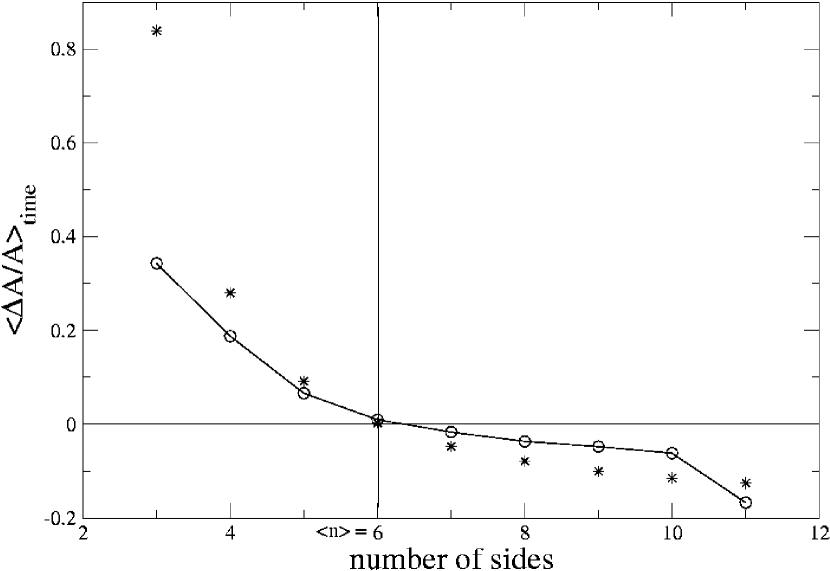
This residual error is a consequence of reconstructing straight edges rather than the curved boundaries of a real foam. According to Plateau’s rules, the ratio between the perimeter and the square root of the area of a regular bubble is a constant () while the ratio for polygonal bubbles with straight sides is . Therefore, the relative deviation from a regular Plateau bubble of a bubble with straight sides is approximately . Figure 10 shows (stars) on top of the time averaged relative difference between simulated and reconstructed areas given by:
| (10) |
as a function of the number of sides . The sum in eq. 10 runs over all bubbles with sides at any instant of time. For few-sided bubbles, the reconstructed area is smaller than the original area, while for many-sided bubbles the reconstructed area is larger than the original area. The reconstructed images had no 3- or 11-sided bubbles to analyze. Otherwise, the relative area deviations follow very closely the theoretical predictions for .
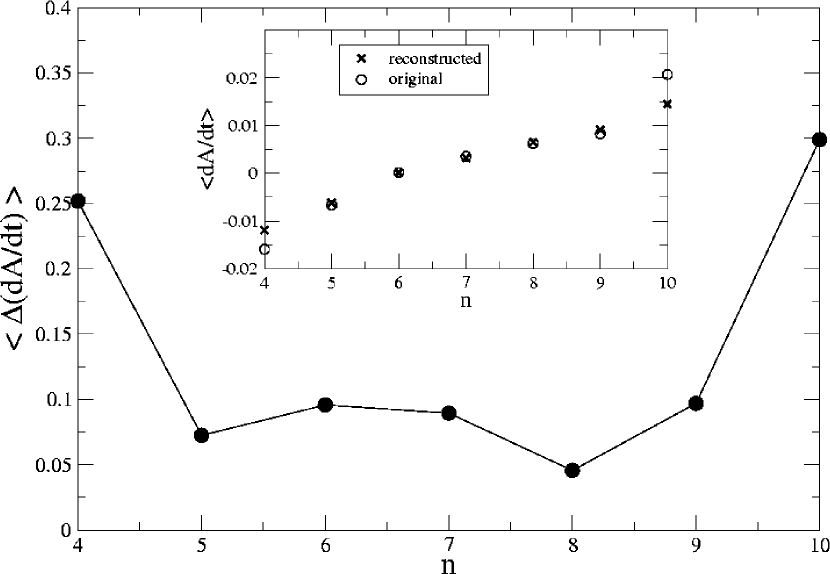
von Neumann’s law states that, in two dimensions, the area growth rate of individual bubbles with edges is proportional to :
| (11) |
Few-sided bubbles are convex, so a straight-sided reconstruction cuts off the bulges, while many-sided bubbles are concave so a straight-sided reconstruction fills in the dips. Figure 11 shows the deviation in von Neumann’s law calculated for the simulated and reconstructed foams as:
| (12) |
where the summation in runs over all the -sided bubbles at any instant of time. The nonlinearity seen in the inset to fig. 11 results from deviations in growth rate for small bubbles which are an artifact of the regular Potts Model simulation [57].
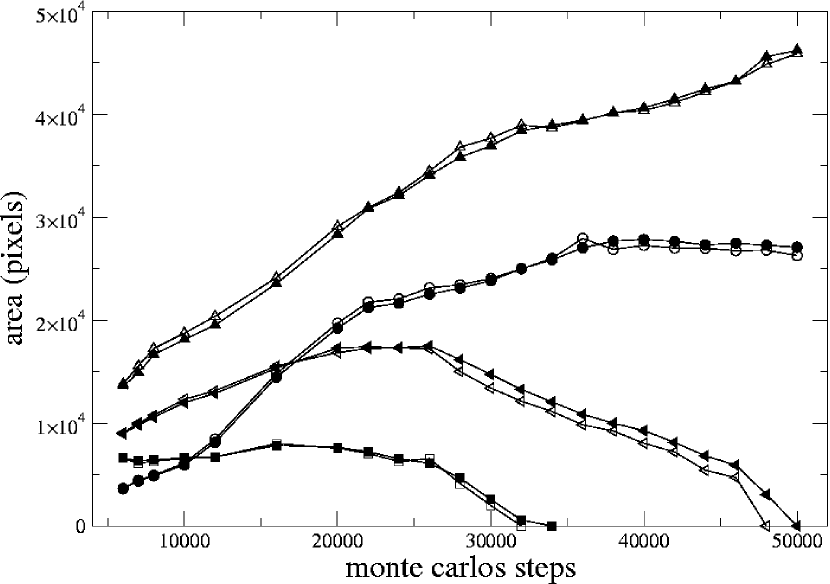
Figure 12 shows the time dependence of the areas of four individual bubbles. Filled and open symbols of the same type (circles, squares, etc.) correspond to simulated and reconstructed areas. The local dynamics are very similar for the simulation and reconstruction. Figure 6 shows that for the great majority of the bubbles, simulation and reconstruction follow the same dynamics.
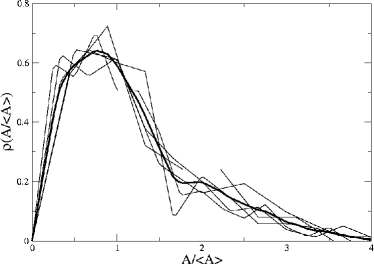
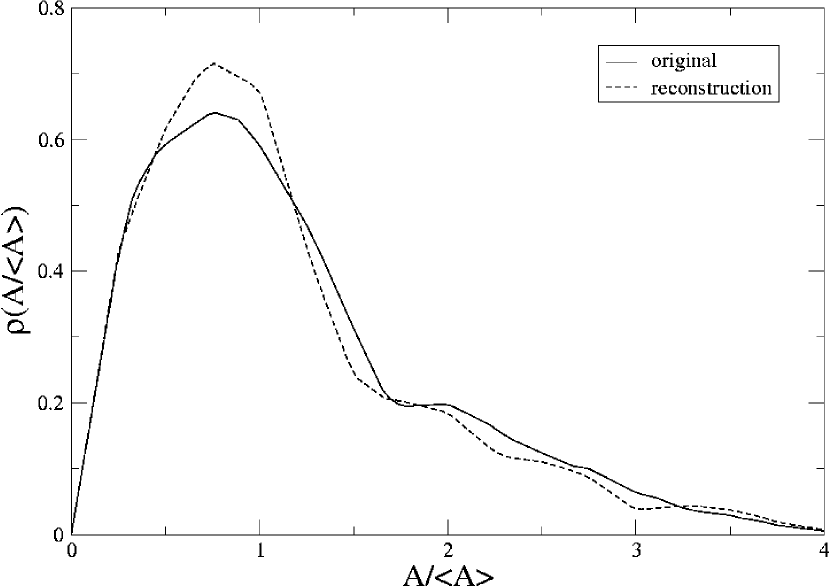
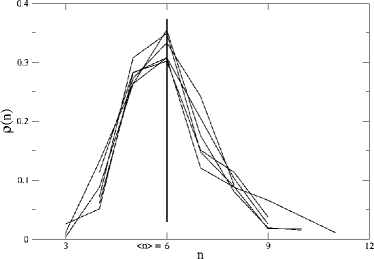
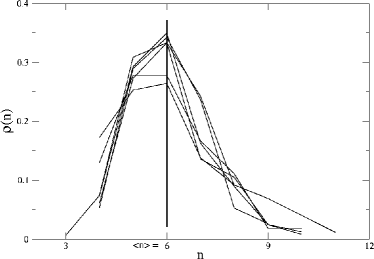
Another important aspect of coarsening foam is self-similarity. Figure 13a shows the normalized area distributions at several times for the simulated foam. These distributions are congruent, indicating that the foam is in a scaling state. The thick line obtained by averaging all the distributions represents all the individual cases within . The same applies to the reconstruction (fig. 13b). The scaled area distributions are equivalent within (fig. 14) so the reconstructed foam scales in the same way as the simulation.
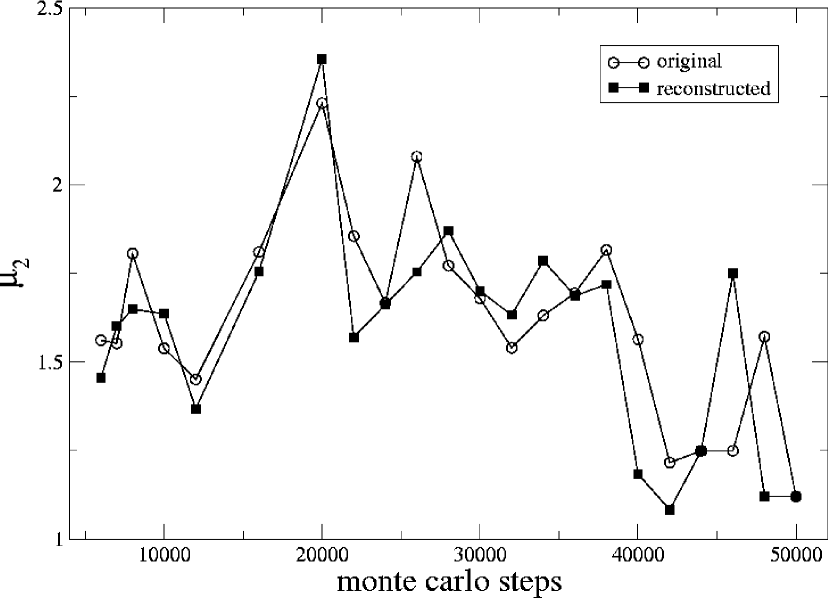
Figure. 15 shows the evolution of the side distributions for both the simulation (a) and reconstruction (b). The distributions are time-independent and remarkably similar, peaking at [56]. Figure 16 shows the second moment of the side distributions as function of time. The general behavior is similar for both patterns: oscillates about a stable value, since in the scaling state, the width of the distribution is nearly constant. The average values of for the simulation and for the reconstruction agree well with experimental values [56, 32].
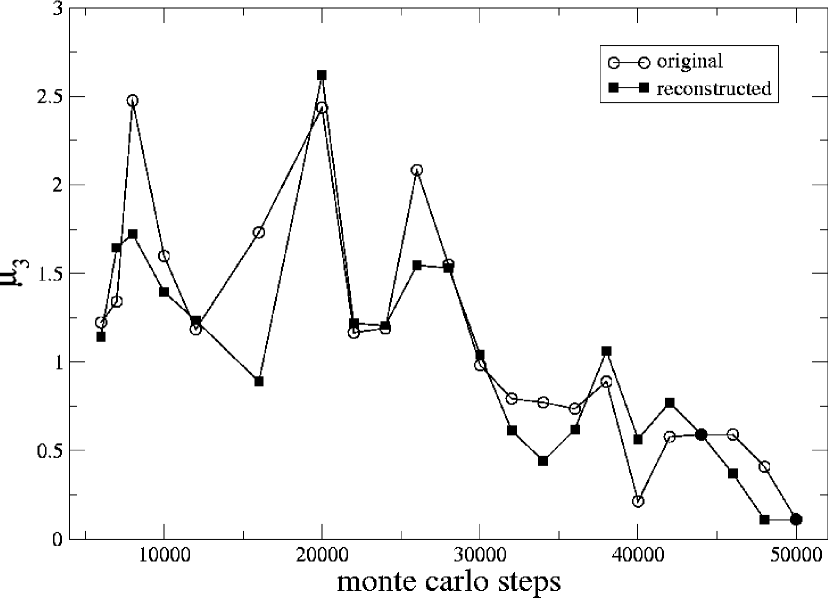
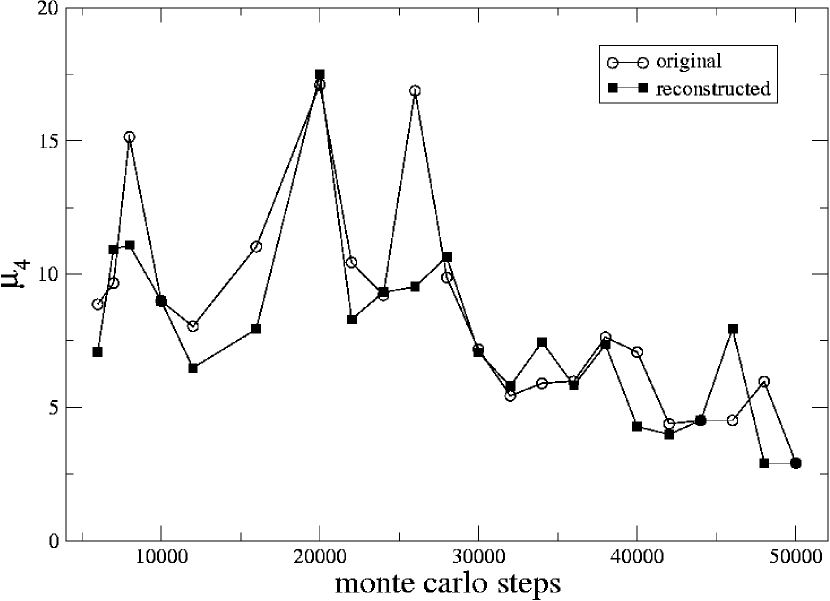
Figures 17 and 18 show, respectively, the third and fourth moments as functions of time. The third moment begins near its maximum () showing the inhomogeneity in the foam that lasts until about 30000 mcs. It then drops to a stable value of for the simulation and for the reconstruction. The fourth moment behaves similarly: an initial equilibration stage up to 30000 mcs, followed by stability with for the simulation and for the reconstruction, again agreeing with experiment [32].
7 Conclusions
Our method of reconstructing two-dimensional foam structures works well. The Potts Model generates minimal energy surfaces and the pins hinder coarsening. These two tools together reconstruct a coarsening foam. We show that imperfections mainly result from the distance map calculation, which is not the core of our method. A recent paper of Kammerer and Glantz suggests an alternative scheme which may eliminate many of these errors [58]. The deviations do not induce systematic errors in the statistical properties of a foam during coarsening. The method extends to three dimensions with no major modifications, which will be very helpful in studies of the dynamics of three-dimensional cellular patterns.
Our aims are now two-fold. We must deal with real data. The reconstruction algorithm presented in this article will be the basis for analyzing the images of three-dimensional foams we recently obtained using X-ray tomography at the European Synchrotron Radiation Facility (ESRF). At this point, we stress that the major difference between two-dimensional and three-dimensional partial images is that the former consists of vertices while the later consists of edges of bubbles.
To extract the maximum information from experimental images we will directly couple the value of in the Potts Hamiltonian to the pixel gray level. A bubble boundary located in a dark region (fluid phase) will cost much less energy than a boundary in a light region (gas phase). This reformulation of the pinning field has the great advantage that it requires no image pretreatment or thresholding. Randomly distributed “fluid” pixels due to experimental noise will have much less power to pin boundaries than the organized pixels corresponding to edges, even if their gray level values are of the same order of magnitude. The method is also relatively immune to long wavelength inhomogeneities in the image saturation, e.g. due to MRI coil geometry.
We are working to improve our image reconstruction by developing heuristics to correct for missing/extra bubbles, by introducing additional mechanisms to deal with noise, and by implementing target area corrections.
References
- [1] X. Munoz, J. Freixenet, X. Cufi, and J. Marti, Strategies for image segmentation combining region and boundary information, Pattern Recogn. Lett. 24 (2003) 375-392.
- [2] D. L. Pham, C. Y. Xu, and J. L. Prince, Current methods in medical image segmentation, Annu. Rev. Biomed. Eng. 2 (2000) 315-+.
- [3] J. S. Suri, K. C. Liu, S. Singh, S. N. Laxminarayan, X. L. Zeng, and L. Reden, Shape recovery algorithms using level sets in 2-D/3-D medical imagery: A state-of-the-art review, IEEE T. Inf. Technol. B 6 (2002) 8-28.
- [4] P. Zinzindohoue, Noise effect on texture-discrimination and image segmentation, Optik 87 (1991) 141-146.
- [5] J. Plateau, Statique expérimentale et théorique des liquides soumis aux seulles forces moleculaires, Gauthier-Villars, Paris, 1873.
- [6] B. Prause, Magnetic resonance imaging of coarsening in three-dimensional foams, Ph.D. dissertation, University of Notre Dame, 2000.
- [7] C. Monnereau and M. Vignes-Adler, Optical tomography of real three-dimensional foams, J. Colloid Interf. Sci. 202 (1998) 45-53.
- [8] C. Monnereau and M. Vignes-Adler, Dynamics of 3D real foam coarsening, Phys. Rev. Lett. 80 (1998) 5228-5231.
- [9] C. Monnereau, M. Vignes-Adler, and N. Pitter, Coarsening of a three-dimensional reconstructed foam under Surface Evolver, Philos. Mag. B 79 (1999) 1213-1222.
- [10] C. Monnereau, N. Pittet, and D. Weaire, An analysis of surface curvature and growth laws for foam cells using the Surface Evolver, Europhys. Lett. 52 (2000) 361-367.
- [11] C. Monnereau, B. Prunet-Foch, and M. Vignes-Adler, Topology of slightly polydisperse real foams, Phys. Rev. E 63 (2001) art. no. 061402.
- [12] M. R. Fetterman, E. Tan, L. Ying, R. A. Stack, D. L. Marks, S. Feller, E. Cull, J. M. Sullivan, D. C. Munson, S. T. Thoroddsen, and D. J. Brady, Tomographic imaging of foam, Opt. Express 7 (2000) 186-197.
- [13] F. Morgan and R. Bolton, Hexagonal economic regions solve the location problem, Am. Math. Mon. 109 (2002) 165-172.
- [14] J. M. Sullivan, F. Morgan, F. Almgren et al, Open problems in soap bubble geometry, Int. J. Math. 7 (1996) 833-842.
- [15] W. Thomson (Lord Kelvin), On the division of space with minimum partitional area, Phil. Mag. 25 (1887) 503-514.
- [16] D. Weaire and N. Rivier, Soap, cells and statistics - random patters in 2 dimensions, Contemp. Phys. 25 (1984) 59-99.
- [17] H. V. Atkinson, Theories of normal grain-growth in pure single-phase systems, Acta Metall. Matter. 36 (1988) 469-491.
- [18] G. Reiter, Dewetting of thin polymer-films, Phys. Rev. Lett. 68 (1992) 75-78.
- [19] D’Arcy W. Thomson, On growth and form, Cambridge University Press, Cambrigde, 1942.
- [20] K. J. Dormer, Fundamental tissue geometry for biologists, Cambridge University Press, Cambrigde, 1980.
- [21] V. E. Fradkov, A. S. Kravchenko, and L. S. Shvindlerman, Experimental investigation of normal grain-growth in terms of area and topological class, Scripta Metall. Mater. 19 (1985) 1291-1296.
- [22] D. J. Durian, D. A. Weitz, and D. J. Pine, Multiple light-scattering probes of foam structure and dynamics, Science 252 (1991) 686-688.
- [23] D. J. Durian, D. A. Weitz, and D. J. Pine, Scaling behavior in shaving cream, Phys. Rev. A 44 (1991) R7902-R7905.
- [24] C. P. Gonatas, J. S. Leigh, A. G. Yodh, J. A. Glazier, and B. Prause, Magnetic-resonance images of coarsening inside a foam, Phys. Rev. Lett. 75 (1995) 573-576.
- [25] F. Graner, I. Cantat, R. Delannay, J. A. Glazier, and P. Cloetens, unpublished.
- [26] R. Glantz, Porennetzwerke von erdstoff-filtern. Mathematisch-morphologische beschreibung kernspintomographischer aufnahmen, Ph.D. dissertation, University of Karlsruhe, 1997.
- [27] F. Y. Wu, The Potts model, Rev. Mod. Phys. 54 (1982) 235-268.
- [28] D. J. Srolovitz, M. P. Anderson, G. S. Grest, and P. S. Sahni, Grain-growth in 2 dimensions, Scripta Metall. 17 (1983) 241-246.
- [29] D. J. Srolovitz, M. P. Anderson, G. S. Grest and P. S. Sahni, Computer simulation of grain-growth .1. Kinetics, Acta Metall. Mater. 32 (1984) 783-791.
- [30] D. J. Srolovitz, M. P. Anderson, P. S. Sahni and G. S. Grest, Computer simulation of grain-growth .2. Grain size distribution, topology, and local dynamics, Acta Metall. Mater. 32 (1984) 793-802.
- [31] J. Wejchert, D. Weaire, and J. P. Kermode, Monte-Carlo simulation of the evolution of a two-dimensional soap froth, Philos. Mag. B 53 (1986) 15-24.
- [32] J. A. Glazier, M. P. Anderson, and G. S. Grest, Coarsening in the 2-dimensional soap froth and the large-Q Potts model - a detailed comparison, Philos. Mag. B 62 (1990) 615-645.
- [33] Y. Jiang and J. A. Glazier, Extended large-Q Potts model simulation of foam drainage, Philos. Mag. Lett. 74 (1996) 119-128.
- [34] D. Weaire, F. Bolton, P. Molho, and J. A. Glazier, Investigation of an elementary model for magnetic froth, J. Phys: Condens. Matter. 3 (1991) 2101-2114.
- [35] F. Graner and J. A. Glazier, Simulation of biological cell sorting using a 2-dimensional extended Potts-model, Phys. Rev. Lett. 69 (1992) 2013-2016.
- [36] N. Metropolis, A. Rosenbluth, M. Rosenbluth, A. Teller, and E. Teller, Equation of state calculations by fast computing machines, J. Chem. Phys. 21 (1953) 1087-1092.
- [37] K. Kawasaki, Diffusion constants near the critical point for time-dependent Ising models. I, Phys. Rev. 145 (1965) 224-230.
- [38] R. J. Glauber, Time-dependent statistics of the Ising model, J. Math. Phys. 4 (1963) 294-307.
- [39] D. J. Srolovitz, M. P. Anderson, G. S. Grest, and P. S. Sahni, Computer simulation of grain-growth .3. Influence of a particle dispersion, Acta Metall. Mater. 32 (1984) 1429-1438.
- [40] B. K. Kad and P. M. Hazzledine, Monte Carlo simulations of grain growth and Zener pinning, Mat. Sci. Eng. A 238 (1997) 70-77.
- [41] M. Soucail, R. Messina, A. Cosnuau, and L. P. Kubin, Monte Carlo simulation of Zener pinning in two dimensions, Mat. Sci. Eng. A 271 (1999) 1-7.
- [42] A. Miyake, New criterion on zener pinning in 2-D systems, Scripta Mater. 45 (2001) 1009-1015.
- [43] O. Krichevsky and J. Stavans, Coarsening of 2-dimensional soap froths in the presence of pinning centers, Phys. Rev. B 46 (1992) 10579-10582.
- [44] O. Herrera, A. Olguin, M. Ortiz, and C. H. Worner, Pinned state in a two-dimensional soap froth, Phys. Rev. E 55 (1997) 4475-4477.
- [45] R. Glantz and U. Schuler, Pore networks of granular filters, in: Proceedings of Geofilters’96, Montreal, Canada, May 1996.
- [46] R. Glantz, R. Englert, and W. G. Kropatsch, Contracting distance maps of pores to pore networks, in: Proceedings of the Computer Vision Winter Workshop CVWW99, Wien, Austria, May 1999.
- [47] E. S. Blurock, R. Glantz, and R. Englert, Genetic optimization of rules to find structures in gray level images: Proposed Method, in: Proceedings of the 2nd IAPR-TC-15 Workshop on Graph-based Representation, OCG-Schriftenreihe, Band 126, Osterreichische Computer Gesellschaft, May 1999.
- [48] J. Timonen, K. Kippo, R. Glantz, and T. Pakkanen, Combination of 3D MRI and connectivity analysis in structural evaluation of cancellous bone in rat proximal femur, J. Mat. Sci.: Mater. M. 12 (2001) 319-325.
- [49] I. Hidajat, A. Rastogi, M. Singh, and K. K. Mohanty, Transport properties of porous media reconstructed from thin-sections, SPE J. 7 (2002) 40-48.
- [50] J. H. Jang and K. S. Hong, Detection of curvilinear structures and reconstruction of their regions in gray-scale images, Pattern Recogn. 35 (2002) 807-824.
- [51] M. N. Kulountzakis, and K. N. Kutulakos, Fast computation of the euclidean distance maps for binary images, Inform. Process. Lett. 43 (1992) 181-184.
- [52] L. Chen and H. Y. H Chuang, A fast algorithm for euclidean distance maps of a 2-D binary image, Inform. Process. Lett. 51 (1994) 25-29.
- [53] A. Fujiwara, T. Masuzawa, and H. Fujiwara, An optimal parallel algorithm for the Euclidean distance maps of 2-D binary images, Inform. Process. Lett. 54 (1995) 295-300.
- [54] I. F. Vasconcelos, I. Cantat, and J. A. Glazier, to be published.
- [55] J. A. Glazier, S. P. Gross, and J. Stavans, Dynamics of two-dimensional soap froths, Phys. Rev. A 36 (1987) 306-312.
- [56] J. Stavans and J. A. Glazier, Soap froth revisited - dynamic scaling in the two-dimensional froth, Phys. Rev. Lett. 62 (1989) 1318-1321.
- [57] E. Holm, J. A. Glazier, D. J. Srolovitz, and G. S. Grest, Effects of lattice anisotropy and temperature on domain growth in the 2-dimensional Potts-model, Phys. Rev. A 43 (1991) 2662-2668.
- [58] P. Kammerer and R. Glantz, Segmentaton of Brush Strokes by Saliency Preserving Dual Graph Contraction, Pattern Recogn. Lett. 24 (2003) 1043-1050.