Pasadena, CA 91125, USA
11email: wilke@caltech.edu
WWW home page: http://dllab.caltech.edu/ wilke
Does the Red Queen reign in the kingdom of digital organisms?
Abstract
In competition experiments between two RNA viruses of equal or almost equal fitness, often both strains gain in fitness before one eventually excludes the other. This observation has been linked to the Red Queen effect, which describes a situation in which organisms have to constantly adapt just to keep their status quo. I carried out experiments with digital organisms (self-replicating computer programs) in order to clarify how the competing strains’ location in fitness space influences the Red-Queen effect. I found that gains in fitness during competition were prevalent for organisms that were taken from the base of a fitness peak, but absent or rare for organisms that were taken from the top of a peak or from a considerable distance away from the nearest peak. In the latter two cases, either neutral drift and loss of the fittest mutants or the waiting time to the first beneficial mutation were more important factors. Moreover, I found that the Red-Queen dynamic in general led to faster exclusion than the other two mechanisms.
1 Introduction
Two major principles of evolutionary biology have been observed in competition experiments between variants of RNA viruses with identical or almost identical fitness: competitive exclusion and Red Queen dynamic [1, 2]. The competitive exclusion principle refers to the ultimate outcome of these competition experiments, and states that when two or more species live on the same resource, eventually all but one will die out [3]. The Red Queen dynamic refers to the initial phase of these competition experiments, where the two competing virus variants both increase in fitness while they remain in roughly equal concentrations. Van Valen [4] had originally proposed the Red Queen dynamic as a metaphor for the struggle for existence of species in complex ecosystems. These species, just like the Red Queen in Lewis Carroll’s Through the Looking Glass, would constantly have to run (that is, to adapt to changing conditions) just to remain where they were (see also Ref. [5]).
Solé et al. [6] studied the competition of neutral virus variants in a simple bitstring model with additive fitness, related to Kauffman’s model [7], and could confirm both competitive exclusion and Red Queen dynamic in their model. Moreover, Solé et al. showed that the competitive exclusion principle follows immediately from the quasispecies equations [8, 9] that describe virus evolution.
The Red Queen effect, on the other hand, is not a necessary conclusion of the quasispecies dynamic, as we can see from a simple thought experiment: Assume that we allow two viruses to compete that are both situated on top of the highest peak in the fitness landscape. None of the two viruses can accumulate any further beneficial mutations, and the outcome of a competition between them will be determined by genetic drift. Clearly, the Red Queen dynamic can occur only if beneficial mutations are sufficiently abundant, so that adaptation happens on a faster time scale than genetic drift. The additive model of Solé et al. has a fairly high rate of positive mutations for all but the very best sequences in the fitness landscape, which explains why they observed the Red Queen dynamic. Such simple additive or multiplicative fitness landscapes lead to a smooth increase in average fitness over time [10, 11], and such increase has been reported for RNA viruses [12]. However, in many cases beneficial mutations are rare, which leads to the frequently-oberseved stepwise increase in average fitness [13, 14, 15, 16].
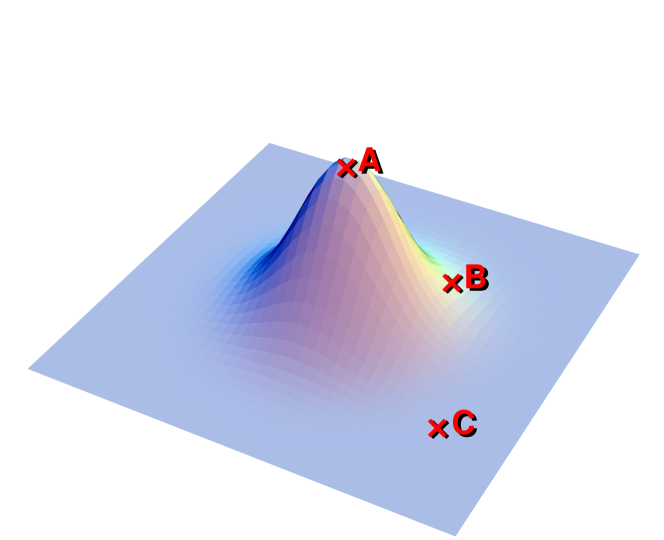
Here, I present a study of the influence of the immediate neighborhood in the fitness space on the competition dynamics of identical organisms. I carried out this study with digital organisms (self-replicating computer programs) [17], using the Avida platform. Avida is similar to Tom Ray’s Tierra [18], and has been described extensively in the literature [19, 20, 21, 22]. In Avida, the self-replicating computer programs are rewarded with increased CPU speed when they perform certain logical computations. By changing the bonus structure, that is, by changing which computations are rewarded with what bonuses, the researcher can shape the fitness landscape in which the digital organisms evolve. I studied three different strains of digital organisms that were located on the top (A), at the base (B), and some distance away from the nearest fitness peak (C) (Fig. 1).
2 Materials and methods
2.1 Computer experiments
I used Avida version 1.99, which is available from
http://sourceforge.net/
projects/avida. I used the default setup,
apart from the following modifications: I switched off length changes, and set
insertion and deletion mutations to zero. As the original ancestor of all
organisms in this study, I used the handwritten organism
organism.heads.100, which comes with the Avida distribution. I used
two different environment files (the environment determines the logical
operations for which organisms are rewarded, and thus defines the fitness
landscape). The first one, environment 1, did not reward any logical
computations, so that fitness was a direct function of an organism’s
replication efficiency. The second one, environment 2, rewarded all possible
one-, two-, and three-input logical operations. In this environment,
replication efficiency was only a minor component of fitness, whereas the
successful completion of as many logical computations as possible resulted in
high fitness values. The mutation rate in all experiments was 0.75 miscopied
instructions per offspring organism, unless explicitly stated otherwise.
I created the strains A, B, and C (as illustrated in Fig. 1) as follows. For strain A, I inocculated a population of organisms with the handwritten ancestor, and propagated this population for 14,000 generations in environment 1. Then, I extracted the most abundant organism, which replicated roughly two times faster than the original ancestor. By generation 14,000, the population had not experienced any significant fitness improvements for over 10,000 generations, which showed that it had indeed reached the top of a fitness peak. For strain B, I first evolved from the handwritten ancestor an organism that could perform all possible one- and two-input logical computations. Then, I inocculated a population of size with this evolved organism, in order to let the organism accumulate mutations. After 50 generations, I extracted from the population a variant with drastically reduced (by a factor of fifteen) fitness. This variant differed in six instructions (out of 100) from its evolved ancestor, and had lost five logical operations. It was therefore at the base of a fitness peak in environment 2, where many additional logical computations could be learned. For strain C, I simply used the handwritten ancestor (also in environment 2). The handwritten ancestor did not perform any logical computations. In Avida, the evolution of the first logical computation is harder than the evolution of additional ones, which guaranteed that C was further away from the fitness peak than B.
I carried out all competition experiments with the following protocol. For each strain, I used three different population sizes, , , and . I did 100 replicates per population size and competing strain. In each competition experiment, I inocculated the population with identical copies of the strain under study, and marked half of them with an inheritable neutral marker. Then, I propagated the population in the respective environment (environment 1 for strain A, environment 2 for strains B and C) at fixed size until the population consisted of either all marked or all unmarked organisms. Each generation, I recorded the average and maximum fitness of the marked and unmarked organisms, as well as their relative frequencies.
2.2 Coalescent theory
For the competition of two strains in a completely flat landscape, we can calculate the distribution of extinction times from coalescent theory. Let be the probability that after generations, each of the organisms in the population is a direct descendant of one of a group of only organisms that were present at . Further, let be the probability that this group of contained both marked and unmarked organisms. Then, the probability that neither the marked nor the unmarked strain is extinct after generations is
| (1) |
The quantity has been given in various forms in the literature [23, 24, 25]. The following version is based on the result by Tavaré [25]:
| (2) |
where , and satisfies the recursion (for ):
| (3a) | ||||
| (3b) | ||||
| (3c) | ||||
The quantity is the variance of the offspring distribution. In Avida, it has the value , because organisms in Avida can have either zero, one, or two offspring organisms per generation, with equal probabilities (if all organisms have equal fitness).
3 Results and Discussion
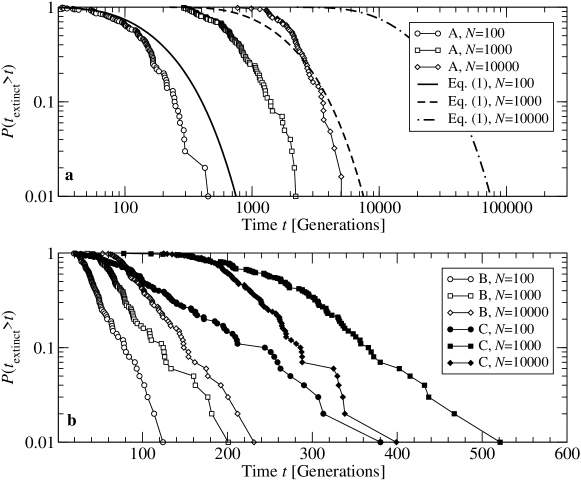
I measured the time to extinction of the losing clone in all competition experiments and derived the distributions of extinction times. The nine distributions (three strains at three different population sizes) are shown in Fig. 2. The extinction times are the longest for competitions of strain A, intermediate for competitions of strain C, and shortest for competitions of strain B. For strains A and B, the extinction times grow systematically with increasing population size, whereas for strain C, the extinction times grow from to , but then decrease again for . (Notice that the line with solid diamonds lies on the left of the line with solid squares in Fig. 2b.)
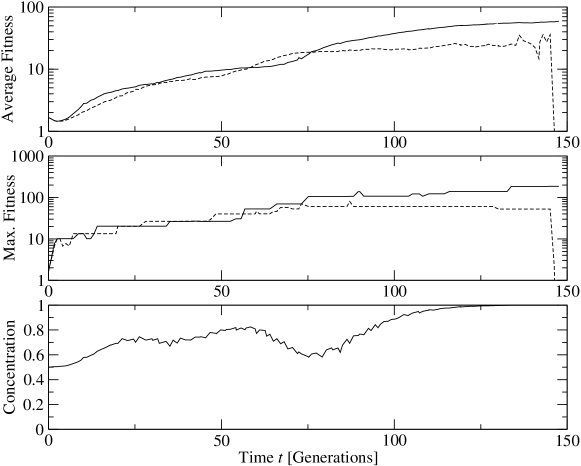
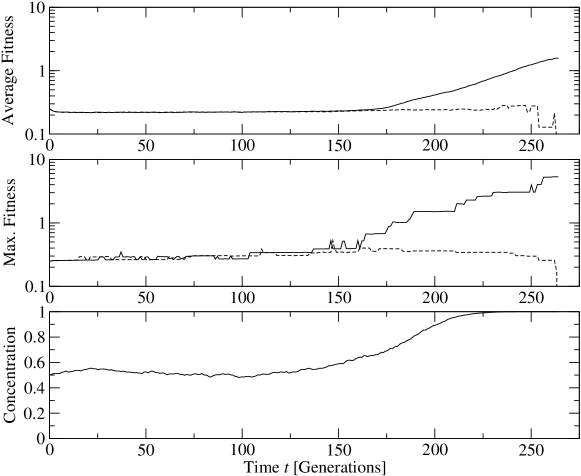
Typical competition dynamics for the three strains are displayed in Figs. 3-5. In all three figures, I show the average and maximum fitness of the winning and the losing clone as a function of time, as well as the relative concentration of the winning clone as a function of time.
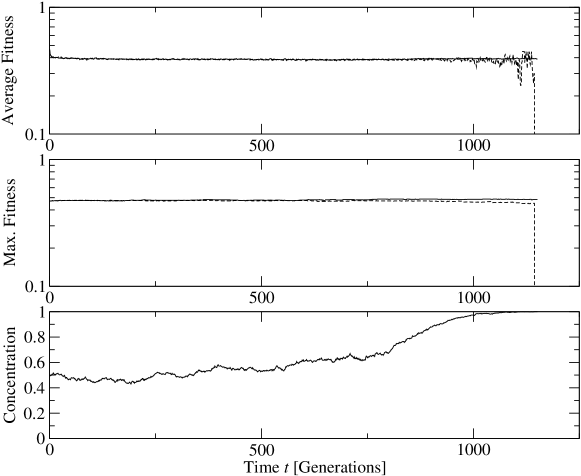
For strain A, average and maximum fitness of the two competing clones remained typically almost unchanged until the losing clone disappeared (Fig. 3). Changes in relative clone size were mostly due to genetic drift. However, the theoretical prediction Eq. (1) works only moderately well for the smallest population size, and overestimates the extinction times for the larger population sizes substantially (Fig. 2). I verified that this effect is not a shortcomming of the theoretical prediction by carrying out additional competition experiments with all mutations switched off (data not shown). For these experiments, the extinction data were in very good agreement with the theoretical prediction, which implies that the reduced extinction times in the competitions with mutations must be due to the accumulation of deleterious mutations. Indeed, in Fig. 3, we see that the maximum fitness of the losing clone is—after approximately 500 generations—consistently lower than the maximum fitness of the winning clone. Even though the difference in maximum fitness between the two clones is very small, it is sufficient to accelerate the extinction process. And the smaller the losing clone becomes, the more likely it is to experience even further reductions in its maximum fitness. The final stage of the competition is mutational meltdown [26]: Decreasing clone size accelerates loss of the highest fitness mutants, which in turn results in even further reduction of clone size. The clone decreases in size and loses fitness at an ever accelerating pace, until it has disappeared.
Fig. 3 clearly shows that mutational meltdown takes place towards the end of the competition and leads to a reduced extinction time. At first glance it is surprising that mutational meltdown should be responsible for the increasing deviations between theory and measured extinction times as the population size increases. After all, mutational meltdown is commonly associated with small population sizes. The reason why this effect here becomes more pronounced at larger population sizes is the following: When the relative difference in fitness between two mutants is smaller than the inverse of the population size, then these two mutants are effectively neutral, in the sense that they are equally affected by genetic drift. Therefore, larger population sizes can resolve finer fitness differences between mutants. In the case of strain A, the fitness difference between the winning and the losing clone is miniscule, so that at small population sizes, drift is the dominant factor. Once the population size is sufficiently large, however, this small fitness difference turns the population dynamic deterministic, and the clone that loses the fittest mutant first will slowly but surely disappear.
A competition between two clones of strain C typically started out just like one between two clones of strain A. However, often one of the two clones managed eventually to acquire a beneficial mutation with substantial selective advantage, and would then quickly exclude the other clone. Since beneficial mutations were fairly rare for strain A, the second clone did not have the chance to pick up an even better mutation in the short time that remained before it died out. Clearly, the time to the first beneficial mutation determined therefore the distribution of extinction times, unless it was much larger than the typical time to extinction by genetic drift. The time to the first beneficial mutation grows with decreasing population size, while the time to extinction by drift grows with increasing population size. The distributions of extinction times for strain C are determined by these two constraints: For , beneficial mutations are very rare, and the extinction times are dominated by the effects of drift. For , beneficial mutations are still rare, but nevertheless sufficiently abundant, so that the extinction times are clearly shorter than the ones for drift alone. Finally, for , beneficial mutations are so frequent that the time to extinction is on average even shorter than for .
Strain B showed a competition dynamic very similar to the one described by Solé et al. [6]. Both the marked and the unmarked clone gained substantially in fitness during the competition, and both clones would alternatingly take the lead in fitness gains (Fig. 5). However, this Red-Queen dynamic came at a price: The time to extinction of either clone was consistently shorter than for strains A or C. Apparently, the constantly changing relative growth rates of the two competing clones introduced increased fluctuations in the clone sizes, so that one of the clones was quickly reduced to a size at which it became prone to mutational meltdown, or was at least substantially impaired in its ability to acquire further beneficial mutations.
4 Conclusions
The location in fitness space from where a strain is taken has a strong influence on its competition dynamic. A clear arms race of mutants with ever increasing fitness can only be observed when beneficial mutations are abundant. When beneficial mutations are rare or completely absent, then either the clone that finds a beneficial mutation first wins or the clone that loses the highest-fitness mutant first loses. In general, it seems that a positive mutation rate will always reduce the competition time, so that the loser dies out earlier than it would in the absence of mutations. The Red-Queen dynamic, where both clones acquire mutants of ever increasing fitness, is particularly unstable. In this case, competitions last the shortest.
The results that I have presented here were obtained in computer experiments with digital organisms. Therefore, it is not a priori clear that my conclusions apply directly to RNA viruses. Nevertheless, I believe it is very likely that they do. In particular, the way in which RNA virus strains are typically prepared for competition experiments (frequent transfers at small population sizes, which leads to accumulation of deleterious mutations, and transfers to new environments, where many advantageous mutations can be acquired) are similar to my preparation of strain B. The fact that they show competition dynamics very similar to that of strain B is therefore reassuring. To test my other predictions in a virus system, one would need strains similar to A or C. In principle, it should be possible to prepare a virus strain which is located at or near the top of a fitness peak, by propagating the virus for a long time in a constant environment at a large effective population size. With such a strain, the competition dynamic should be more similar to my strain A, or maybe C, than B. If this turns out to be true, then competition experiments at various population sizes can be used as a reliable tool to map out the neighborhood in fitness space of a particular virus strain.
Acknowledgments
This work was supported by the NSF under contract No. DEB-9981397. I would like to thank D. A. Drummond for interesting discussions on coalescent theory, and C. Adami for helpful comments on the manuscript.
References
- [1] D. K. Clarke, E. A. Duarte, S. F. Elena, A. Moya, E. Domingo, and J. Holland. The red queen reigns in the kingdom of RNA viruses. Proc. Natl. Acad. Sci. USA, 91:4821–4824, 1994.
- [2] J. Quer, R. Huerta, I. S. Novella, L. Tsimring, E. Domingo, and J. J. Holland. Reproducible nonlinear population dynamics and critical points during replicative competitions of RNA virus quasispecies. J. Mol. Biol., 264:465–471, 1996.
- [3] G. Hardin. The competitive exclusion principle. Science, 131:1292–1297, 1960.
- [4] L. van Valen. A new evolutionary law. Evol. Theory, 1:1–30, 1973.
- [5] M. Ridley. The Red Queen: Sex and the Evolution of Human Nature. MacMillan, 1994.
- [6] R. V. Solé, R. Ferrer, I. González-García, J. Quer, and E. Domingo. Red queen dynamics, competition and critical points in a model of RNA virus quasispecies. J. theor. Biol., 198:47–59, 1999.
- [7] S. Kauffman. Origins of Order. Oxford University Press, Oxford, 1990.
- [8] M. Eigen and P. Schuster. The Hypercycle—A Principle of Natural Self-Organization. Springer-Verlag, Berlin, 1979.
- [9] M. Eigen, J. McCaskill, and P. Schuster. Molecular quasi-species. J. Phys. Chem., 92:6881–6891, 1988.
- [10] L. S. Tsimring, H. Levine, and D. A. Kessler. RNA virus evolution via a fitness-space model. Phys. Rev. Lett., 76:4440–4443, 1996.
- [11] I. M. Rouzine, J. Wakeley, and J. M. Coffin. The solitary wave of asexual evolution. Proc. Natl. Acad. Sci. USA, 100:587–592, 2003.
- [12] I. S. Novella, E. A. Duarte, S. F. Elena, A. Moya, E. Domingo, and J. J. Holland. Exponential increases of RNA virus fitness during large population transmissions. Proc. Natl. Acad. Sci. USA, 92:5841–5844, 1995.
- [13] R. E. Lenski and M. Travisano. Dynamics of adaptation and diversification: a 10,000-generation experiment with bacterial populations. Proc. Nat. Acad. Sci. USA, 91:6808–6814, 1994.
- [14] S. F. Elena, V. S. Cooper, and R. E. Lenski. Punctuated evolution caused by selection of rare beneficial mutations. Science, 272:1802–1804, 1996.
- [15] W. Fontana and P. Schuster. Continuity in evolution: on the nature of transitions. Nature, 280:1451–1455, 1998.
- [16] E. van Nimwegen, J. P. Crutchfield, and M. Mitchell. Statistical dynamics of the royal road genetic algorithm. Theoretical Computer Science, 229:41–102, 1999.
- [17] C. O. Wilke and C. Adami. The biology of digital organisms. Trends. Ecol. Evol., 17:528–532, 2002.
- [18] T. Ray. An approach to the synthesis of life. In C. G. Langton, C. Taylor, J. D. Farmer, and S. Rasmussen, editors, Artificial Life II, pages 371–408. Addison-Wesley, 1991.
- [19] C. Adami. Introduction to Artificial Life. Springer, New York, 1998.
- [20] R. E. Lenski, C. Ofria, T. C. Collier, and C. Adami. Genome complexity, robustness and genetic interactions in digital organisms. Nature, 400:661–664, 1999.
- [21] C. Adami, C. Ofria, and T. C. Collier. Evolution of biological complexity. Proc. Natl. Acad. Sci. USA, 97:4463–4468, 2000.
- [22] C. O. Wilke, J. L. Wang, C. Ofria, R. E. Lenski, and C. Adami. Evolution of digital organisms at high mutation rate leads to survival of the flattest. Nature, 412:331–333, 2001.
- [23] R. C. Griffiths. Lines of descent in the diffusion-approximation of neutral Wright-Fisher models. Theor. Pop. Biol., 17:37–50, 1980.
- [24] P. Donnelly. The transient behaviour of the Moran model in population genetics. Math. Proc. Cambridge Philos. Soc., 95:349–358, 1984.
- [25] S. Tavaré. Line-of-descent and genealogical processes, and their applications in population genetics models. Theor. Pop. Biol., 26:119–164, 1984.
- [26] M. Lynch and W. Gabriel. Mutation load and the survival of small populations. Evolution, 44:1725–1737, 1990.