Relativistic many-body calculations of excitation energies and transition rates from core-excited states in copperlike ions
Abstract
Energies of , , and states for Cu-like ions with = 30 -100 are evaluated to second order in relativistic many-body perturbation theory (RMBPT) starting from a Ni-like Dirac-Fock potential. Second-order Coulomb and Breit-Coulomb interactions are included. Correction for the frequency-dependence of the Breit interaction is taken into account in lowest order. The Lamb shift correction to energies is also included in lowest order. Intrinsic particle-particle-hole contributions to energies are found to be 20-30% of the sum of one- and two-body contributions. Transition rates and line strengths are calculated for the electric-dipole (E1) transitions in Cu-like ions with nuclear charge = 30 - 100. RMBPT including the Breit interaction is used to evaluate retarded E1 matrix elements in length and velocity forms. First-order RMBPT is used to obtain intermediate coupling coefficients and second-order RMBPT is used to calculate transition matrix elements. A detailed discussion of the various contributions to the dipole matrix elements and energy levels is given for copperlike tungsten ( = 74). The transition energies used in the calculation of oscillator strengths and transition rates are from second-order RMBPT. Trends of the transition rates as functions of are illustrated graphically for selected transitions. Comparisons are made with available experimental data. These atomic data are important in modeling of M-shell radiation spectra of heavy ions generated in electron beam ion trap experiments and in M-shell diagnostics of plasmas.
pacs:
31.15.Ar, 31.15.Md, 31.25.Jf, 32.30.RjI Introduction
This work further develops the application of the relativistic many-body perturbation theory (RMBPT) to the studies of atomic characteristics of particle-particle-hole excitations of closed-shell ions. Recently, RMBPT calculations of energies Safronova et al. (2002a) and transition rates Safronova et al. (2002b) in Na-like ions have been performed. The present paper focuses on the RMBPT calculations of energies and transition rates in Cu-like ions. These transitions form satellite lines to the brightest Ni-like ions and are of a great importance for M-shell diagnostics of heavy ions.
The second-order RMBPT calculations for Cu-like ions start from a [Ni] Dirac-Fock potential. All possible holes and particles leading to 563 odd-parity and 571 even-parity states are considered. The energies of the 1134 states and transition probabilities of the 2294 electric-dipole lines are calculated for Cu-like ions with = 30-100. Transitions from the , , and states to the ground () or singly excited () states (with ) form satellite lines to the bright electric-dipole (E1) lines in Ni-like ions. These core-excited states (or often called doubly-excited states) in copperlike ions have been studied extensively both experimentally and theoretically in the past 15-20 years.
Experimentally, these configurations have been studied by photon and electron emission spectroscopy. To our knowledge, the first measurements of transitions in Cu-like W and Tm were done by Klapisch et al. (1981) by classification of x-ray spectra from laser produced plasmas in the range 6 - 9 Å. It was shown that most of the Cu-like line radiation came from , , , and transitions. Wavelengths and transition probabilities were calculated in Klapisch et al. (1981) by the relativistic parametric potential method Klapisch et al. (1977). The same method was extended by Mandelbaum et al. (1983) to study x-ray spectra from laser produced plasmas of atoms from Tm ( = 69) up to Pt ( = 78). An extended analysis of x-ray spectra of laser produced gold plasmas has been performed by Busquet et al. (1985) including , , and transitions in Ni-, Co-, Cu-, Zn-, and Ga-like Au. The Ni-, Co-, Cu-, Zn-, Ga-, Ge-, and As-like isoelectronic sequences have been considered in Ref. Tragin et al. (1988) to investigate the x-ray spectra of laser-irradiated elements from tantalum ( = 73) to lead ( = 82). In addition to the above mentioned isoelectronic sequences, the Fe- and Mn-like states have been included by Zigler et al. (1994) to analyze x-ray spectra emmited by laser-produced plasmas of lanthanum ( = 57) and praseodymium ( = 59). The wavelengths and transition probabilities have been calculated in Busquet et al. (1985); Tragin et al. (1988); Zigler et al. (1994) by the relativistic parametric potential method Klapisch et al. (1977). Investigation of the x-ray spectrum emitted by laser produced barium plasmas has been recently described by Doron et al. (1998a, b). The RELAC relativistic atomic code Klapisch et al. (1977) has been used to identify ( = 4 to 8), , and transitions of Ni-like Ba28+ and corresponding satellite transitions in neighboring ionization states: Fe-, Co-, Cu-, Zn-, Ga-, and Ge-like ions. The X-ray spectrum emitted by a laser produced cerium plasma in the range 7.5 - 12 Å has been recently investigated in detail by Doron et al. (2000, 2001). The RELAC computer code Klapisch et al. (1977) has been used to study x-ray spectra from highly charged tungsten ions in tokamak plasmas in the range 7 - 10 Å Neu et al. (1997).
In the present paper, RMBPT is implemented to determine energies of , , and states for Cu-like ions with nuclear charges in the range of = 30 –100. The calculations are carried out to second order in perturbation theory and include second-order Coulomb and Breit interactions. Corrections for the frequency-dependent Breit interaction are taken into account in the lowest order. Screened self-energy and vacuum polarization data given by Kim et al. (1991) are used to determine the QED correction.
RMBPT is used to evaluate matrix elements, line strengths, and transition rates for 2294 allowed and forbidden electric-dipole transitions between the 1332 even-parity core-excited states [Ni]( + [Ni](, and the singly excited [Ni]() states and the 962 odd-parity core-excited states [Ni]( + [Ni]( and the ground state [Ni]() together with the singly excited [Ni]() states in Cu-like ions with nuclear charges ranging from = 30 to 100. Retarded E1 matrix elements are evaluated in both length and velocity forms. These calculations start from a [Ni] Dirac-Fock potential. First-order perturbation theory is used to obtain intermediate coupling coefficients and second-order RMBPT is used to determine transition matrix elements. The transition energies employed in the calculations of line strengths and transition rates are derived from second-order RMBPT.
| -0.247886 | 0.104563 | 0.025088 | -0.118235 | ||
| -0.226244 | 0.113517 | 0.020801 | -0.091926 | ||
| -0.237415 | 0.076978 | 0.029703 | -0.130734 | ||
| -0.237415 | 0.124305 | 0.021436 | -0.091674 | ||
| -0.240289 | 0.122424 | 0.028030 | -0.089836 | ||
| -0.236161 | 0.031594 | 0.009588 | -0.194980 | ||
| -0.236161 | 0.001311 | -0.002282 | -0.237132 | ||
| -0.251460 | 0.040039 | 0.036490 | -0.174931 | ||
| -0.251460 | 0.060163 | 0.026395 | -0.164902 | ||
| -0.229530 | 0.067699 | 0.039638 | -0.122194 |
| coupling | |||||
|---|---|---|---|---|---|
| -25.954298 | -0.013561 | -0.112483 | 0.069035 | -26.011307 | |
| -24.879634 | -0.005093 | -0.090398 | 0.065104 | -24.910021 | |
| -22.639268 | -0.054704 | -0.090313 | 0.073682 | -22.710603 | |
| -21.914637 | -0.057899 | -0.125159 | 0.073518 | -22.024177 | |
| -16.127594 | 0.032360 | -0.088446 | -0.001127 | -16.184807 | |
| -14.892864 | -0.001171 | -0.108506 | 0.001320 | -15.001221 | |
| -14.149853 | 0.000699 | -0.136464 | 0.003373 | -14.282246 | |
| -13.066261 | -0.033638 | -0.123168 | 0.007346 | -13.215720 | |
| -12.799288 | -0.034773 | -0.108188 | 0.050678 | -12.891570 | |
| -12.654131 | -0.048963 | -0.119286 | 0.050671 | -12.771709 |
| [– ] transitions | ||||||||
|---|---|---|---|---|---|---|---|---|
| 0.047738 | 0.044870 | 0.002168 | -0.000123 | -0.000050 | 0.001693 | 0.047424 | 0.000014 | |
| 0.052275 | 0.049040 | 0.003284 | 0.000010 | -0.000034 | 0.002425 | 0.051930 | -0.000079 | |
| 0.041125 | 0.038959 | -0.001778 | 0.000268 | 0.000087 | -0.000826 | 0.041123 | 0.000270 | |
| 0.034757 | 0.032927 | -0.001517 | 0.000227 | 0.000074 | -0.000842 | 0.034756 | 0.000225 | |
| -0.067725 | -0.064364 | 0.000594 | 0.000439 | -0.000594 | 0.000216 | -0.066887 | -0.000685 | |
| -0.043751 | -0.041541 | -0.017203 | 0.000579 | -0.000761 | -0.015917 | -0.042845 | -0.000890 | |
| [– ] transitions | ||||||||
| 0.046223 | 0.043446 | 0.002084 | -0.000119 | -0.000054 | 0.001629 | 0.045918 | 0.000010 | |
| 0.048898 | 0.045873 | 0.002691 | 0.000010 | -0.000028 | 0.002093 | 0.048576 | -0.000065 | |
| 0.062272 | 0.058739 | 0.001399 | -0.000036 | 0.000201 | 0.001391 | 0.061840 | 0.000223 | |
| 0.189383 | 0.179458 | -0.008551 | -0.001590 | 0.000298 | -0.003992 | 0.187961 | 0.000470 | |
| -0.146695 | -0.139008 | 0.006235 | 0.001231 | -0.000236 | 0.003225 | -0.145594 | -0.000376 | |
| 0.146008 | 0.138475 | -0.007222 | -0.000623 | 0.000324 | -0.003488 | 0.145197 | 0.000535 | |
| First order | RMBPT | |||
| Upper level | ||||
| [– ] transitions | ||||
| 0.002056 | 0.001818 | 0.002152 | 0.002151 | |
| 0.019622 | 0.017609 | 0.017775 | 0.017794 | |
| 0.004205 | 0.003780 | 0.003862 | 0.003865 | |
| 0.071111 | 0.063933 | 0.065253 | 0.065476 | |
| 0.009202 | 0.008321 | 0.009124 | 0.009165 | |
| 0.001041 | 0.000942 | 0.001092 | 0.001093 | |
| [– ] transitions | ||||
| 0.003858 | 0.003437 | 0.004065 | 0.004078 | |
| 0.006774 | 0.006079 | 0.006224 | 0.006230 | |
| 0.014631 | 0.013129 | 0.013505 | 0.013423 | |
| 0.003732 | 0.003355 | 0.003401 | 0.003407 | |
| 0.057817 | 0.051983 | 0.052786 | 0.052932 | |
| 0.006813 | 0.006127 | 0.006215 | 0.006210 | |
II Method
Details of the RMBPT method were presented in Ref. Safronova et al. (2002a) for calculation of energies of particle-particle-hole states and in Ref. Safronova et al. (2002b) for calculation of radiative transition rates from particle-particle-hole state to one-particle state. Differences between calculations for Na-like and Cu-like ions are due to the increased size of the model space ( instead of ) and differences in the Dirac-Fock potential ( instead of ), leading to 1134 states instead of 106 and more laborious numerical calculations.
As a first step, we determine and store the single-particle contributions to the energies for five =3 hole states (, , , , and ) and the seven =4 valence states (, , , , , , and ) in lowest, first, and second orders. Next, we evaluate and store the 664 two-particle matrix elements and the 1127 hole-particle matrix elements of the effective Hamiltonian in first and second orders. It should be noted that these one-particle, two-particle, and hole-particle matrix elements were used previously to evaluate energies of the levels in Zn-like ions Safronova (2000) and energies of the levels in Ni-like ions Safronova et al. (2000). Finally, second-order particle-particle-hole matrix elements are evaluated Safronova et al. (2002a). Combining these data using the method described below, we calculate one-, two-, and three-body contributions to the energies of Cu-like ions.
The calculations are carried out using sets of basis Dirac-Hartree-Fock (DHF) orbitals. The orbitals used in the present calculation are obtained as linear combinations of B-splines. These B-spline basis orbitals are determined using the method described in Ref. Johnson et al. (1988). Forty B-splines of order of eight for each single-particle angular momentum state are used and all orbitals with orbital angular momentum are included in the basis set.
II.1 Model space
The model space for core-excited states of copperlike ions includes 563 odd-parity states consisting of 78 =1/2 states, 131 =3/2 states, 143 =5/2 states, 125 =7/2 states, and 86 =9/2 states. Additionally, there are 571 even-parity states consisting of 78 =1/2 states, 131 =3/2 states, 148 =5/2 states, 125 =7/2 states, and 89 =9/2 states. The distribution of some of the 1134 states in the model space is summarized in Table I of the accompanying EPAPS document EPA .
II.2 Energy-matrix elements
The evaluation of the second-order energies for the states in Cu-like ions follows the pattern of the corresponding calculation for Zn-like and Ni-like ions given in Refs. Safronova (2000); Safronova et al. (2000). In particular, we use the second-order one- and two-particle matrix elements for Zn-like ions calculated in Safronova (2000) and hole-particle matrix elements for Ni-like ions calculated in Safronova et al. (2000), but recoupled as described below, to obtain the one- and two-particle contributions for Cu-like ions. We will discuss how these matrix elements are combined to obtain the one- and two-particle contributions to energies of Cu-like ions. We refer the reader to Ref. Safronova (2000); Safronova et al. (2000) for a discussion of the how the basic one- and two-particle matrix elements were evaluated. An intrinsic particle-particle-hole diagram also contributes to the second-order energy for Cu-like ions. It should be noted that the angular part of the expression for the particle-particle-hole diagram differs from the corresponding expression for the three-particle matrix elements given in Ref. Safronova et al. (1996). A detailed discussion of this difference is given in Ref. Safronova et al. (2002a).
Table 1 (see also Table II of EPA ) provides an illustration of various contributions to the second-order energies for the special case of Cu-like tungsten, = 74. In this table, we show the one-body, two-body and three-body second-order Coulomb contributions to the energy matrix labelled as , = 1, 2, 3, The one-body second-order energy, is obtained as the sum of the two valence and one hole energies. The values of are non-zero only for diagonal matrix elements. Even for odd-parity states with =1/2 there are 78 diagonal and 6006 non-diagonal matrix elements for core-excited states. We list data only for the first ten diagonal matrix elements of odd-parity states with =1/2 in Table 1 (a more complete set of data is given in Table II of EPA ). It can be seen from the table that two-body and three-body second-order contributions are positive, when the one-body contributions are negative. The three-body contributions give about 20% in the total second-order contributions. The values of the and non-diagonal contributions are smaller than values of diagonal contributions by factor of 3-5.
After evaluating the energy matrices, eigenvalues and eigenvectors are calculated for states with given values of and parity. There are two possible methods to carry out the diagonalization: (a) diagonalize the sum of zeroth- and first-order matrices, then calculate the second-order contributions using the resulting eigenvectors; or (b) diagonalize the sum of the zeroth-, first- and second-order matrices together. Following Ref. Safronova et al. (1996), we choose the second method here.
Table 2 lists the energies of ten excited states of W45+ from Table 1 including the total energies . The latter is the sum of the following contributions: = ++, the second-order Coulomb and Breit energy , and the QED correction . The QED correction is approximated as the sum of the one-electron self energy and the first-order vacuum-polarization energy. The screened self-energy and vacuum polarization data given by Kim et al. Kim et al. (1991) are used to determine the QED correction (see, for detail Ref. Safronova et al. (2002a)). As can be seen, the second order correction contributes to the total energy from 0.4 % for lowest levels up to 8 % for high-excited levels. The levels in this table (see also Table III of EPA ) could be divided into groups corresponding to excited states and hole states.
| coupling | coupling | |||||
| [– ] transitions | ||||||
| 5.919 | 5.9248 | 2.763[14] | 5.9110 | 3.020[14] | ||
| 5.912 | 5.9200 | 1.735[14] | 5.9069 | 1.786[14] | ||
| 5.752 | 5.7589 | 1.863[14] | 5.7578 | 1.832[14] | ||
| 5.744 | 5.7512 | 2.824[14] | 5.7501 | 3.295[14] | ||
| 5.718 | 5.7291 | 7.026[14] | 5.7274 | 7.954[14] | ||
| 5.715 | 5.7239 | 8.195[14] | 5.7243 | 9.738[14] | ||
| 5.615 | 5.6347 | 9.915[13] | 5.6419 | 1.003[14] | ||
| 5.230 | 5.2409 | 3.212[14] | 5.2322 | 3.023[14] | ||
| 5.222 | 5.2328 | 1.289[14] | 5.2252 | 1.288[14] | ||
| [– ] transitions | ||||||
| 5.912 | 5.9175 | 4.245[14] | 5.9093 | 5.406[14] | ||
| 5.910 | 5.9179 | 2.314[14] | 5.9074 | 2.855[14] | ||
| 5.752 | 5.7544 | 5.714[13] | 5.7407 | 1.497[14] | ||
| 5.732 | 5.7349 | 1.680[14] | 5.7206 | 6.059[14] | ||
| 5.723 | 5.7325 | 1.235[15] | 5.7256 | 8.290[14] | ||
| 5.722 | 5.7267 | 4.256[14] | 5.7210 | 7.570[14] | ||
| 5.719 | 5.7268 | 2.074[14] | 5.7130 | 4.057[13] | ||
| 5.233 | 5.2431 | 1.086[14] | 5.2354 | 7.306[13] | ||
| 5.230 | 5.2400 | 2.323[14] | 5.2548 | 2.845[14] | ||
| 5.229 | 5.2395 | 1.825[14] | 5.2546 | 1.680[14] | ||
| Transition | ||||
|---|---|---|---|---|
| Cu-like Ce, =58 | ||||
| 9.4558 | 4.16[13] | 9.452a | ||
| 9.9569 | 8.32[12] | 9.940a | ||
| 10.0518 | 1.58[13] | 10.051a | ||
| 10.1114 | 1.96[13] | 10.111a | ||
| 10.1435 | 3.52[13] | 10.141a | ||
| 11.3223 | 8.62[11] | 11.321a | ||
| 11.4202 | 7.77[12] | 11.412a | ||
| 11.4912 | 1.24[14] | 11.491a | ||
| 11.8120 | 1.64[13] | 11.816a | ||
| Cu-like W, =74 | ||||
| 6.8197 | 2.83[12] | 6.816b | ||
| 6.8269 | 4.26[12] | 6.827b | ||
| 6.8577 | 2.32[12] | 6.858b | ||
| 6.8885 | 3.93[12] | 6.884b | ||
| 6.8947 | 1.89[12] | 6.896b | ||
| 7.0724 | 3.41[13] | 7.075b | ||
| 7.1095 | 1.31[12] | 7.108b | ||
| 7.1117 | 6.78[12] | 7.113b | ||
| 7.1302 | 1.96[13] | 7.131b | ||
| 7.1354 | 1.59[13] | 7.137b | ||
| 7.2396 | 1.61[12] | 7.242b | ||
| 7.2479 | 2.06[13] | 7.248b | ||
| 7.2608 | 1.58[13] | 7.262b | ||
| 7.2916 | 1.64[13] | 7.293b | ||
| Cu-like Au, =79 | ||||
| 4.3974 | 1.65[14] | 4.39c | ||
| 4.4690 | 1.79[14] | 4.69c | ||
| 4.7690 | 1.66[14] | 4.76c | ||
| 4.7997 | 4.53[15] | 4.80c | ||
| 4.8214 | 1.98[15] | 4.82c | ||
| 4.9373 | 2.51[14] | 4.93c | ||
| 4.9610 | 2.58[14] | 4.96c | ||
| 5.2208 | 1.15[13] | 5.22c | ||
| 5.7207 | 2.08[12] | 5.72c | ||
| 5.9029 | 3.93[13] | 5.90c | ||
| 5.9427 | 2.10[13] | 5.94c | ||
| 6.0107 | 1.28[12] | 6.01c | ||
| 6.0801 | 1.61[13] | 6.08c | ||
II.3 Dipole matrix element
We designate the first-order dipole matrix element by , the Coulomb-correction to the second-order matrix element , and the second-order Breit correction . The evaluation of , , and for Cu-like ions follows the pattern of the corresponding calculation for Na-like ions in Ref. Safronova et al. (2002b). These matrix elements are calculated in both length and velocity gauges.
Table 3 lists values of uncoupled first-and second-order dipole matrix elements , , , together with derivative terms for Cu-like tungsten, = 74. For simplicity, only the values for the selected dipole transitions between odd-parity states with = 1/2 and the ground and excited states are presented. The more comprehensive set of data is given in Table IV of EPA ). The derivative terms shown in Table 3 arise because transition amplitudes depend on energy, and the transition energy changes order-by-order in RMBPT calculations. Both length () and velocity () forms are given for the matrix elements. We find that the first-order matrix elements and differ by 10%; the - differences between second-order matrix elements are much larger for some transitions. The term in length form almost equals in length form but in velocity form is smaller than in length form by three to four orders of magnitude.
Values of line strengths calculated as a square of coupled reduced matrix element Safronova et al. (2002b) in length and velocity forms are given in Table 4 for the selected dipole transitions between odd-parity states with = 1/2 and the ground and excited states. A more complete set of data is given Table V of EPA . Although we use an intermediate-coupling scheme, it is nevertheless convenient to label the physical states using the scheme. We see that and forms of the coupled matrix elements in Table 4 differ only in the third or fourth digits. These – differences arise because our RMBPT calculations start with a non-local Dirac-Fock (DF) potential. If we were to replace the DF potential by a local potential, the differences would disappear completely. The first two columns in Table 4 show and values of line strengths calculated in the first-order approximation which differ by factor of 10. Thr last two columns indicate that including of the second-order contribution almost removes the differences.
III Results and comparisons with other theory and experiment
We calculate energies of core-excited even-parity as well as the singly excited states in Cu-like ions with = 30 -100. Reduced matrix elements, line strengths, oscillator strengths, and transition rates are also determined for electric dipole transitions between the above mentioned core-excited and singly excited states in Cu-like ions for the same range of .
Table 5 lists theoretical data for selected transitions from core-excited levels to the ground and a singly excited levels with largest values of transition rates in W45+. Also, the comparison of theoretical data produced by the different methods and codes is inlcuded. Specifically, three values for wavelengths: , , and are compared. The first values, , were obtained as the first-order RMBPT values. It can be seen from Table 5 that the results obtained by cowan code cow , , better agree with the MCDF results, than with the RMBPT results, .
cowan code cow gives results which are generally in good agreement with experimental energies by scaling the electrostatic Slater parameters to include the correlation effects (Refs. Sataka et al. (2002)) and here the scaling factor of 0.85 was used. Also, in cowan code the coupling scheme is implemented and corresponding designations were added to designations in all tables which include comparisons with theoretical data produced by cowan code.
A comprehensive set of theoretical data and comparisons for transitions with largest values of transition rates in W45+ similar to presented in Table 5 is given in Table VI of the accompanying EPAPS document EPA . It includes transitions from core-excited levels not only to the ground and to one singly excited level as in Table 5 but to all singly excited levels.
The similar comprehensive set of theoretical data and comparisons for transitions between core-excited states to the ground and singly excited states is presented for Ce29+ ion in Table VII of Ref. EPA and for Au50+ ion in Table VIII of Ref. EPA . Comparisons with theoretical data obtained by using RMBPT, MCDF, and cowan codes show that the difference in results can be explained by the second-order corrections to energy and dipole matrix elements included in RMBPT.
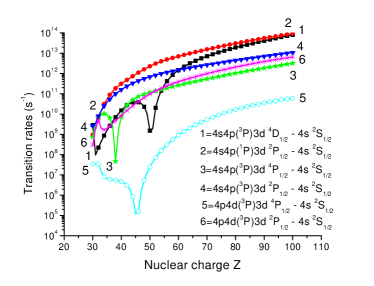
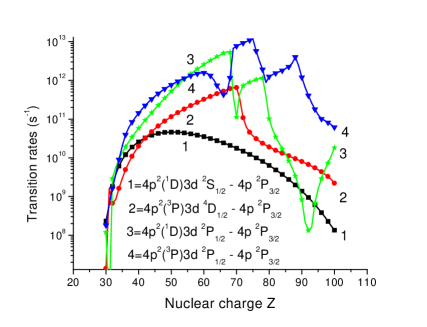
The trends of the -dependence of transition rates for the transitions from core-excited odd-parity states with = 1/2 to the ground state states are presented in Fig. 1 . The trends for the transitions from core-excited even-parity states with = 1/2 to the singly excited state are shown in Fig. 2. More transition rate figures are given in EPA .
We see from the graphs that transitions with smooth -dependence are rarer than transitions with sharp features. Smooth -dependence occurs for transitions from doublet and quartet core-excited states. Usually, singularities happen in the intermediate interval of = 40 - 60 when neither nor coupling schemes describe the states of these ions properly. One general conclusion that can be derived from these graphs is that the smooth -dependence occurs more frequently for transitions from low-lying core-excited states.
Singularities in the transition-rate curves have two distinct origins: avoided level crossings and zeros in dipole matrix elements. Avoided level crossings result in changes of the dominant configuration of a state at a particular value of and lead to abrupt changes in the transition rate curves when the partial rates associated with the dominant configurations below and above the crossing point are significantly different. Zeros in transition matrix elements lead to cusp-like minima in the transition rate curves. Examples of each of these two singularity types can be seen in Figs. 1 and 2, as well as in Figs. 1 - 10 presented in EPAPS document EPA .
In Table 6, wavelengths and electric-dipole transition rates along with comparison with experimental data are presented for transitions in Cu-like Ce, W, and Au. The table is limited to identification of experimentally measured transitions given in Refs. Doron et al. (2001); Mandelbaum et al. (1983); Busquet et al. (1985). A more comprehensive set of theoretical data assigned to each experimental transition is presented in Table IX of EPAPS document EPA . We mentioned previously that all possible - transitions produce 2294 spectrum lines. These lines in Ce29+, W45+, and Au50+ cover the spectral regions from 6.8 – 21.9 Å , 3.5 – 9.8 Å , and 2.9 – 8.7 Å , respectively. A number of spectral lines becomes smaller by a factor of ten when we consider transitions with largest values of transition rates, . The number of transitions with 1013 s-1 is about 200 for Ce29+, and a number of transitions with 1014 s-1 is about 130 for W45+ and about 190 for Au50+. Those transitions with the largest values of cover the spectral regions smaller by factor of 3-4 than that mentioned for all lines. We can see that the number of predicted spectral lines even with the largest values of still much larger than a number of experimental lines shown in Table 6. Also, the interval between these lines is about 0.01 Å or less which is comparable with the accuracy of experimental measurements. In this case, it could be reasonable to assign not a single transition as in Table 6 but 3-5 transitions to identify the experimental peak, as it is demonstrated in Table IX of EPAPS document EPA .
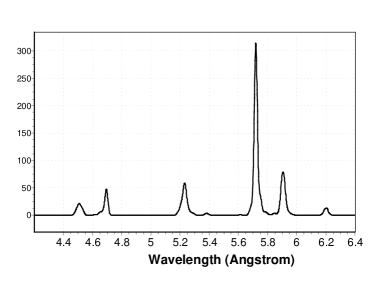
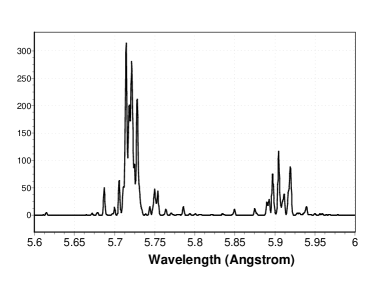
These atomic data are important in modeling of M-shell radiation spectra of heavy ions generated in electron beam ion trap experiments and in M-shell diagnostics of plasmas. For example, x-ray M-shell spectra of W ions collected at the different energies of the electron beam at LLNL electron beam ion trap indicate the existence of strong Cu-like spectral features Shlyaptseva et al. (2003). Also,the distinct features of x-ray M-shell spectra of W ions in a spectral region from 5 to 6 Å produced by laboratory plasmas are the brightest Ni-like lines and Co- and Cu-like spectral features. In particular, Cu-like satellite lines constitute most of the Cu-like spectral features, and Cu-like autoionization levels make an important contribution in ionization balance calculations Shlyaptseva et al. (2002). Synthetic x-ray spectra of Cu-like W computed with different resolution of 0.02 Å and 0.002 Å are presented in Fig. 3 and 4, respectively. It was assumed that spectral lines have the intensities proportional to the weighted transition probabilities and are fitted with the Gaussian profile. Specifically, the spectrum in Fig. 3 includes transitions and covers the spectral region from 4 Å to 6.4 Å. The most intense peaks at about 5.72 Å and 5.9 Å are formed by transitions and are shown with better resolution in Fig. 4.
IV Conclusion
In summary, a systematic second-order RMBPT study of the energies and transition rates for [ - ] electric-dipole transitions in Cu-like ions with the nuclear charges ranging from 30 to 100 has been presented. The retarded matrix elements included correlation corrections from Coulomb and Breit interactions. Both length and velocity forms of the matrix elements were evaluated and small differences (0.4 - 1 %), caused by the non locality of the starting DF potential, were found between the two forms. Second-order RMBPT transition energies were used in the evaluation of transition rates. These calculations were compared with other calculations and with available experimental data. For , we believe that the present theoretical data are more accurate than other theoretical or experimental data for transitions between the core-excited states and the singly excited states in Cu-like ions. The results could be further improved by including third-order correlation corrections.These calculations are presented as a theoretical benchmark for comparison with experiment and theory. In addition, the application of generated atomic data to modeling and interpreting of x-ray M-shell spectra of heavy ions is discussed.
Acknowledgements.
The work of W.R.J. was supported in part by National Science Foundation Grant No. PHY-01-39928. U.I.S. acknowledges partial support by Grant No. B516165 from Lawrence Livermore National Laboratory. The work of A.S. was supported by the DOE-NNSA/NV Cooperative Agreement DE-FC08-01NV14050 and Sandia National Laboratories.References
- Safronova et al. (2002a) U. I. Safronova, W. R. Johnson, M. S. Safronova, and J. R. Albritton, Phys. Rev. A 66, 042506 (2002a).
- Safronova et al. (2002b) U. I. Safronova, W. R. Johnson, M. S. Safronova, and J. R. Albritton, Phys. Rev. A 66, 052511 (2002b).
- Klapisch et al. (1981) M. Klapisch, P. Mandelbaum, A. Bar-Shalom, J. L. Schwob, A. Zigler, and S. Jackel, J. Opt. Soc. Am. 71, 1276 (1981).
- Klapisch et al. (1977) M. Klapisch, J. L. Schwob, B. S. Fraenkel, and J. Oreg, J. Opt. Soc. Am. 67, 148 (1977).
- Mandelbaum et al. (1983) P. Mandelbaum, M. Klapisch, A. Bar-Shalom, and J. L. Schwob, Phys. Scr. 27, 39 (1983).
- Busquet et al. (1985) M. Busquet, D. Pain, J. Bauche, and E. Luc-Koenig, Phys. Scr. 31, 137 (1985).
- Tragin et al. (1988) N. Tragin, J. P. Ghendre, P. Monier, J. C. Gauthier, C.-P. C, J. F. Wyart, and C. Bauche-Arnoult, Phys. Scr. 37, 72 (1988).
- Zigler et al. (1994) A. Zigler, P. Mandelbaum, J. L. Schwob, and D. Mitnik, Phys. Scr. 50, 61 (1994).
- Doron et al. (1998a) R. Doron, M. Fraenkel, P. Mandelbaum, A. Zigler, and J. L. Schwob, Phys. Scr. 58, 19 (1998a).
- Doron et al. (1998b) R. Doron, E. Behar, M. Fraenkel, P. Mandelbaum, A. Zigler, J. L. Schwob, A. Y. Faenov, and T. A. Pikuz, Phys. Rev. A 58, 1859 (1998b).
- Doron et al. (2000) R. Doron, E. Behar, M. Fraenkel, P. Mandelbaum, J. L. Schwob, A. Zigler, A. Y. Faenov, and T. A. Pikuz, Phys. Rev. A 62, 052508 (2000).
- Doron et al. (2001) R. Doron, E. Behar, M. Fraenkel, P. Mandelbaum, J. L. Schwob, A. Zigler, A. Y. Faenov, and T. A. Pikuz, Phys. Scr. 63, 22 (2001).
- Neu et al. (1997) R. Neu, K. B. Fournier, D. Schlogl, and J. Rice, J. Phys. B 30, 5057 (1997).
- Kim et al. (1991) Y. K. Kim, D. H. Baik, P. Indelicato, and J. P. Desclaux, Phys. Rev. A 44, 148 (1991).
- Safronova (2000) U. I. Safronova, Mol. Phys. 98, 1213 (2000).
- Safronova et al. (2000) U. I. Safronova, W. R. Johnson, and J. R. Albritton, Phys. Rev. A 62, 052505 (2000).
- Johnson et al. (1988) W. R. Johnson, S. A. Blundell, and J. Sapirstein, Phys. Rev. A 37, 2764 (1988).
- (18) See EPAPS Document No. [number will be inserted by publisher ] for additional nine tables and ten figures. Tables I - IX. Possible particle-particle-hole states in the Cu-like ions; jj-coupling scheme. Uncoupled and coupled reduced matrix elements in length and velocity forms for transitions between the odd-parity core-excited states with J = 1/2 and the ground and singly-excited states. Wavelengths (in Angstrom) and transition rates (Ar in 1/sec) for transitions between core-excited states and excited states in Cu-like ions. Comparison with theoretical and experimental data Figs. 1-10. Transition rates for the transitions from core-excited odd-parity states with J = 1/2 – 7/2 and even-parity states with J = 1/2 - 9/2 as function of Z in Cu-like ions. This document may be retrieved via the EPAPS homepage (http://www.aip.org/pubservs/epaps.html) or from ftp.aip.org in the directory /epaps/. See the EPAPS homepage for more information.
- Safronova et al. (1996) M. S. Safronova, W. R. Johnson, and U. I. Safronova, Phys. Rev. A 54, 2850 (1996).
- (20) URL ftp://aphysics.lanl.gov/pub/cowan.
- Sataka et al. (2002) M. Sataka, M. Imai, K. Kawatsura, K. Komaki, H. Tawara, A. Vasilyev, and U. I. Safronova, Phys. Rev. A 65, 052704 (2002).
- Shlyaptseva et al. (2003) A. S. Shlyaptseva, D. A. Fedin, S. M. Hamasha, S. B. Hansen, C. Harris, V. L. Kantsyrev, P. Neill, N. Ouart, P. Beiersdorfer, and U. I. Safronova, Rev. Sci. Instr. 74, 00 (2003).
- Shlyaptseva et al. (2002) A. S. Shlyaptseva, S. M. Hamasha, S. B. Hansen, N. Ouart, and U. I. Safronova, AIP Proceedings CP651, 412 (2002).