Optics of Nanostructured Fractal Silver Colloids
Abstract
Based on the theory of the optical properties of fractal clusters, which is an operator-based modification of the coupled-dipole method, an alternate solution is proposed for the problem of adequately describing the evolution of optical spectra of any polydisperse silver colloid with particles falling within the range of most characteristic sizes ( nm). This is the range over which the results of the application of the well-known methods of classical electrodynamics, including the Mie theory, disagree with experimental data. The effect of variation of the parameters of such media on optical spectra is studied by a numerical simulation, which accounts for particle electrodynamic dipole-dipole interactions. Indeed, such interactions are shown to be a key factor in determining the broadening of the sol absorption spectra during the course of fractal aggregation. A quantitative explanation is given for the reasons for the appearance of individual specific features in the contours of the spectral absorption of different types of silver colloids.
KEYWORDS: colloid, fractal metal nanoaggregates, optical extinction spectra, laser-induced aggregation and photomodification, electrodynamics in nanoscale
PACS: 61.46.+w , 78.67.-n
1 INTRODUCTION
Since the famous Faraday’s tractates became available over a century ago, the question about the origin of the intense color of sols containing small noble metal particles has long been one of the most complex and still unsolved problems in the fields of colloid chemistry and the optics of dispersion media. The interest is motivated by the fact that optical spectra provide information about the most practically important physical characteristics of sols, such as the particle size and thickness of the adsorption layer. The spectra enable one to monitor the changes of the electronic structure of small particles when a transition from the bulk materials to clusters occurs. On the one hand, the color of such sols is explained by the true light absorption by the particles and is also affected by light scattering. For low-concentrated sols, the role of the latter factor is insignificant; however, despite this fact, all basic regularities associated with the dramatic changes in color are also observed in these sols 1 .
The most widespread viewpoint about this problem, beginning with the well-known work by Mie 2 , is based on the idea of the spectral selectivity of scattering and absorption, which is governed by the particle size. According to this work, variations in the optical spectra of noble metal colloids are associated with the dependence of the position of the maximum of absorption (scattering) band () on particle size, and the appearance of the long-wavelength wing in the absorption spectrum seems to have resulted from an arbitrary increase in the initial size of the particles in solution 2 , 3 , 4 , 5 , 6 . The restrictions imposed on the treatment of this effect within the framework of these representations were mainly reduced to the condition of preserving the spherical shape of the particles. It is this concept that is described in most current textbooks on colloid chemistry (see, for example, 7 ).
The Mie theory is most often used to interpret the optical spectra of metal sols, although in this case, the achievement of agreement between calculated and experimental spectra requires the existence of particles in a sol to fall within too wide a range of their sizes (8 and references therein). Here, the maximal particle size far exceeds the values characteristic of typical metal colloids. The large discrepancy with the experiment was explained mainly by the nonsphericity of real particles and the size dependence of the refractive index of metals 3 . Accounting for size effects in 5 made it possible to predict a larger (compared with 4 , 6 ) broadening of the absorption spectra of silver colloids in terms of the Mie theory. However, the existence of excessively large (100 nm and above) particles in these systems was still recognized.
The most serious discrepancies between interpretations based on the Mie theory were mentioned in our observations of the evolution of absorption spectra of various silver hydrosols containing spherical particles with a diameter of about nm 1 , where in one of these sols, particles sizes were varied, whereas in another they were kept constant. Despite this, the spectral changes in hydrosols were similar in both cases. The same discrepancies were mentioned in 9 . In this work, the statistical function of the particle size distribution in gold and silver hydrosols was carefully monitored with the help of an electron microscope over the course of sharp broadening of absorption spectra and, correspondingly, of the variations in sol color. It was demonstrated 9 that, in this process, the particle size distribution restricted by the range nm remains virtually unchanged. This implies that, in this work, the role of the variation in particle size can be considered insignificant. In this connection, it is reasonable to cite data 10 stating that, for aerosol sediments of silver particles, the wavelength of the surface plasmon is practically independent of over the range nm. This is also supported by the data reported in 6 , which shows that, over the range nm, the calculated shift of the resonant wavelength is only 15 nm, whereas the experimentally observed shift in aggregating silver hydrosols, having the aforementioned particle sizes, is above 400 nm.
The dependence of on over the range of smaller particle sizes nm was demonstrated in 5 , 6 , 11 ; moreover, for some particle sizes, this dependence can be reversed. However, the absolute values of the shifts are also small. The problem of the size dependence of the frequency of resonant absorption is reviewed in detail in 9 , 10 . In general, the authors of these reviews note that many theoretical and experimental results often contradict each other, thus confirming that adequate theories are still absent in this field of research.
In the background of the unresolved controversies regarding the optics of dispersion media, a new approach to describe optical properties of colloids has been initiated by Shalaev, Stockman, Markel, et al. 12 , 13 . In these works, the theory of optical properties of fractal clusters (OPFC) is provided, which accounts exactly for particle electrodynamic interactions. In accordance with this theory, the main reason for the broadening of spectra of colloids is the particle aggregation. Precisely the same conclusion on the role of aggregation was drawn as far back as a half of century ago by a number of researchers (for example, see 14 ). The same viewpoint is shared by the authors of the aforementioned work 9 , and only the absence of a theoretical basis did not allow them to provide a substantial explanation of the results obtained. This idea is favored in a number of recent publications, in particular in 15 , 16 .
The appearance of optical coupling of the particles in the aggregated sols is most pronounced at the Frölich frequency, associated with the lowest-order surface mode. Over recent decades, considerable progress has been made in the development of theoretical models of optical absorption by the aggregated sols based on the exact solution of the electrodynamical problem associated with coupled spherical particles 17 , 18 , 19 , 20 , 21 , 22 . However, because the exact solution of the problem is difficult to find, a more simple method of coupled dipoles 23 , 24 , 25 , 26 is often used based on the approximation of the particles by discrete interacting dipoles 27 , 28 , 29 . Note that basic model concepts about the outlined methods were formulated by De Voe (30 , 31 ) and employed for calculations of the polarizabilities of the molecular aggregates. A very effective operator approach to the method of coupled dipoles was developed by Shalaev, Stockman and Markel 13 , 32 (see also the review in 33 and references therein). These authors were the first to apply the method of coupled dipoles to the colloid metal sol aggregates. The principal importance of accounting for the fractal geometry of these aggregates was revealed, and various models and approximations were developed including an exact theory of the optical properties of fractal clusters. The application of this method to silver colloids enabled an increased of the accuracy of the description of their spectra to a level not achievable with alternative methods.
It is known that particle aggregation in colloids is accompanied by the formation of fractal structures, which are assembled from the main portion of the initially-isolated particles in the process of sol evolution (see 1 ). Only the fractal approach to describing sol properties made it possible to gain new insight into well-known facts not restricted just to the optical properties of fractal nanostructures (for example, see 32 , 33 ). In particular, it was confirmed 12 , 13 , 32 , 33 that some features of the strong influence of neighboring particles are observed in the spectra of any particles comprising fractal aggregates (or fractal clusters). This leads to a noticeable shift in the frequency of the intrinsic optical resonance of particles (). The reason for the shift of resonant frequencies is associated with the dipole-dipole interaction between the light-induced (oscillating) dipole moments of each particle and the particles of the surrounding medium (with a dominating effect of the nearest particle). Since fractal objects do not possess translational invariance, they cannot transmit travelling waves. For this reason, optical dipole excitations in fractals tend to be localized in single particles, which is why different parts of a fractal (different particles) absorb light independently. This feature is responsible for the light-induced modification of fractal aggregates discovered in 34 . In approximating the pair interaction of particles, which allows us to explain clearly the essence of the theory of OPFC, the value of the frequency shift of intrinsic resonance of the th particle under the effect of the th particle (without exact account for the total contribution of the far-spaced particles) is inversely proportional to the third power of the distance between their geometrical centers (). We emphasize that it is precisely the interparticle distance that is the crucial parameter in the theory of OPFC.
In the present work, it will be shown that all the observed specific features of the adsorption spectra of silver colloids, as well as the reasons for the appearance of the long-wavelength wing, can be adequately explained in terms of the theory of OPFC, where the unique correlation between the structural and optical properties of fractal aggregates is expressed. The applicability of this approach, in addition to the aforementioned condition of the preservation of the spherical shape by the particles, is also restricted by the smallest admissible diameter , because this value ( nm) begins to determine the homogeneous width of the spectrum of the surface plasmon due to relaxation effects at the particle surface 10 , 11 , 35 :
| (1.1) |
where , is the relaxation constant of free electrons for a bulk silver specimen, and is the Fermi velocity. In this case, the term can become larger than . Evidently, should be, at least by several times, smaller than the width of the visible part of the spectrum , because at no visually registered spectral changes related to the aggregation in sols with such small particles can be observed, and the sols will preserve their gray color.
The purpose of this of this work is to carry out a detailed quantitative analysis of the effect of dipole-dipole interactions of the particles on the absorption spectrum of the colloids during the course of their aggregation into fractal structures. The analysis is performed through a numerical solution of the equations of the OPFC theory for a polydisperse ensemble of the coagulating particles.
2 MATHEMATICAL MODELS OF THE GROWTH OF FRACTAL AGGREGATES
In this work, to generate fractal aggregates, we used a 3-D model of cluster-cluster aggregation with the probability of irreversible coagulation of particles upon their collisions equal to 1. This condition decreases the counting time, with no effect on the value of the fractal dimension. As a rule, the total number of particles did not exceed 50 (this restriction was determined by the calculation time of the optical spectra). At the initial time, particles whose sizes fall within the range of nm were uniformly distributed over the space with volume ( nm) with an arbitrary selection of the direction of motion. The values of the initial velocities corresponded to the Maxwell distribution. A mean free path corresponding to the time of motion with no collision was introduced for each particle. Upon the collision and coagulation of particles, their intrinsic kinetic energy is transformed into the kinetic energy of translational and rotational motion of an aggregate. Under the regime of Brownian aggregation, the mass centers of the assembling aggregates move along broken linear trajectories. Two models of aggregation (spontaneous Brownian aggregation of electrically neutral particles and Coulombic aggregation of initially-charged particles with bipolar charge values of e, where e is the electron charge) were studied in this work. The existence of a particle charge is associated with the mechanism of mutual charging in a system 36 . In the case of mutual charging, the aggregation occurs due to both the short-range van der Waals interaction (), whose radius is determined by the condition , and to the long-range Coulombic interaction ( ).
The developed algorithm also allows us to calculate various characteristics of the forming aggregates, i.e., fractal dimension and degree of aggregation of a medium determined by the broadening of an absorption spectrum 37 ; to study the kinetics of aggregation as a function of the viscosity of a dispersion medium, the value of the particle charge and its sign, as well as of the characteristics of the incident light; to perform calculations with various functions of the particle size distribution (FPSD); and to change the position and width of the intrinsic particle resonance, particle bulk concentration, etc.
The value of the bipolar charges ( e) of the particles was determined by the condition of the excess of Coulombic interaction energy between particles separated by a mean distance (typical of a real hydrosol) over the energy of thermal motion (k). The calculated values of the fractal dimension of an aggregate for two regimes of aggregation are equal to for Brownian aggregation and for Coulombic aggregation, which is attributed to the differences in the kinetics of the aggregate growth. The half-time of aggregation 7 , 37 in the first case was times higher than in the second case.
3 SIMULATION OF OPTICAL SPECTRA OF FRACTAL AGGREGATES
3.1 Basic equations
Unlike the works employed the binary approximation, the algorithm developed in this work is based on the complete set of equations of the theory of OPFC 13 , where the authors considered the fractal composed of particles (with dipole-dipole interactions at optical frequencies) polarized by the external field and located at points . Then the dipole moments induced on different particles obey the system of equations
| (3.1) |
where , , is the dipole polarizability of a single particle, , and . If the sizes of the fractal aggregates are much smaller than the wavelength of an incident beam, the external field at the location of the th particle can be considered as uniform and independent of . In this case, the dipole moment induced on the th particle is expressed via the corresponding linear polarizability in the following form:
| (3.2) |
The problem consists in determining , because its imaginary part uniquely determines the light absorption by the th particle. As seen from (3.2), for this purpose it is necessary to find that solves the system of (3.1) with respect to this parameter. The solution to this system is performed in a matrix form. To this end, it is necessary to introduce the matrix with elements
This matrix acts in the -dimensional space of the vectors and, with components and . Upon introducing the new complex variable with real and imaginary parts and ,
| (3.3) |
the main system of (3.1) acquires the following form:
| (3.4) |
Because the matrix is symmetrical, it is reduced to the diagonal form via an orthogonal transformation,
| (3.5) |
where is the diagonal matrix of eigenvalues of , and is the matrix whose columns are the components of the eigenvectors of (the superscript denotes a transposition).
The dipole moment is determined with the help of (3.5) as
| (3.6) | |||||
and with allowance for (3.4) we obtain
| (3.7) |
Thus, expressing the desired values of via the eigenvalues of , and components of the corresponding intrinsic vectors , we find
| (3.8) |
Comparing (3.8) and (3.2), we obtain the expression
| (3.9) |
where and are the eigenvalues of the vector and matrix , respectively. The linear polarizability of the particle in an aggregate averaged over the particle number is equal to . Using symmetry with respect to rotations and the averaging over the entire aggregate orientations, the polarizability tensor is reduced to the following scalar:
| (3.10) |
Because the eigenvalues of , and components of the eigenvectors have real values, becomes the only complex number in this expression. Substituting (3.3) into (3.10), we obtain the following expression for the function describing the absorption spectrum of the fractal aggregate:
| (3.11) |
3.2 Dipole polarizability of a two-level system
If a particle has its resonance at a frequency , then for a dipole moment of the transition and relaxation rate (homogeneous halfwidth) , in the simplest case of a single resonance, the dipole polarizability of a particle can be described by the expression 12 , 32
| (3.12) |
where is the detuning of resonance, and is Plank’s constant. Comparing (3.12) and (3.3) yields expressions for and as
| (3.13) |
Here, has the meaning of relative frequency detuning, and determines the resonance width and amplitude. The expressions of (3.13) allow one, at a fixed value of , to obtain the functional dependence , and hence the absorption spectrum of an arbitrary aggregate with particle pair interactions at various values of its fractal dimension under conditions of linear response to the external field.
3.3 Polarizability with account for the frequency dependence of the permittivity of a material
The dipole polarizability of a sphere with radius corrected for the irradiation reaction can be described in greater detail by the expression reported in 32 , 33 with allowance for the spectral dependence of the optical constants of a material comprised by the particles,
| (3.14) |
where is the permittivity of the material (in this case, silver), is the permittivity of a disperse medium (water in the case of hydrosols, where =1.78 in the spectral region from 200 to 1000 nm), and is the wavenumber. Expressions for parameters and introduced into formulas (3.3) are represented in the following forms:
| (3.15) |
| (3.16) |
The permittivity of metal introduced into these expressions can be described by the Drude formula,
| (3.17) |
where accounts for the integral contribution to the permittivity of interband transitions, and is the plasma frequency.
4 RESULTS AND DISCUSSION
4.1 Pair interactions
In order to demonstrate the effect of the dipole-dipole interactions of the particles, Fig. 1 shows a set of curves calculated with the aid of the developed algorithm, which describes the main regularities of the evolution of the absorption spectrum of a pair of approaching particles as a function of the interparticle distance over the range nm (the initial spectrum corresponds to the surface plasmon in silver hydrosols). As has been shown in particular in 13 , the effect of a neighbor particle is manifested in the splitting of a characteristic single resonance (curve 11) of an initially isolated single particle and in the appearance of two peaks: low-frequency and high-frequency , with the ratio of their frequency shifts with respect to equal approximately to 1/2.
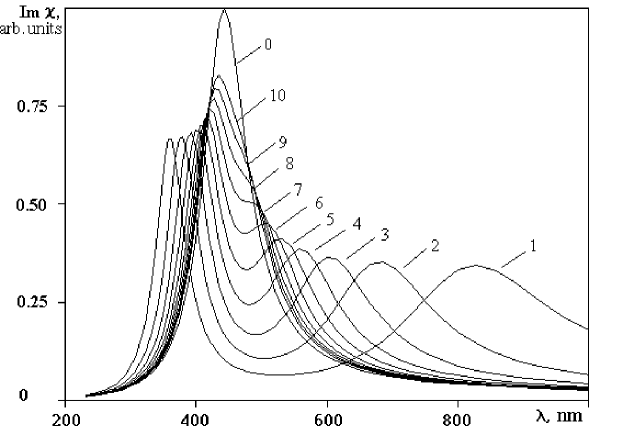
As seen from Fig. 1, at an interparticle distance exceeding 20 nm, spectral changes associated with pair interactions virtually vanish. At distances of less than 10 nm, the low-frequency peak approaches the long-wavelength boundary of the optical range and, upon further decrease in , falls outside the limits of this boundary. As decreases, a broadening of the low-frequency peak is also observed.
In the presented set of curves, attention should be paid to a rather large spectral shift of a low-frequency peak observed over the relatively-narrow range of variation in interparticle distances. We emphasize that the least possible values of these distances, , are limited by the sizes of the contacting particles, and .
The fact observed in this approach, that the value of the frequency shift of the resonant absorption of interacting particles is much more sensitive to the variation in their sizes, is worth special mention. This is explained by the higher power of such a dependence. For example, in the theory of OPFC (pair approximation), the value of the resonant shift of contacting particles is equal to , whereas the Mie theory results, according to data reported in 5 , 6 for silver sols, show an almost linear dependence of the value of the frequency shift of the spectral maximum of absorption on particle size (at least over the size range nm). In addition, an increase in the particle size leads, according to the theories of OPFC and Mie, to opposite spectral effects.
During the course of aggregate growth, the diversity of variants of the spatial environment of each specific particle increases, and the relative fraction of the particles brought into most intimate contact rises. This event is accompanied by a gradual increase in the extension of the long-wavelength wing of the spectrum.
The appearance of the short-wavelength wing of the spectrum of the fractal aggregate with a twice narrower bandwidth (at a frequency scale) is attributed to the appearance of a high-frequency peak for the interacting pairs (Fig. 1). However, the precise experimental registration of the shortwavelength broadening attributed to the surface plasmon of silver hydrosols is somewhat complicated due to the superposition of the band wing of interband absorption within the range nm and partial light absorption by a dispersion medium in some sols. Hence, the fractal as a system composed of particles is an ensemble of high- resonators (coupled dipoles) corresponding to optical resonances of approaching particles with randomly-distributed eigenfrequencies . Within the framework of this concept, the fractal aggregate can also be considered as a statistical set of arbitrarily-oriented pairs of interacting particles differing in their positions with respect to each other. In this case, the probability of existence of arbitrary pairs of particles with the relative interparticle distance in a fractal obeys the correlation function . The scaling form of the dependence of the number of particles in a fractal falling within the sphere of radius is , where is a constant corresponding to the characteristic distance between the nearest particles (scaling length unit), and is the fractal (Hausdorff) dimension. Indeed, these regularities distinguishing fractal objects from disordered systems are responsible for the appearance of qualitatively-new fractal physical properties (for an explanation and references see, for example, 1 , 33 ).
The refined variant of the theory of OPFC, where the effect of the exact resonance positions of both the nearest particles (pair approximation) and all other fractal particles are taken into account, was discussed in 13 (see also the review in 18 . The effect of other particles was only accounted for in the pair approximation with the aid of the Lorentz field 12 .
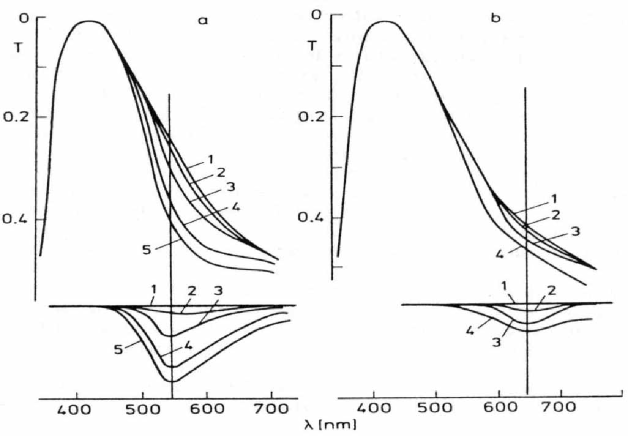
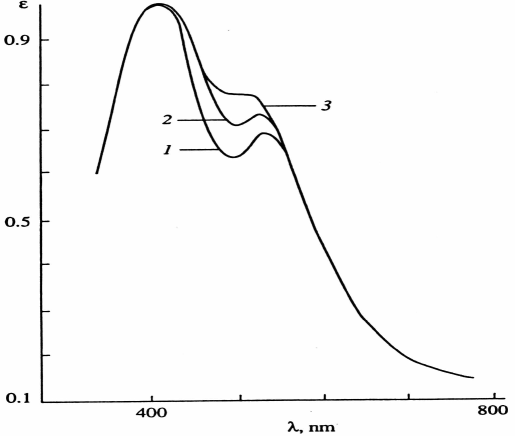
The inhomogeneous character of spectrum broadening, as well as other postulates of the theory of OPFC, have been experimentally confirmed in 1 , 33 , 34 , 38 , 39 . The photomodification of fractal aggregates under the influence of strong laser radiation proves the inhomogeneous broadening of their absorption spectra. Let us consider this effect on the linear optical properties of fractal aggregates. Figures 2(a-b) show the transmission and absorption spectra of aggregates before and after irradiation by a series of strong laser pulses ( nm, sec). One can see that in the latter case, dips appear near the laser wavelength. The dip width is close to the absorption linewidth of separate particles in a non-aggregated hydrosol and is only a small fraction of the aggregate absorption band, i.e., the photomodification is selective over the wavelength. With the increasing number of pulses or growing pulse power, the dip becomes deeper and broader. Note that a dip was also burnt around nm with the radiation obtained by stimulated Raman scattering in acetone. Selective modification of the absorption spectrum of the light in aggregates is observed only at identical polarizations of the light and the laser radiation. For orthogonal polarization of the probe beam, no dip is observed in the absorption spectrum. An increase in the energy density of the laser beam leads to lower spectral and polarization selectivity.
It has been found that dip burning is a threshold effect in the laser pulse energy. For ultrashort light pulses, a dip in the absorption spectrum of the aggregates fixed in gelatin was observed at MJ/cm2 ( nm). At ns, in order to detect the dip, somewhat higher energies were requited compared to ps. The spectral width of the dip increased with the pulse duration growing from 30 ps to 10 ns.
The results obtained support the basic outcomes of the OPFA theory. The optical response of fractals, despite the long-range dipole-dipole interaction, is of local character, which allows local modification of the aggregate.
At a fixed detuning from the resonance of an isolated particle, the radiation selects only those particles for which the detuning is compensated by the shift due to the dipole-dipole interaction. Moreover, the linearly-polarized light ”chooses” quite a definite geometrical configuration of mutual positions of the pairs of particles. This allows, at a fixed laser frequency, to detect two independent absorption dips, corresponding to orthogonal polarizations.
At the energy density J/cm2 and the particle concentration cm-3, according to estimations, each ”resonant” particle of the aggregate (with a protein adsorption layer) absorbs about photons per pulse, which corresponds to an energy sufficient to evaporate a silver particle of 10 nm radius. The area of energy localization depends on the pulse duration and, at ps, corresponds to the size of one particle, whereas for ns it includes already several particles. This accounts for the high energy requirements at ns and for the partial loss of selectivity.
It should be noted that the width and shape of the dip depend on the manner in which aggregates are prepared, the solvent medium and, in some cases, on the time interval between irradiation and spectral measurements 39 . The last dependence indicates relaxation of the structure of photomodified aggregates. A record of five spectral dips in the visible and near-IR ranges within the long-wavelength wing of an aggregated Ag sol irradiated with tunable nanosecond laser radiation was reported in 40 . The properties of the burnt spectral holes (the color of the irradiated spot) in the samples of the polymer films contained silver fractal aggregates, which we investigated, remain very stable already over years (that promising for dense information recording).
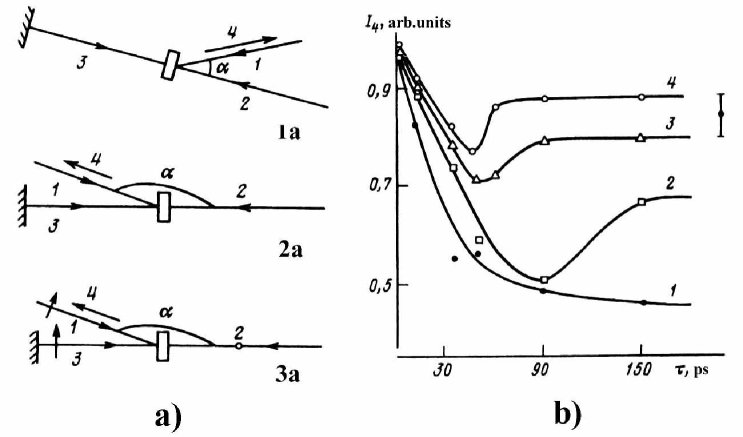
Figure 3 (a,b) displays various experimental schemes (a) and temporal behavior of the photomodification process induced by laser pulses nm, ps at different values of the pulse intensities (b) 41 . These dependencies have been obtained by the four-wave mixing (optical phase conjugation) technique through a delay of the probe pulse. Simultaneous pulses 1 and 2 [Fig. 3(a)] cause photomodification of the Ag fractal aggregates in a hydrosol cell. A delay of the probe pulse 3, which length is about 1 cm, is controlled by the shift of the mirror. It scatters on the optical grating produced in such a way inside the Ag sol, and generated signal 4 is recorded vs time delay of the probe pulse 3 with respect to the photomodification-stimulating pulses 1 and 2. Plot 1 corresponds to a relatively low intensity of the stimulating waves. It displays instant electronic response, which then decays. The plots 2, 3 and 4 are obtained at higher pulse intensities. They reveal strong contribution of the grating produced through the photomodification and display the dynamics and the delay of this process. Here we see that the higher the intensity, the faster is the process of photomodification.
A negligible role of the thermal processes was proved through change of the grating period, which is proportional to [Fig. 3 (a)]. The angle was 5o in the scheme 1a and 160o in the scheme 2(a). The estimates and direct measurements revealed that the time interval, required for the formation of the thermal grating, is longer than 200 ps. Investigation of polarization effects confirmed these conclusions (see scheme 3(a), where polarization of waves 1 and 2 are orthogonal).
4.2 Specific features of the absorption spectra of silver colloids
4.2.1 Preparation of Ag colloids
Different methods were used to prepare colloids (hydrosols):
1. The boronhydride method described in 9 , 39 proceeds as follow. mg of sodium boronhydride is dissolved in 20 ml of cooled bidistilled water, and 5 ml of such water is used to dissolve 2 mg of silver nitrate. Then the silver nitrate solution is quickly added to the test tube with sodium boronhydride solution, and the mixture is intensively shaken. The resultant colloid is yellow-colored. The extinction spectrum of a fresh hydrosol has a peak at nm with FWHM in the range nm in various measurement. The resonant width is larger than that of isolated particles. In particular, this is believed to be due to dispersion in the size and shape of the particles leading to small inhomogeneous broadening of the extinction spectra of non-aggregated hydrosols.
2. The second utilized method is based on the use of collargol 1 , 39 , which a mixture of silver with proteins that stabilize hydrosols (C-hydrosol). 1 ml of collargol dissolved in 10 ml of bidistilled water yielded an orange-brown solution, in its extinction spectrum a peak was observed at = 420 nm, broadened towards to the long-wavelength wing. The broadening is believed to be caused by the silver particles combining with protein molecules to form a complex wherein particles are spaced at distances comparable or somewhat larger than their diameters ( nm). Stabilized isolated particles, showing no changes in the absorption spectra within a month period, were prepared by heating of the collargol solution with a small addition of sodium nitrate. Aggregation of the hydrosol obtained was initiated by adding 0.1 NaOH solution in the proportion 1:10. In 1 - 2 weeks the hydrosol became dark-red, and its spectrum displayed a high long-wavelength wing.
3. The third method is based on the reduction of silver by ethyl alcohol. The colloid prepared according to this method is called A-hydrosol. The preparation of 100 ml of an A-hydrosol requires 0.4 g of AgNO3 and 0.3 g of PVP. The reduction of silver was conducted by heating this A-hydrosol in a solution consisting of 20 ml of H2O and 80 ml of C2H5OH for 20 min in the range K. Partial aggregation of the solution during its heating depended on the heating time, which varied over the range min.
4.2.2 Evolution of the spectra of silver hydrosols during spontaneous aggregation of the disperse phase
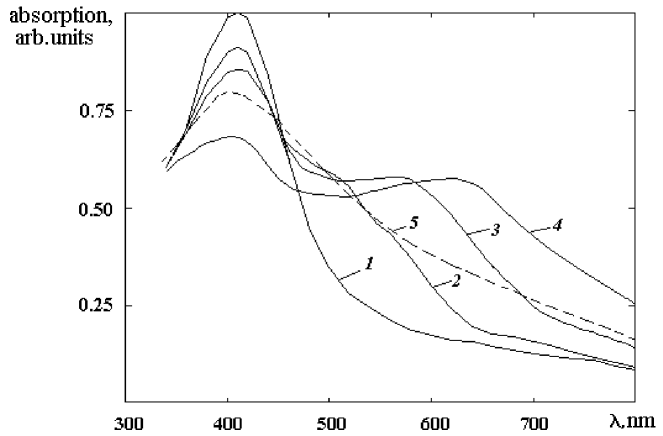
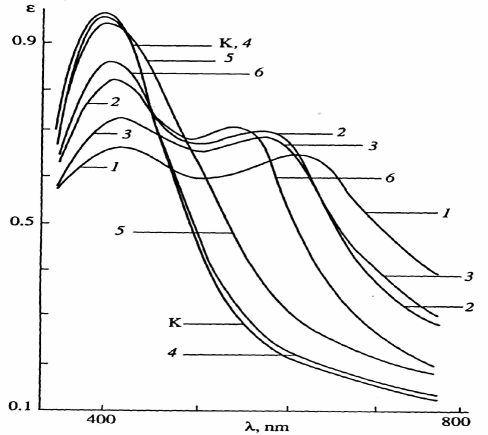
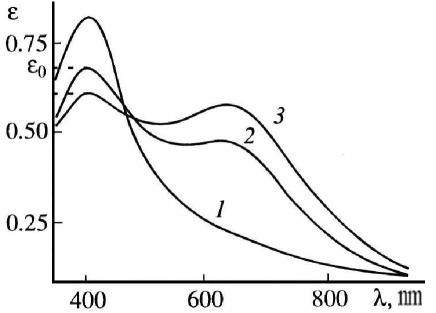
Silver sols can be considered as a convenient model system where the effect of various factors on the position and shape of each single resonance can be easily monitored, thanks to the presence of the isolated and relatively-narrow band of plasmon absorption centered at in the optical range. Figure 4 illustrates the typical absorption spectra of various silver hydrosols, which comprise both isolated spherical particles (the average size of the metallic core is nm) and particles combined into fractal aggregates. Procedures for the preparation of hydrosols are described above (see also 1 , 9 ). A typical feature of the spectral curves of the majority of strongly-aggregated surfactant/polymer-containing silver colloids (see, e.g., Fig. 4, curve 4 and Fig. 5, curve 1) is the presence of two maxima in the optical spectral range 1 , 9 , 42 . The first spectral maximum corresponds to the surface plasmon of isolated and weakly-interacting particles when their number is the largest. Its amplitude reduces with an increase in the degree of sol aggregation due to a decrease in the relative fraction of such particles (Fig. 4, curves 2 - 4). We believe that the origin of the second maximum fundamentally differs from that of the first maximum. A possible explanation of the origin of the second low-energy peak in the absorption spectra of silver sols is reviewed in 10 . This problem was also touched upon in 9 , 43 , where it was suggested that the second maximum is associated with the Raman excitation band. The origin of this maximum, explained by the excitation of the collective transverse waves in the ensemble of particles, has been studied within the framework of the Maxwell-Garnett theory 44 . However, this viewpoint contradicts the fact that fractal aggregates forming in a colloid cannot transmit travelling waves due to the violation of the condition of translational invariance in fractal structures.
In general, we believe that the explanations represented in basic publications devoted to this problem are often confined to the framework of qualitative hypotheses, and the proposed theoretical models in many cases contradict experimental facts. Meanwhile, the appearance of an additional low-frequency maximum in the absorption spectrum of an aggregating sol and the gradual shift of this maximum within the background of forming a long-wavelength wing give rise to sharp changes in color; this situation is discussed in detail in 1 . We also note that the appearance of a low-energy maximum in the absorption spectra in some cases is observed not only in hydrosols, but also in silver aerosols deposited onto the substrate 10 .
4.2.3 Evolution of the spectra of silver hydrosols during photostimulated aggregation of the disperse phase
In darkness, the colloid looses it stability very slowly (over a period ranging from a few weeks to a few months) due to random Brownian collisions of particles and low coagulation efficiency of such collisions. However, the aggregation stability of the colloid drops abruptly under the action of UV or visible radiation. As reported in 41 , we observed photoinduced formation of fractal aggregates under the action of the radiation of certain lasers or nonmonochromatic (or quasimonochromatic) radiation on hydrosols. This effect is also accompanied by considerable broadening of absorption spectra. The difference between the absorption spectra of spontaneously formed and photostimulated aggregate is negligible at low light intensities 1 (cf. Fig. 5 and Fig. 6).
It appears only under irradiation by the pulsed lasers and grows with the increase of the intensity of the stimulating light (Fig. 7).
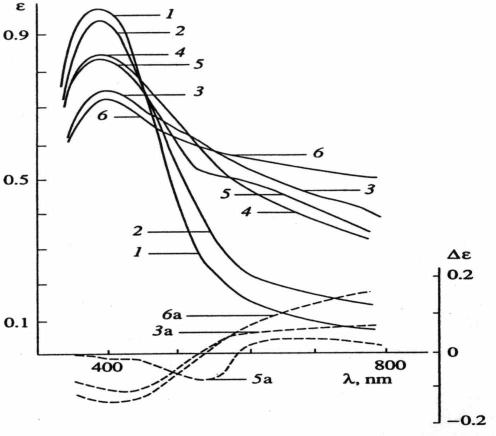
Figure 7 depicts the absorption spectra of silver hydrosols modified by laser radiation. The hydrosols were exposed to radiation continuously scanning the solution surface of 1 4 cm in a quartz cuvette (cell) 0.2-cm thick. Curve 2 demonstrates the changes in the spectrum that occurred upon irradiation by an argon laser. The spectrum shows signs of the starting stage of aggregation. Curve 3 shows changes in the absorption spectrum that occurred after exposure to the pulsed radiation of a ruby laser ( = 694 nm). Apart from the changes representing the general trend (such as the formation of a long-wavelength wing), the spectrum also displays a feature associated with the considerable decrease of absorption in the area of 694 nm (in the range nm). This decrease is clearly visible in the difference spectrum (curve 5a). The reason for such a decrease in absorption is that the formation of fractal aggregates (FAs) and the occurrence of an inhomogeneous wing of the spectrum create conditions for the subsequent spectrally-selective photodestruction of the FAs (near the wavelength of the laser radiation). We note that the photomodification of FAs takes place only when the radiation energy density exceeds the threshold value. A similar trend is observed in hydrosols exposed to radiation of the second harmonic of a neodymium laser ( = 540 nm). Curve 4 represents the spectrum of the original hydrosol in the intermediate stage of aggregation (unlike curve 1). Curve 5 demonstrates the changes in the absorption spectrum that occurred after irradiation with the laser pulses. Aside from the formation of a long-wavelength wing, the spectrum seems to develop a dip in the vicinity of the wavelength of the laser radiation (540 nm). Such spectral consequence of two processes – photoaggregation and photomodification. We note that a considerable increase of the threshold radiation dose results in deterioration of the spectral selectivity of irradiation and in a wider dip, as can be seen, for example, in curve 3. Special attention should be paid to curve 6, which demonstrates spectral changes with signs of aggregation. These changes are brought about by the action of the pulsed radiation of an excimer (XeCl) laser on the colloid. Curve 6 in Fig. 7 does not have a second maximum unlike curve 6 in Fig. 5, which represents the spectral changes caused by low-intensity radiation. This difference is most probably associated with the photomodification of FAs. The hole (dip) burnt in the absorption spectral range , while , gives rise to a corresponding dip in the range , and vice versa in the case where . According to the theory in 13 , the short-wavelength spectral dip is twice as far from (on the frequency scale), compared to that in the long-wavelength wing of the absorption spectrum. This fact, along with the relationship between , and , brings us to the conclusion that the hole burnt by the eximer laser in the range falls within spectral range of the long-wavelength absorption maximum (second maximum on curve 6).
It should be noted that exposure of the solution to the radiation of a neodymium laser with the wavelength = 1.08 m causes no spectral changes. This fact can also be explained within the suggested model of the phenomenon, because the wavelength of this laser radiation lies beyond the red threshold of photoaggregation, which is believed to be of a photoemissive nature 37 , 38 .
4.3 Main factors determining optics of sol in the theory of OPFC
In this work, specific features of the absorption spectra of silver sols and their differences within the framework of the theory of OPFC are explained based on a concept which elaborates the approach proposed in 1 . The essence of this idea is as follows. In general, any real sol is a polydisperse system characterized by the function of particle size distribution (FPSD) ), which has a clearly-pronounced maximum and is described by the asymmetric dependence resembling a Poisson distribution. This means that the most probable particle size exists in a system that has real colloidal properties (for example, see 9 ). In this sense, the monodisperse system can be considered as a specific (with the narrowest FPSD) system, although this case is physically meaningless.
Correspondingly, the presence of a prevailing, statistically-sampled size leads to the fact that, over the course of aggregate growth, the most probable distances between contacting particles become those which arise in the pairs with particle size (see the explanation in Sec. 4.4). In turn, the appearance of an excess number of contacting pairs with the most probable interparticle distance should affect the optical spectra. This is related to the fact that these pairs correspond, on average, to the prevailing value of the frequency resonant shifts ; the latter circumstance is responsible for an increase in absorption over some limited part of the long-wavelength wing of an aggregate spectrum. Within the framework of the pair approximation (with no allowance for the exact total contribution of distant particles), the relative position of the second maximum in the absorption spectrum is determined by the relations
| (4.1) |
where is the resonant frequency of noninteracting particles. However, in this case, it should be kept in mind that, in surfactant/polymer-containing sols, the least possible distances between the particle geometrical centers are determined both by the size of the particle metallic core and the thickness of their adsorption layers as a whole, including the polymer component, which provides for the appearance of a sterical factor of stability 45 . As is seen from microimages of fractal aggregates of different-type silver hydrosols 42 , the polymer component of the adsorption layer markedly affects the packing of particles in aggregates. In the case of identical values for all the particles, the probability of the appearance of the pairs of contacting particles with interparticle distance (with allowance for the deformation of the external part of their adsorption layers) in the optical spectrum of the aggregated hydrosol should be the largest. In addition, the case should also be considered when the thickness of adsorption layers on particles of various sizes can be different. Under certain conditions, an dependence can appear. Moreover, taking into account differences in the composition of the dispersion medium and the type of stabilizer molecules, various types of colloids can be characterized by the strictly individual pattern of this function. As will be shown further, this can be one of the very reasons for the differences in the adsorption spectra of some silver hydrosols (with account for differences in the FPSD for the metallic core) represented, for example, in 1 , 42 .
The reason for the differences in the adsorptivity of particles (including the adsorptiviity with respect to surfactant or polymer molecules) can be related, in particular, to the presence of the defects (vacancies) of a crystalline lattice at the real particle surface. This leads to the appearance of local regions with a nonequilibrium value of the electric potential at the particle surface and, consequently, to the selectivity of various parts of the surface with respect to the electrostatic interaction with molecules of the adsorption layer. Therefore, in the process of adsorption, only those parts of a particle surface that are located near the vacancies being the adsorption sites are first occupied 46 , 47 . The adsorptivity of a particle as a whole will depend on the surface density of vacancies, including those that arise in the process of self-induced adsorption 46 . As was demonstrated in this work, the number of such vacancies can surpass the number of equilibrium surface vacancies by many orders of magnitude. The dependence of vacancy concentration on the particle size , which rises exponentially with a decrease in , was revealed in 46 for small particles. Given what has been said above, the most probable distances between pairs of particles in aggregates will generally correspond to the maximum of FPSD, , where . It is this function that will affect the most probable values of the frequency shifts which, within the framework of the binary model with allowance for known constraints of this approximation, are described by the expression
| (4.2) |
However, the problem of the effect of the surfactant/polymer-component of the adsorption layer on the pattern of particle packing in fractal aggregates, and hence on the spectral features of these aggregates, can be solved by experimental studies of the thickness of adsorption layers using electron microscopy. In this case, a number of complexities related to the preparation of microscopic samples can arise. This will require special techniques, because the dehydration of surfactant/polymer molecules can be accompanied by a variation in molecular volumes and, correspondingly, by a decrease in the initial thickness of an adsorption layer in the vacuum chamber of an electron microscope.
Hence, in accordance with the above discussion, one can state that, in the formation of the contour of the long-wavelength wing of the absorption spectrum, two factors are manifested: (1) on the one hand, spatial disordering and local anisotropy of fractal aggregates, which takes place in any type of sol, irrespective of the pattern of the distribution function, and generally specifies a monotonic decay of absorption with increasing in wavelength; and, (2) on the other hand, the existence of a dominating particle size in a real polydisperse colloid. The introduction of FPSD with a selected maximum into the equations of the theory of OPFC leads to a violation of the monotonicity in the boundaries of the long-wavelength wing of the absorption spectrum of a fractal aggregate. To solve this problem, it is necessary only to determine the conditions which, in a certain size range, can result (via the mediated effect on the aggregate structure) in the appearance of an additional low-frequency maximum in the absorption spectrum of a fractal aggregate, provided that the dominant particle size in some types of metal sols is taken into account.
4.4 Analysis of calculated spectral dependencies
While calculating the absorption spectra of fractal aggregates, we took into account the results of 32 , where important refinement was introduced into the theory of OPFC for the calculation of linear optical spectra. This refinement is related to the allowance for the real particle sizes, and accordingly, to the anisotropic fields of oscillating dipoles induced on interacting particles. According to this work, the value of spectral broadening observed in real fractal aggregates should correspond to shorter interparticle distances than the least possible distances confined to the condition of sphere contact. This implies that, to adequately describe the spectrum of real fractal aggregate consisting of contacting particles, it is necessary to assume that the particle size used in the calculations should be smaller than the experimental size by the correction coefficient whose average value is equal to (by the data of various authors). In this case, the account for this correction is nothing other than the procedure of renormalization drawing together calculated spectra with a given value of particle sizes and experimental dependencies.
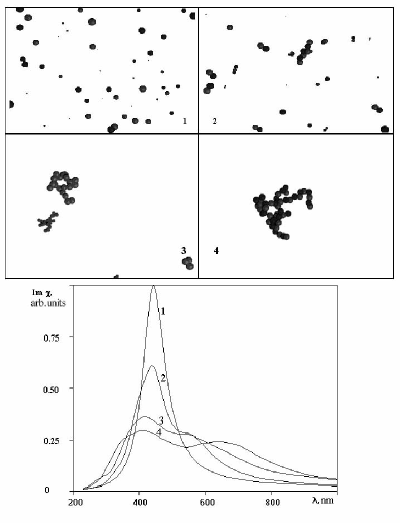
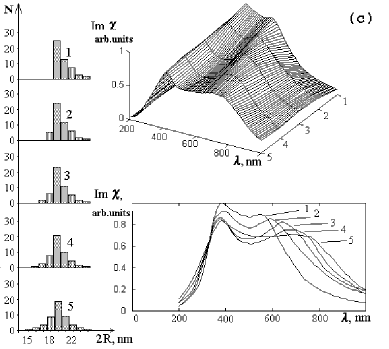
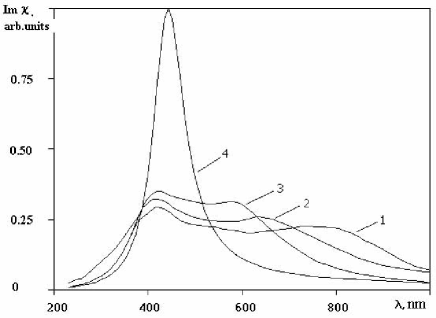
Figure 8 illustrates the results of calculations of the wavelength dependence of the imaginary part of the linear optical susceptibility of an aggregating particle ensemble corresponding to its absorption spectrum (for the case of a monodisperse sol). Hereafter, we adhere to the terminology introduced in 13 where appears as an absorption spectrum. (The absorption cross-section differs from this value only by a trivial factor of .) Figure 8 shows the regularities of the spectrum evolution at various stages of particle aggregation (curves 1-4). The formation of the second spectral maximum is already observed at the intermediate stages of aggregation. When comparing this set of curves with the experimental results (Fig. 4), attention should be given to the obvious qualitative similarity of these dependencies.
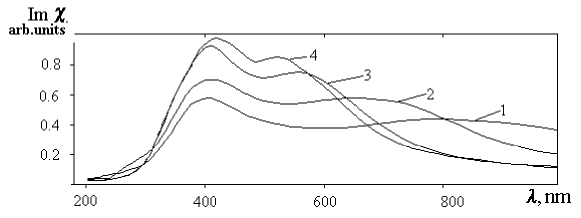
Figure 9 represents the absorption spectra of fractal aggregates formed from particles of identical sizes. In the obtained set of curves, the spectrum pattern is studied as a function of particle size. These sizes correspond to the following minimal values of distances between the nearest particles: nm. With allowance for the coefficient , this corresponds to the particle sizes of nm. As seen from the figures, in accordance with the expressions (4.1) and (4.2), clear correlation between the value of , and the position of the long-wavelength spectral maximum is observed. Hence, the smaller the particle size, the stronger the secondary maximum is shifted. A gradual decrease in its contrast is also observed. The following important fact should be mentioned: if the dominant particle size in an aggregate becomes smaller than nm, the secondary maximum completely shifts beyond the boundary of the optical range and has no further significant influence on colloid color. If the characteristic particle size exceeds nm, the position of a secondary maximum appears to be too close to the principal maximum () and gradually vanishes into the background of the long-wavelength wing of the principal spectral maximum with an increase in particle size. In this case, color changes can only be attributed, as in the case of nm, to a monotonic rise in the absorption in the region of the long-wavelength wing. Note, however, that results shown in Fig. 9 are only valid for ideal monodisperse colloids, which is physically an unreal case. However, this does not mean that particles with the sizes larger than 30 nm do not contribute to the spectrum broadening. A contribution can also be made by larger particles if they comprise interacting pairs including small particles. However, the distance between the particle centers of such a pair should fall within the range of shown in Fig. 1 (with account for the factor ), although it is evident that the number of such pairs, and hence their spectral contribution, is insignificant compared to the particles of dominant size. Thus, the fundamentally important result of these calculations is the fact that the revealed specific features of absorption spectra of aggregated colloids can only be exhibited within a rather narrow range of particle sizes.
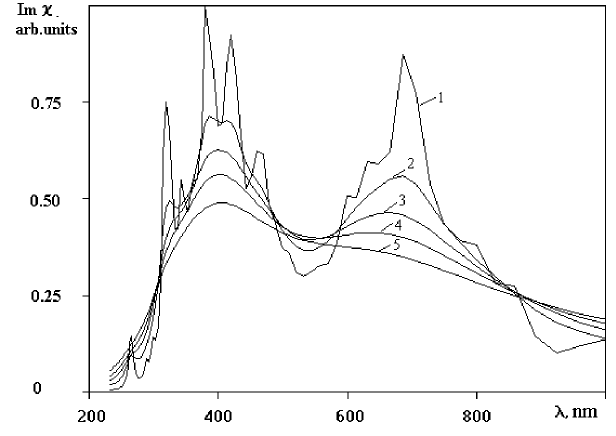
Figure 10 shows the results of the calculations of absorption spectra of aggregates formed for various values of the homogeneous width () of the absorption spectrum of comprising particles. These results solve the problem of why there is a decrease in the contrast of the secondary maximum in the spectrum. As is seen from these dependencies, statistical oscillations appear in the spectrum of fractal aggregates at values of up to 50 nm (below minimal values observed in the experiment). These oscillations disappear at nm. Values of the spectral width of the surface plasmon of silver hydrosols with zero-degree aggregation 37 not larger than 90 nm were observed in 42 . However, the values can be slightly larger in some hydrosols. This can be related, firstly, to spectral broadening due to the presence of a some fraction of small particles with large values of homogeneous width (see formula (1.1)) and, secondly, to the presence of microscopic aggregates composed of several particles that already exhibit the effect of spectral broadening resulting from their interaction. In addition, a certain polydispersity of the sol, even in the range of small particles, can be one of the reasons for the presence of a slight dispersion of the ”resonant” frequency 5 , 6 and, hence, of some inhomogeneous spectral broadening due to the existence of the weak dependence in this range. Finally, it is necessary to take also into account some nonsphericity of a small particle fraction, which can result in the shift of resonances depending on the particle shape 5 , 6 . Note that the presence of oscillations in the obtained spectral dependences at nm, varying in the range of experimental values of the homogeneous width of an absorption spectrum for some types of silver colloids 42 , can also be explained by the restriction imposed in the calculations for the number of particles being 50 in a fractal aggregate. As a result, the number of statistical averagings seems to be insufficient for calculating the spectral curve with a narrow homogeneous bandwidth.
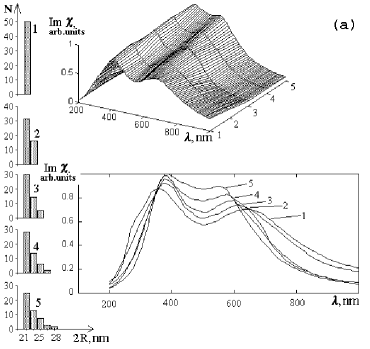
Studies of the absorption spectra of polydisperse ensembles of particles with the FPSD close to a real distribution 9 are of the most practical interest in this work. Figure 11a demonstrates absorption spectra of a polydisperse ensemble of particles ( nm) with various types of FPSD. As was demonstrated in preliminary calculations, the spectral dependence turned out to be extremely sensitive to the form of FPSD. Therefore, we passed from the monodisperse to polydisperse cases in two stages. At the first stage, to the particles of a specified size ( nm) whose aggregate spectral position of secondary maximum corresponds to the experimental data ( nm), larger particles were gradually added, which eventually provides for the similarity of this wing of FPSD with the 9 of a real sol. As seen from the set of curves obtained, the common general feature is the shift of the secondary maximum to the principal one upon the addition of larger particles to the system.
However, the largest sensitivity of the absorption spectra to the variation in FPSD while passing to polydisperse systems is observed for the appearance of small particles in a system. Figure 11b represents the set of curves obtained upon the gradual addition of smaller particles to a monodisperse system ( nm), providing for the monotonic decay of the FPSD wing. As seen from these results, the regularity is exhibited in the shift of the secondary maximum to the long-wavelength range and in a decrease in its contrast. The latter is due to the broadening of the low-frequency spectral peak (Fig. 1) with a decrease in the distance between the pair of interacting particles brought into contact. In turn, a decrease in the interparticle distance is explained by a corresponding decrease in particle sizes.
Finally, Fig. 11c demonstrates the set of curves obtained upon adding small particles to a polydisperse sol containing only large particles (FPSD corresponds to case 5 in Fig. 11a when the condition of the preservation of the contrast of the secondary maximum in a spectrum is accompanied by the largest shift of a maximum to the long-wavelength range). As seen from Fig. 11c, the gradual addition of small particles to the system leads to the shift of the secondary maximum to the long-wavelength range and simultaneously to a decrease in its contrast. We see that curve 4 best corresponds to the experimental results. Note the asymmetric pattern of FPSD corresponding to some deficiency of small particles, which also correlates with the experimental data 9 . In the spectrum of the fractal aggregate obtained for asymmetric FPSD (Fig. 11c, case 5), the contrast of the secondary maximum falls sharply. A common tendency is that the appearance of an excess number of small particles in an ensemble results in the gradual disappearance of the secondary maximum in the spectrum; in this case, the long-wavelength wing of the absorption spectrum of such colloids is described by a smooth monotonic dependence.
Hence, results of these calculations are important, because the long-wavelength maximum can be most clearly pronounced at the least possible width of FPSD. Evidently, the greater the FPSD width, especially with an excess of small particles, the more blurred the secondary maximum becomes. This feature can explain the absence of the secondary long-wavelength maximum in the absorption spectra of silver hydrosols prepared by reducing silver nitrate with NaBH4 (Fig. 4, curve 5) 9 , 43 . The absence of a surfactant/polymer component in the adsorption layer composed of particles of these silver colloids stabilized by electrostatic interactions results in the average effective particle size and, correspondingly, average interparticle distances in aggregates becoming smaller than in the aggregates of collargol-based colloidal silver 1 , 42 , even if the FPSDs of these colloids with respect to metallic core are similar.
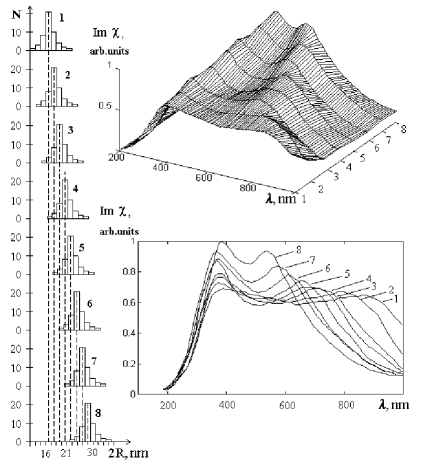
Figure 12 shows calculated dependences of absorption spectra of polydisperse fractal aggregates (with identical FPSD profiles) on the position of the maximum of this function. As seen from this figure, the common tendency is manifested in the shift of the secondary maximum into the long-wavelength range upon the displacement of the FPSD maximum towards smaller sizes, which is also attributed to the prevailing contribution of small particles. It is of some interest to compare these results with the data shown in Fig. 9 for a similar dependence for monodisperse sols. As seen from comparing these figures, the colloid polydispersity results in that spectral dependences, whose secondary maximum positions are similar, are already observed at the values of the FPSD maxima that slightly exceed the corresponding sizes of particles comprising monodisperse fractal aggregates.
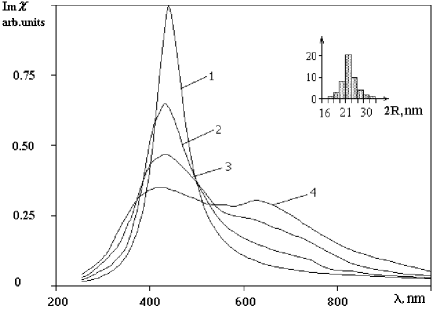
Figure 13 demonstrates the evolution of an absorption spectrum of a polydisperse ensemble of particles with the FPSD pattern maximally close to the real one ( nm). A comparison with Fig. 10 representing analogous dependences, however for a monodisperse ensemble of particles ( nm), reveals their qualitative similarity.
In this work, we attempted to find out why the principal maximum in the absorption spectra of some strongly-aggregated real colloids is close (or almost coincides) to this maximum (Fig. 4), whereas the results of calculations indicate a certain shift towards a long-wavelength range. It was shown in this work, one of the reasons for this situation can be the presence of some amount of isolated particles, which are not included within fractal aggregates.
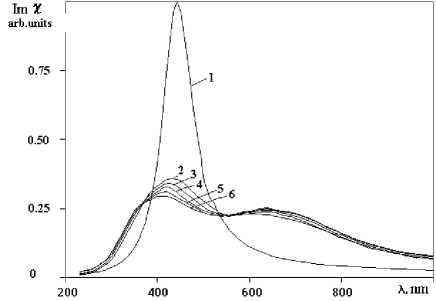
Figure 14 demonstrates the variation in absorption spectra of a particle ensemble containing fractal aggregates and an additional small fraction of isolated particles as a function of the value of this fraction. As shown from the presented set of curves, the spectrum of such an ensemble becomes very sensitive to the presence of even a small amount of free particles. The addition of 1/50 to 1/10 parts of free particles (in relation to the number of particles comprising a fractal aggregate) leads to a gradual shift of the principal spectral maximum towards the long-wavelength range. This fact underlines the resemblance of these curves to the experimental dependencies. However, a gradual reduction in the contrast of a secondary maximum is observed in this case.
Spectral dependencies obtained in this work, along with data on the FPSD 9 and the absorption spectra of aggregated silver colloids, present a unique opportunity to quantitatively compare current experimental data with the results of calculations performed by the proposed procedure.
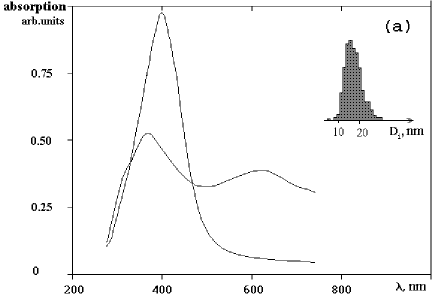
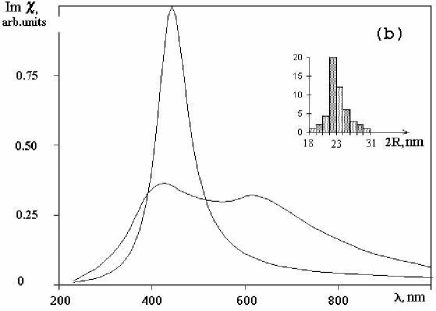
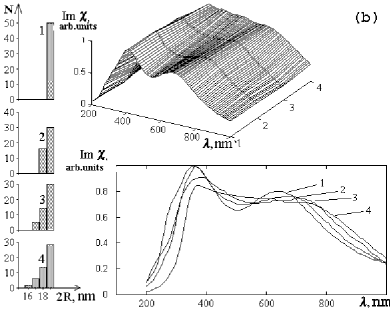
Figure 15 shows the absorption spectra of real silver colloids with corresponding FPSD 9 , and the results of calculations of these spectra based on the theory of OPFC with the FPSD are closest to those reported in 9 ( nm). As is seen from the comparison of these data, the most similar pattern of spectra, when the position of a low-energy maximum coincides with its experimental value, is accomplished for the FPSD with particle sizes somewhat larger ( nm) than those reported in 9 . The revealed difference is explained by the fact that, during the study of the FPSD, Heard et al. 9 only took into account the size of the metallic core of particles. Meanwhile, the polar surfactant was used to increase the aggregation stability of colloids to some extent. We believe that, to explain the discrepancy between these results, we should take into account the speculations reported in Sec. 4.2 and, in particular, expression (4.2). Hence, the discrepancy indicated can be explained by the fact that the adsorption layer of this colloid contains a surfactant. This should result in an increase in the effective size of particles comprising the aggregates, in a slight variation in the FPSD pattern reported in this work and, hence, in the average distances between the nearest particles and, consequently, in the spectrum patterns. Let us take advantage of the data on the thickness of the adsorption layers of the particles of aggregated sols of some preparations of colloidal silver 42 , as well as on the microimages of fractal aggregates 9 , 42 , in order to estimate by the value of the spacings between the nearest particles in the aggregate. On average, these values are equal to nm (with no correction for the dehydration of surfactant/polymer molecules). This implies that the particle diameter used in the calculations should be increased by at least nm (without accounting for the function).
All the calculated dependencies of the absorption spectra mentioned above (Figs. 1, 8-15) were obtained within the framework of a two-level model describing the particle dipole polarizability [see formula (3.12)]. Figure 14 shows the set of curves of the absorption spectra of aggregated colloids, which was obtained using a full-length expression for the dipole polarizability with allowance for the spectral dependence of the permittivity of the particles comprising the matter and the permittivity of the dispersion medium. This dependence was accounted for within the framework of the Drude model [see formulae (3.14-3.17)]. This allows us to estimate the role of this factor in the formation of the absorption contour of an aggregating colloid. The values of specific parameters of these formulas can be taken, for example, from 32 , 33 : =6 and = 9.1 eV ( = 136.1 nm). However, the value of the damping constant () used in our calculations corresponds to the experimental value of the spectral width of plasmon resonance at the half-height ( = 100 nm) in collargol-based non-aggregated Ag hydrosols. Calculations of the spectra within the framework of a two-level model were performed for the same value of . Variations in this parameter lead to results similar to those represented in Fig. 10.
While performing the calculations represented in Fig. 16, we used the same pattern of FPSD, as for the plots shown in Fig. 12 (with a two-level model). When comparing the set of curves, we observed the resemblance and conservation of the main spectral features in the optical range. The appearance of a secondary maximum in these spectra also confirms the version of its statistical origin, and it further explains why this feature cannot account for the spectral behavior of the optical constants of silver, because only monotonic variations in these parameters are observed in the optical range 48 . The results obtained verify the use of the approximation of a two-level model to describe the particle dipole polarizability during the calculations of the absorption spectra of silver colloids. This approximation allows us to successfully monitor the evolution of sol spectra, with an account for the contribution of only one selected resonance in the absence of other close resonances, which is directly applicable to silver sols in view of their spectral features.
A further increase in the accuracy of the calculations of the optical spectra of colloids and their fit to experimental results is determined by the account for such factors as the contribution of the inter-band transitions to the dipole polarizability of particles, the real spectral dependence of optical constants for the comprising particles and their size dependence, the real thickness of the adsorption layers , as well as for scattering effects and for some other factors. It is worth noting that the possibility of applying the theory of OPFC to interpret absorption spectra of silver hydrosols is mentioned in 42 .
Note also that the spectral regularities revealed in this work are virtually independent of the mechanism of aggregation and the presence of an electric charge on the particles. The average values of the fractal dimension of generated aggregates, for which the calculations of optical spectra were performed, fall within the range , and thus only slightly affect the pattern of the spectral contour. The spectral regularities are independent of the number of aggregating particles that was found when increasing this number by tenfold.
4.5 Spectral determination of the aggregation degree
Here we employ the concept that the structural and optical properties of fractal aggregates correlate strongly. Hence, we can propose a new method for determining the aggregation state of the colloids. It can be widely used as an indirect express-method for monitoring of the aggregation state.
To describe quantitatively the degree of aggregation for silver hydrosol on the basis of the pattern of its absorption spectrum (Fig. 17), we introduce the following parameter (hereafter called the degree of aggregation): , where /. Here is difference of the areas below the absorption profiles for aggregated and non-aggregated sols in that part of the long-wavelength range where the first exceeds the second, and is absorption coefficient in the range of unshifted plasmon resonance for the aggregated colloid. The latter parameter is introduced into the formula in order to account for a possible decrease in the concentration of the dispersed phase of a colloid due to the partial deposition of the latter onto the vessel walls. This effect may cause no change in the shape of the spectral curve, and its magnitude may vary for different samples. The parameter is the normalizing factor, which is equal to the degree of hydrosol aggregation immediately before or after precipitation when the phases separated are subjected to forced stirring. This factor is equal to the maximal possible value of for the particular type of hydrosol considered (Fig. 17, curve 3, which corresponds to the maximal degree of aggregation). Normalization to is required in order to bring the value of closer to unity for the media with strong aggregation. In addition, such normalization makes the mentioned definition of the degree of aggregation, to a certain degree, universal with respect to different types of hydrosols.
Practically, calculations can be done with the aid of equation, , where is the number of points selected to break the -axis into equidistant segments in the region where the absorption of the aggregated medium (curve 2) exceeds the absorption of the medium containing the isolated particles (curve 1); is the difference between the absorption coefficients for curves 1 and 2 at the th point ( = 1, 2, … ); and is the absorption coefficient for curve 2 in the region of the unshifted plasmon resonance.
Evidently, is calculated with an accuracy depending on the selected number of points . In fact, we propose to define as the difference between the definite integrals taken over the functions describing curves 2 and 1 at approximately nm. In particular, the value of corresponding to curve 2 (Fig. 17) is equal to 0.8 at = 8.
The correctness of the method proposed to determine the degree of aggregation from the spectral broadening can be verified by the numerical simulation of particle aggregation under random-walk conditions while simultaneously calculating the optical spectra of the forming aggregates on the basis of the equations from Section 3 and using these spectra for evaluating . With this, one can perform a comparative analysis of the time variations of various parameters characterizing the degree of aggregation in the system of particles. Such parameters can be introduced in different ways. In particular, the kinetic theory by Smoluchowski implies that the degree of aggregation is a quantity inversely proportional to the total number of all the particles that appear in the coagulated system ( )(see, e.g., 7 ).
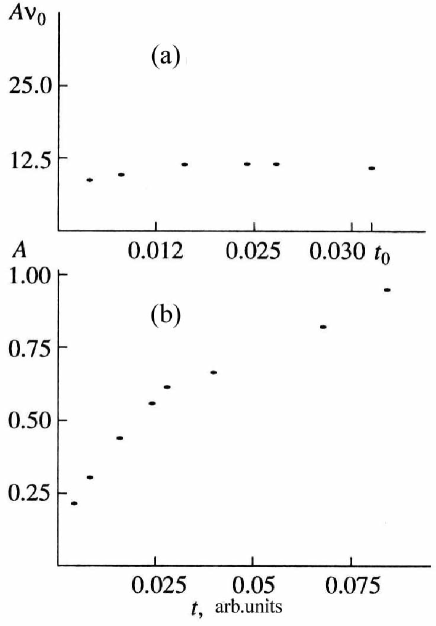
The parameter accounts for both the isolate particles and associations of two or more particles. It is related to the initial number of isolated particles by the expression , where is the time required for to decrease to the value . The dependence corresponding to this expression holds in the time interval during spontaneous Brownian aggregation of the particles. This result was repeatedly supported by experiments. Hence, if our approach to use the spectral data for determining the degree of aggregation is correct, then both the parameters and should identically describe the aggregation kinetics, and the product should remain constant during aggregation in the time interval (at ). Figure 18a represents the time dependence of the product. This dependence was calculated by the 3-D simulation of spontaneous Brownian aggregation of fifty particles, whose optical and geometrical properties corresponded to the particles of the silver hydrosols examined. We see that, within the statistical scatter, the value of is constant at . This fact supports the correctness of our method of determining the degree of aggregation and indicates that the parameter mentioned describes adequately the state of the dispersed phase of the colloid. According to Fig. 18b, the dependence (which describes the aggregation kinetics by the simplest model of Brownian motion) is almost linear in the time interval . However, the aggregation rate then decreases with time due to the formation of large aggregates and the decrease in their mobility (this effect may disagree with the experimental results because all physical factors are ignored in this model except for the kinetic one).
Of course, the proposed definition of the degree of aggregation is somewhat arbitrary, and one must account for the specific features of different types of colloids in each particular case. Note that the parameter reflects not only the fraction of isolated particles forming the fractal aggregates, but also the particle packing density in these aggregates, which depends on the specific features of the structure of the adsorption layer on particles and is individually determined for each particular type of sol. We should also note that the approach proposed to describe the degree of aggregation is valid only for the disperse systems in which absorption prevails to a large degree over scattering.
5 CONCLUSION
The main results of the work are summarized as follows.
1. It is shown that the effect of the particle size on the optical spectra of unstable aggregating silver colloids is much more pronounced according the theory of optical properties of the fractal clusters (OPFC) than in the Mie theory with an account for the differences in the physical mechanisms of this effect. The application of the Mie theory leads to qualitative discrepancies between the calculated dependences and experimental data in the range of small particle sizes. The main spectral changes that are observed in typical silver colloids are explained by the theory of OPFC, even without an account for the effects predicted by the Mie theory. The effect of dispersion of the particle size within the interval nm on the optical properties of the polydisperse sols, which is the subject of the Mie theory, is not that considerable. Indeed, the calculated shift of the resonance wavelength within the size interval nm makes up only 15 nm, whereas the shift detected in the aggregated silver hydrosol, with such particle sizes, is larger than 400 nm.
2. An adequate description of the evolution of the optical absorption spectra of typical aggregating Ag sols, with the aggregating particle sizes in the range of nm, is not possible without account for their dipole-dipole interaction. This is the main origin of the considerable spectral broadening, especially for the colloidal structures with the fractal geometry. Indeed, the distance between geometrical centers of the nearest particles inside the aggregates is the parameter of the crucial importance for the OPFC theory. The main reason for the significant broadening of the absorption spectra of typical silver colloids (particle size nm) is the assembling of particles of the dispersed phase into fractal aggregates. There exists a clear and strong correlation between the degree of particle aggregation and the aggregate structure on the one hand and the shape of optical spectra on the other hand.
3. The shape of the absorption spectrum of the sole in the developed stage of aggregation is strongly dependent on the distribution of the aggregate-comprising particles over their sizes. Indeed, individual features of absorption spectra of various silver colloids are explained by the differences in the form of this function, with account for both the sizes of the metallic core of particles and the thickness of the ionic and polymer component of their adsorption layers.
4. According to the OPFC theory, the aggregation of Ag particles into fractal structures gives rise to a giant broadening of the long-wavelength wing of the absorption spectra which may become commensurable with the magnitude of the resonant frequency itself. Corresponding shifts of the resonance are attributed to a relatively narrow range of the distances between the particles, while minimum possible magnitudes of these distances, , are determined by the sizes of the aggregating particles, and . The OPFC theory predicts a strong (power) dependence of the frequency shift on the inverse particle size, i.e., , whereas the Mie theory predicts a near-linear dependence on this size for the Ag sols (at least in the size interval nm, with no significant deviation from this dependence in the interval nm). Therefore, the Mie theory predicts a qualitatively different (inverse) dependence as compared with the OPFC theory.
5. The appearance of an additional maximum in the long-wavelength wing of the absorption spectra of some colloids occurring at the stage of developed aggregation has no relationship to the displayed and exhibition of collective optical resonance of a specific nature, which is unrelated to the excitation of the surface plasmon. The appearance of this maximum is attributed to the existence of the statistically-dominating values of geometrical parameters in an ensemble: particle size and distances () between contacting neighbor particles in aggregates corresponding to this size. This results in an increase in the spectral density of the surface plasmon resonances within a certain range of wavelengths. In this case, this spectral feature is exhibited in sols with a sufficiently narrow ( nm) range of effective particle sizes.
6. The position and shape of the secondary maximum in the absorption spectrum are determined by the value of the dominant distances between neighboring particles in aggregates, which depend on . The lower the degree of sol polydispersity, the higher is the contrast of the secondary spectral maximum. The contrast of this maximum decreases with the increase of the homogeneous absorption spectral width by the isolated particles. Furthermore, even a small () fraction of non-aggregated particles decreases the contrast.
7. The absence of two maxima in the absorption spectra of some silver colloids can be explained by the presence of an excess number of small particles in a colloid (with account for the thickness of their adsorption layer) and its strong polydispersity, thus resulting in a sharp decrease in the contrast of the secondary spectral maximum.
8. In general, two factors play an important role in the formation of the long-wavelength absorption spectral wing: fractal geometry of the aggregates, which determines the monotonic decrease of absorption with increase of wavelength, and the existence of the dominant particle size in the polydisperse mixture of the aggregate-comprising particles, which leads to breaking such monotonic dependence and to the appearance of the additional spectral maximum.
9. The concepts presented in this work remain valid not only for silver colloids, but can also be extended to colloids of other metals, including gold, with an account for spectral dependencies of its optical constants.
6 ACKNOWLEDGMENTS
The authors are grateful to V. P. Safonov and V. M. Shalaev for useful discussions related with this research. AKP and TFG thank the U. S. National Research Council - National Academy of Sciences for support of this research in part through the International Collaboration in Basic Science and Engineering program.
References
- [1] Karpov S.V., Popov A.K., Slabko V.V., et al., Colloid J., 1995, vol. 57, no. 2, p. 199.
- [2] Mie G., Ann. Phys., 1908, vol. 25, p. 377.
- [3] van de Hulst, H.C., Light Scattering by Small Particles, New York: Wiley, 1957. Translated under the title Rasseyanie sveta malymi chastitsami, Moscow: Inostrannaya Literatura, 1961.
- [4] Wiegel E., Z.Phys. 1954. vol. 136, p.642.
- [5] Skillman D.C. and Berry C.R., J. Opt. Soc. Am. 1973, vol. 63, no. 6, p. 707.
- [6] Skillman D.C. and Berry C.R., J. Chem. Phys., 1968, vol. 48. no. 7, p. 3297; Kreibig U. and Fragstein C.V., Z. Phys., 1969, vol. 224, no. 4, p. 307.
- [7] Voyutskii S.S., Textbook of Colloid Chemistry (Kurs kolloidnoi khimii), Moscow: Khimiya, 1976.
- [8] Bohren C.F. and Huffman, D.R., Absorption and Scattering of Light by Small Particles, New York: Wiley, 1983. Translated under the title Pogloshchenie i rasseyanie sveta malymi chastitsami, Moscow: Mir, 1986.
- [9] Heard S.M., Griezer F., Barrachlough C.G., and Sanders J.V., J. Colloid. Interface Sci.. 1983, vol. 93, no. 2, p. 545.
- [10] Petrov Yu.L, Clusters and Small Particles (Klastery i malye chastitsy), Moscow: Nauka, 1986.
- [11] Xu M. and Digham M.J., J. Chem. Phys. 1992. vol. 96, no. 5. p. 3370.
- [12] Shalaev V.M. and Stockman M.I., Zh. Eksp. Teor. Fiz. 1987, vol. 94. p. 107 [Sov. Phys. JETP 1987, vol. 67, p. 287].
- [13] Markel V.A., Muratov L.S., and Stockman M.I., Zh. Eksp. Teor. Fiz., 1990, vol. 92, p. 819 [Sov. Phys. JETP 1990, vol. 71, p. 455]; Markel V.A., Muratov L.S., Stockman M.I., and George T.F., Phys. Rev. B, 1991, vol. 43, p. 8183.
- [14] Zsigmondy R., Kolloidchemie: ein Lehrbuch, Leipzig: O. Spamer, 1925. Translated under the title Kolloidnava khimiya, Kiev: UNIS, 1931.
- [15] Taleb A., Petit C., and Pileni M.P., J. Phys. Chem. B. 1998. vol. 102. no. 12. p. 2214.
- [16] Lu A.H., Lu G.H., Kessinsjer A.M., and Foss C.A., J. Phys. Chem., 1997, vol. 101, no. 45, p. 9139.
- [17] Bruning J.H. and Lo Y.T., IEEE Trans. Antennas Propog. 1971, vol. AP-19, p. 378, p.391.
- [18] Borgese F., Denti P., Toscano G. and Sindoni O.I., Appl. Opt., 1979. vol. 18. no. 1, p. 116.
- [19] Gerardy J.M. and Ausloos M., Phys. Rev. B., 1982. vol. 25, no. 6. p. 4204.
- [20] Mackowski D.W., J. Opt. Soc. Am. A, 1994, vol. 11, no. 11. p. 2851.
- [21] Fuller K., J. Opt. Soc. Am. A, 1994, vol. 11, no. 12, p. 3251.
- [22] Xu Y.-L., Appl. Opt., 1995, vol. 34. no. 21, p. 4573.
- [23] Purcell E.M. and Pennypacker C.R., Astrophys. J., 1973, vol. 186, no. 2, p.795.
- [24] Ravey J.-C., J. Colloid Interface Sci., 1974, vol. 46, p.139.
- [25] Jones A.R., Proc. R. Soc. Lond. A., 1979, vol. 366, p. 111.
- [26] Chiapetta P., J. Phys. A: Math. Gen., 1980, vol. 13, p. 2101.
- [27] Draine B.T., Astrophys. J., 1988, vol. 333, no. 2, p.848.
- [28] Draine B.T. and Flatau P.J., J. Opt. Soc. Am. A, 1994, vol. 11, no. 4, p. 1491.
- [29] Lumme K. and Rahola J., Astrophys. J., 1994, vol. 425, p. 653.
- [30] De Voe H., J. Chem. Phys., 1964, vol. 41, no. 1, p. 393.
- [31] De Voe H., J. Chem. Phys., 1965, vol. 43, no. 9, p. 3199.
- [32] Markel V.A., Shalaev V.M., Stechel E.V., et al., Phys. Rev. B., 1996, vol. 53, no. 5, p. 2425; Shalaev V.M., Poliakov E.Y., and Markel V.A., Phys. Rev. B, 1996, vol. 53. no. 5, p. 2437.
- [33] Shalaev V.M., Phys. Rep., 1996, vol. 272, p. 61.
- [34] Karpov S.V., Popov A.K., Rautian S.G., et al., JETP Lett., 1988, vol. 47, p. 243.
- [35] Halperin W.P., Rev. Mod. Phys., 1986, vol. 58, no. 3, p. 533.
- [36] Nagaev E.L., Usp. Fiz. Nauk, 1992, vol. 162, no. 9, p. 49.
- [37] Karpov S.V., Bas’ko A.L., Koshelev S.V., et al., Colloid J., 1997, vol. 59, no. 6, p. 765.
- [38] Karpov S.V., Popov A.K., and Slabko V.V., Pis’ma Zh. Eksp. Teor. Fiz., 1997, vol. 66, no. 2, p. 97 [JETP Lett., 1997, vol. 66, no. 2. p.106].
- [39] Butenko A.V., Danilova Yu.E., Karpov S.V., et al., Z. Phys. D, 1990, vol. 17, p.283.
- [40] Safonov V.P., Shalaev V.M., Markel V.A., Danilova Yu.E., Lepeshkin N.N., Kim W., and Armstrong R.L., Phys. Rev. Lett., 1998, vol. 80, no. 5, p. 1102.
- [41] Karpov S.V., Popov A.K., and Slabko V.V., Izv. RAN (physics), 1996, vol. 60, p. 43.
- [42] Danilova Ye.E. and Safonov V.P., Fractal Review in the Natural and Applied Sciences: Proceedings of the Third IFIP Working Conference on Fractals in the Natural and Applied Sciences, Marseille, 1995, Chapman and Hall, London, 1995, p. 102; Safonov V.P. and Danilova Yu.E. in Spectral Line Shapes: 12th International Conference on Spectral Line Shapes, Toronto, AIP Conf. Proc., 1994, vol. 8, p. 363.
- [43] Creighton J.A., Blatchford C.G., and Albrecht M.G., Trans. Faraday Soc., 1979, vol. 75, p. 790.
- [44] Marton J.P. and Jordan B.D., Phys. Rev. B, 1977, vol. 15, no. 4. p. 1719.
- [45] Barykinskii G.M. and Tuzikov F.V., Serebro v meditsine, biologii i tekhnike (Silver in Medicine, Biology, and Technology), Novosibirsk: Inst. Klinicheskoi Immunologii, Sib. Otd., Ross. Akad. Med. Nauk, 1996, vol. 5, p. 136.
- [46] Gorchakov V.I. and Nagaev E.L., Dokl. Akad. Nauk SSSR., 1986, vol. 286, no. 27, p. 339.
- [47] Lidorenko N.S., Chizhik S.P., Gladkikh N.T., et al. Dokl. Akad. Nauk SSSR, 1981, vol. 258, no. 4, p. 858.
- [48] Johnson P.B. and Christy R.W., Phys. Rev. B, 1972, vol. 6, no. 12, p. 4370.