Transition to turbulence in particulate pipe flow
Abstract
We investigate experimentally the influence of suspended particles on the transition to turbulence. The particles are monodisperse and neutrally-buoyant with the liquid. The role of the particles on the transition depends both upon the pipe to particle diameter ratios and the concentration. For large pipe-to-particle diameter ratios the transition is delayed while it is lowered for small ratios. A scaling is proposed to collapse the departure from the critical Reynolds number for pure fluid as a function of concentration into a single master curve.
pacs:
47.20.-k, 83.80.Hj, 83.50.HaMore than a century after Reynolds’ work Reynolds , understanding how turbulent regions grow in a pipe and bring the laminar Poiseuille flow to fully developed turbulence is still not completely achieved. Above a critical Reynolds number, the laminar flow is observed to be unstable, turbulent regions grow and are convected in the pipe. This flow regime is called intermittent. When the flow rate is further increased, the flow becomes fully turbulent Tritton . In fact, the transition happens to be subcritical and the flow is linearly stable for all flow rates Drazin . A finite amplitude perturbation is needed to trigger the transition and the critical Reynolds depends upon its amplitude. For small perturbations, laminar motion is observed as far as but the transition in pure fluid can be reached for provided that the perturbation is strong enough to allow the growth of turbulent “puffs” Tritton . Recent studies have investigated with different kinds of perturbations the nature of the unstable modes, either in the inlet region or in the fully developed flow Eliahou ; Darbyshire .
The objective of the present work is to examine how transition to turbulence is affected by the presence of suspended particles in the simplest case of neutral buoyancy. More specifically, we focus upon determining the transition threshold between the laminar and the intermittent regime as a function of the particle volume fraction of the suspension. Because the particles are neutrally buoyant and largely drag-free, the present study is related to recent work which has examined global subcritical stability behavior of plane Couette flow forced by the presence of a single spherical bead or a spanwise wire Bottin ; Bottin2 . This work also has a practical aspect as it is related to pipeline flow of slurries.
Experiments are performed with four sets of spherical polystyrene particles having density g.cm-3 and diameters presented in table 1. To obtain neutral buoyancy, the densities of the fluid and of the particles are matched. We choose as a fluid a mixture of glycerol and water by mass. The temperature of the mixture is maintained at by using a thermostated bath as a fluid reservoir in the fluid circulating loop. At this temperature, the viscosity of the mixture is cP.
| (m) | ||||
|---|---|---|---|---|
The experimental set-up consists of a straight and horizontal cylindrical glass tube of m length mounted on a rigid support structure. Two different tubes having different inner diameters mm and mm are used in the experiments. These tubes are longer than the entry lengths necessary for the laminar flow to fully develop at , m and m. The pipe to particle diameter ratios, , used in the experiments by combining the different particles and tubes are indicated in table 1. In order to ensure that the flow in the pipe is undisturbed by perturbations from a pump, the flow is driven by gravity. The suspension is delivered to the tube by overflow from a tank positioned at a fixed height to an outlet of variable height, passing through the glass tube. A Moineau progressing cavity pump (PCM model MR2.6H24) carries the suspension back to the overflowing tank, but is isolated from the flow through the glass tube.
With these flow conditions, the transition for pure fluid was found to take place at , but the flow was very sensitive to any kind of perturbation applied to the pipe. In order to control the transition with a known perturbation, a ring (solid annulus) fitting tightly into the tube and of thickness mm was inserted in the pipe at its entrance. The perturbation produced by the ring then controlled the transition and lowered it down to , which is the lowest value that could be reached with this kind of perturbation. The influence of the particles on the transition has been studied with this ring.
The different flow regimes, i.e. laminar, intermittent or turbulent, are identified by visualization as well as by measuring the pressure drop between the entrance and the exit of the glass tube.
A classical way to detect the pipe-flow transition for pure fluid is to inject dye and to observe the wavering of the streak as it passes down the pipe Reynolds ; Tritton . In the present experiment with particles, direct visualization of the particle motion in the suspension is a very straightforward way of observing the birth and convection of “turbulent puffs” in the flow. Whereas motion in the laminar regime is characterized by parallel particle trajectories, motion in a turbulent puff presents a strong mixing in the radial direction. When the flow rate is increased, we observe more and more turbulent puffs in the flow, and finally these merge once the turbulent regime is established.
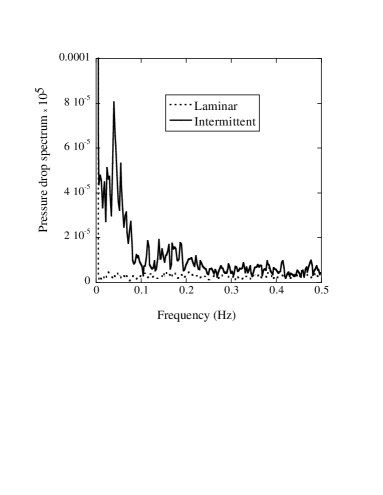
To provide a more quantitative indicator of transition, we also measured the pressure drop between the entrance and the exit of the glass tube with electronic manometers (Newport Omega PX 154). Pressure fluctuations due to the larger pressure drop caused by the turbulent puffs could then be clearly identified with a signal analyzer (Hewlett Packard 3562A). Figure 1 shows pressure drop spectra in the low-frequency range for the laminar flow and at the onset of intermittency, both for a particle volume fraction . The spectrum in the intermittent regime displays strong fluctuations for frequencies under Hz. Using the spectral signature, the onset of intermittency can thus be clearly identified even for large volume fractions where the visualization is not possible. The spectrum of pressure fluctuations in the flow driven by the pump was observed to consist of “continuous noise” of the type shown by figure 1, plus a strong peak at the frequency of the pump rotation with its associated harmonics. By contrast, the fluctuations when the flow is driven by gravity are observed to have only the “continuous noise”. Furthermore, this noise was determined to be unchanged when the pump was off and the overflow tank was filled manually. Consequently, the spectrum observed in the gravity-driven flow is considered to be independent of the pump.
When the threshold of intermittency was reached, we measured the critical flow rate and deduced the critical Reynolds number with the pipe diameter as the length scale. To measure , we collected a given volume of the suspension without altering the flow, by capturing fluid at the outlet to the thermostatically controlled reservoir. The time needed to obtain this volume yielded . The particles collected in this volume were then sieved, rinsed, dried, and weighed to provide the mean particle volume fraction in the suspension flow. Measurements of the critical Reynolds number associated with the start of intermittency have been carried out for different combinations of particles and tubes presented in table 1 and for different concentrations ranging from to .
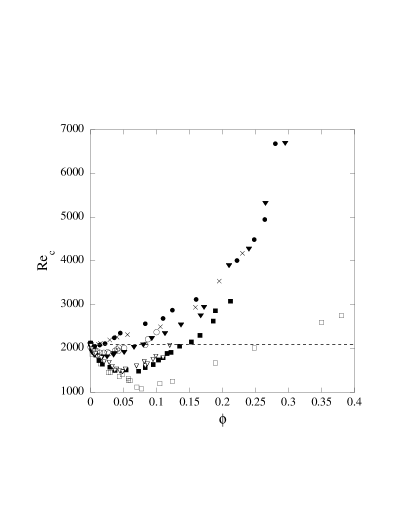
Figure 2 displays the critical Reynolds number as a function of the particle volume fraction for the different combinations of particles and tubes. The results indicate two different situations:
-
(i)
For particles with ( and ), the transition is shifted to larger Reynolds numbers. The critical Reynolds number is a monotonically increasing function of . Furthermore, the data for the two sizes collapse onto a single curve, so that at a given in that range of , the transition threshold does not depend on the diameters of the particles and of the tube.
-
(ii)
For particles with , the behavior depends on . For small , the transition is moved to lower Reynolds number and decreases with increasing . The magnitude of the decrease and in particular the minimum reached as is increased depends on the diameters of the particles and the tube. In particular, for the 780 m particles in pipe for which (), intermittency is observed at for . This is the smallest found in this work. For larger , increases with increasing and the transition is eventually delayed. It is worth noticing that the data for combinations of particles and tube having roughly the same collapse onto the same curve ( and for and and for ).
The behavior for seems simpler since it is independent of the diameters of the particles and of the tube. The observed delay to the transition is expected to be due to an enhancement of the viscosity caused by the suspended particles. Common models for the effective viscosity of a suspension do not depend on the size of the particles and give an increase of the viscosity with increasing average concentration . A well-known example is Krieger’s viscosity Krieger ; Phillips , which expresses the effective viscosity as a function of according to the law:
| (1) |
where is the viscosity of the pure fluid and the random close packing (i.e. maximum) concentration for spherical particles. This empirical formula initially determined at low Reynolds number is commonly used at finite Reynolds.
The critical Reynolds number of the suspension using equation (1), , is plotted as a function of in figure 3. We observe that for ( and ) is approximately independent of and remains close to the value for the pure fluid, . For , we observe a steep increase in this threshold ( and also ), suggesting the presence of an additional mechanism for dissipation beyond the viscosity enhancement observed in Stokes flow suspensions. However, we have only a limited range of concentration data, because the large flow rates required to achieve transition at the elevated effective viscosity result in a large pressure drop. The large pressure exceeds the range of the pressure gauges and also necessitates the direct use of the pump instead of gravity-driven flow that we have chosen to consider only in this study.
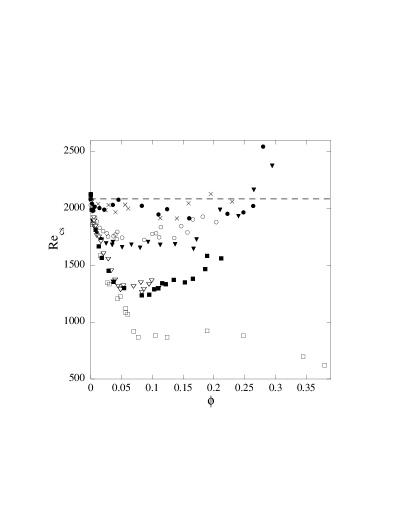
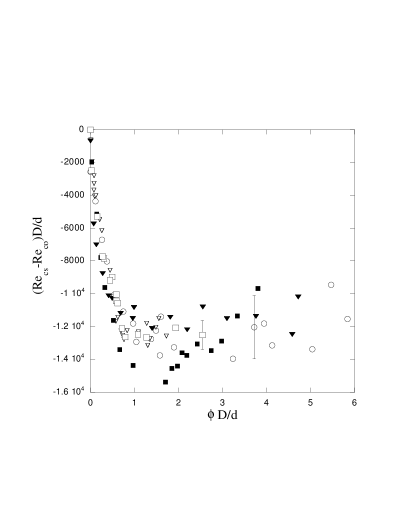
This simple scaling with Krieger’s viscosity is not sufficient to obtain a collapse of the curves for (see figure 3 for , , , , ). However, we can notice a similarity between these curves. At low , there is a first regime where decreases steeply with increasing and the different curves appear to collapse. It should be mentioned that a very small decrease is also observed for the 215 m particles in pipe () but it can be considered to be within error bars. Above a critical volume fraction which depends on the pipe to particle diameter ratio , there is a second regime where the curves eventually reach minimum values of and remain approximately independent of for larger volume fractions. These minimum values of decrease with increasing . Moreover, the data for combinations of particles and tube having similar values of seem to collapse onto the same curve. These last observations lead us to scale the difference between the critical Reynolds number of the suspension and that of the pure fluid as well as with as displayed in figure 4. This new scaling provides a collapse of the different curves for all . The scaled difference initially decreases rapidly and approximately linearly with , then saturates and eventually increases slightly at larger . The results on figure 4 suggest .
These data were obtained with the ring at the entrance of the pipe but similar results were also observed without it. This suggests that the subcritical transition is triggered by the particles. A particle introduces fluctuational velocities whose form and coupling to the mean flow vary with the particle Reynolds number . Unlike the case of uniform flow, the influence of on the structure of the dual wakes caused by shear flow around suspended bodies is, while under study Zettner ; Bottin , not well understood. It is plausible that the influence of particle size in reducing at a fixed results from the increase in the particle scale Reynolds number with . With increasing , the disturbance flow caused by the particle is presumably less efficiently dissipated by viscous action, thus allowing for stronger coupling to the bulk flow.
A more refined analysis should take into account the influence of particles on the velocity and concentration profile in the pipe flow. In conditions of very low Reynolds number and high concentration, particles migrate towards the center of the pipe and blunt the velocity profile, see for instance Hampton . This effect which would tend to reduce the effective viscosity in the pipe is suspected to be present for the 780 m particles in pipe for (see in figure 3). There exists a second type of migration, the so-called “tubular pinch effect”, which is inertial and causes a single particle to move to a position at a distance of from the axis Segre ; Han . This effect is observed with the larger particles in both pipes. The present study seems to suggest that the particles alter the threshold of the subcritical transition through coupling of the base flow to velocity fluctuations rather than the base flow itself through their migration but this requires confirmation.
This work leads to definite conclusions regarding the influence of suspended neutrally-buoyant solids upon the transition away from laminar flow. The influence depends both upon the pipe to particle diameter ratios and concentration. For , neutrally-buoyant particles cause a delay in transition to larger . This effect can be explained by the enhancement of the effective viscosity of the suspension. However, for , the delay in transition is found to be substantially larger than can be explained by a simple renormalization by effective viscosities. For , the behavior is quite different and neutrally-buoyant particles alter the transition to turbulence in pipe flow to smaller . Scaling the departure from the critical Reynolds number for pure fluid as well as the concentration with gives a master curve for the transition for all . The most plausible explanation for the reduction of the critical Reynolds number, though one still in need of confirmation, is that the fluctuations induced by the particles trigger the subcritical transition.
Acknowledgements.
We wish to thank P. Manneville for discussions and F. Ratouchniak for technical assistance. The donation of the 40m particles secured by Derin Adebekun of Kodak is greatly appreciated. We would like also to acknowledge support for this work from the Institut Français du Pétrole. This study was also undertaken under the auspices of a CNRS-NSF collaborative research “Flow, resuspension, and sedimentation of a suspension in a tube”. Fellowship from the French Ministère de la Recherche is gratefully acknowledged by J.-P. Matas.References
- (1) O. Reynolds, Phil. Trans. R. Soc. 174 935 (1883)
- (2) D. J. Tritton, Physical Fluid Dynamics (Oxford Science Publications 1988)
- (3) P. G. Drazin and W. H. Reid, Hydrodynamic stability (Cambridge University Press 1981)
- (4) A. G. Darbyshire, T. Mullin, J. Fluid Mech. 289 83 (1995)
- (5) S. Eliahou, A. Tumin and I. Wygnanski, J. Fluid Mech. 361 333 (1998)
- (6) S. Bottin, O. Danchot and F. Daviaud, Phys. Rev. Lett. 79 4377 (1997)
- (7) S. Bottin, O. Dauchot, F. Daviaud and P. Manneville, Phys. Fluids 10 2597 (1998)
- (8) I. M. Krieger, Adv. Colloid Interface Sci. 3 111 (1972).
- (9) R. J. Phillips, R. C. Armstrong, R. A. Brown, A. L. Graham and J. R. Abbott, Phys. Fluids A 4 31 (1992)
- (10) R. E. Hampton, A. A. Mammoli, A. L. Graham, N. Tetlow and S. A. Altobelli, J. Rheol. 41 621-640 (1997)
- (11) P. R. Nott and J. F. Brady, J. Fluid Mech. 275 157 (1994)
- (12) G. Segré and A. Silberberg, J. Fluid Mech. 14 136 (1962)
- (13) M. Han, C. Kim, M. Kim and S. Lee, J. Rheol. 43 (5) 1157 (1999)
- (14) C. M. Zettner and M. Yoda, Exp. Fluids 30 346 (2001)