22institutetext: Osservatorio Astronomico di Brera - via Brera, 28 I-20121 Milan - Italy
33institutetext: Ufficio Centrale di Ecologia Agraria - via del Caravita, 7A, I-00186 Roma - Italy
44institutetext: Istituto di Fisica Generale Applicata - via Brera, 28, I-20121 Milano - Italy
Temperature, precipitation and extreme events during the last century in Italy
Abstract
The paper summarises activities within a broad-based research program for the reconstruction of the evolution of Italian climate in the twentieth century. The main result of the program is that Italian climate is becoming warmer and drier with an increase of both heavy precipitation events and long dry spells. Most of the observed signals appear to be due to changes in atmospheric circulation causing an increase in the frequency of subtropical anticyclones over the western Mediterranean basin. This hypothesis is also supported by the evolution of Italian total cloud amount in the 1951-1996 period.
keywords:
Italy, Climatic Secular Series, Temperature, Precipitation, Extreme Precipitation, Droughts1 Introduction
Around the mid 1990s, the authors set up a broad-based research program with the aim of better understanding the evolution of Italian climate in the last 100/150 years. The program was developed both within European (UE IMPROVE and ALPCLIM projects) and National projects (National Research Council (CNR) project ”Reconstruction of the Past Climate in the Mediterranean area”). At present it is in progress within the ”Progetto Finalizzato CLIMAGRI”, a project of the Italian ”Ministero per le Politiche Agricole e Forestali”. Moreover, in the next two years, further activities will be performed within the research program ”Local climate variability in relation to global climatic change phenomena” funded by the Italian ”Ministero per l’Istruzione, l’Universit e la Ricerca” and by Genoa, Milan, Trieste, Turin and Udine Universities. The studies so far carried out have improved the availability and the quality of Italian data and have produced interesting information on the evolution of temperature, precipitation and some other parameters in the last 100/150 years. The paper summarises the main results obtained within the research program.
2 Data and methods
In Italy there are several historical series, but only a few of them are digitalized and available for climatological studies, while most are still on paper archives. With the exception of some well known series (e.g. Milan, Padua and Rome), the construction of the most important database, so far available, of long historical series of Italian meteorological data started in the 70s in the framework of a CNR Project. In the second part of the 90s this database was updated and improved in the framework of the CNR Special Project ”Ricostruzione del clima dell’area mediterranea nel passato”. The series included in the database are listed in table 1, and their geographical distribution is shown in figure 1. All series include monthly mean values of daily maximum (Tmax), mean (T) and minimum (Tmin) temperatures and monthly total precipitation (P), part of them include daily observations too.
![[Uncaptioned image]](/html/physics/0211070/assets/x1.png)
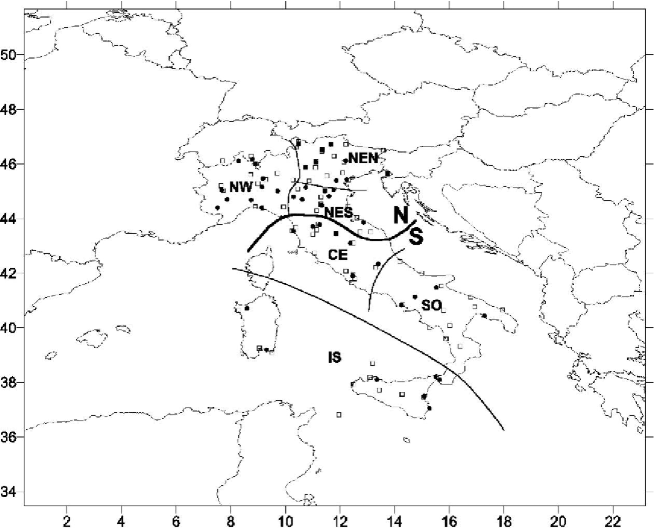
Monthly series were divided in two groups corresponding to two climatically homogeneous areas - Northern Italy (N) and Central-Southern Italy (S) - that are, respectively, the continental and the peninsular zones of Italy (Lo Vecchio and Nanni,, 1995; Buffoni et al.,, 1999). After establishing the new database, the Craddock homogeneity test (Craddock,, 1979) was applied to the Tmin, T, Tmax and P series, using regional means as reference series (Maugeri and Nanni,, 1998; Buffoni et al.,, 1999). Some series were then homogenized (Auer,, 1992; Böhm,, 1992) both on the basis of the test results and the stations’ history (metadata). After homogenization, the temperature (precipitation) series were completed over the period 1865-1996 (1833-1996) by means of a procedure described in Maugeri and Nanni, (1998) and in Buffoni et al., (1999). With the completed data, monthly mean values of the Daily Temperature Range (DTR) were calculated from Tmin and Tmax series. Following the procedure described in Maugeri and Nanni, (1998); Buffoni et al., (1999); Brunetti et al., 2000a ; Brunetti et al., 2000b the T, Tmin, Tmax, DTR and P series were then averaged over N and S and seasonal and yearly anomalies and their 5-y running means were calculated. Seasonal and yearly N and S average anomalies were analysed with the Mann-Kendall non-parametric test, as described in Sneyers, (1990), to look for a trend. The slopes of the trends were calculated by least square linear fitting. The Mann-Kendall test was also used for a progressive analysis of the series Sneyers, (1990). The correlation between seasonal and yearly DTR and seasonal and yearly precipitation and mean temperature was also performed. Some secular precipitation series were available with daily resolution too. For these series the proportion of daily precipitation falling in 5 precipitation class intervals was calculated for each year and each season. The resulting series were then analysed for trends, giving particular emphasis to heavy and extreme events Brunetti et al., 2000c . The database resulting from the CNR Special Project ”Ricostruzione del clima dell’area mediterranea nel passato” should be extended to include more series and further metadata. This extension is currently underway in the framework of the ”Progetto Finalizzato CLIMAGRI”. Other extensions will be performed within the national research program ”Local climate variability in relation to global climatic change phenomena”. Concerning precipitation, another database, covering a shorter period (1951-2000), but having a higher spatial resolution, was considered; most of the series were extracted from the Italian Air Force (AM) data set, and some others come from the Ufficio Centrale di Ecologia Agraria (UCEA), from the Ufficio Idrografico (UI) and from some research projects dealing with the recovery of single series. These series were homogenized, completed, validated and grouped firstly into two areas (N and S), then in six more restricted areas by principal component analysis Brunetti et al., (2001); the mean regional series and their anomalies were calculated for each area. The distribution and the grouping of these stations are shown in figure 1. The completion of the series and the regional means were performed by already known methods (Karl et al.,, 1995, 1998; Brunetti et al.,, 2001) and by a new method discussed in Brunetti et al., (2002). This new method allows to obtain regional series suitable for the calculation of statistics (e.g. drought lengths and frequencies) that can not be obtained using station records completed by methods based on random generated data. For the 1951-2000 period, also monthly cloud cover series, extracted from the Italian Air Force (AM) data set, were validated, homogenized and analysed for trends.
3 Results
3.1 Monthly series trends
As far as mean temperature is concerned, on a yearly basis there is a positive trend with a 0.99 significance level (sl) both for N and S; on a seasonal basis, considering a 0.99 sl, T has a positive trend in all four seasons in S, while in N it has a positive trend in autumn, winter and, using a 0.95 sl, in spring. The T trends in the annual temperature series, calculated by least squares linear fitting, range from 0.4 C/100y for N to 0.7 C/100y for S. For the winter season the slopes are greater, ranging from 0.7 C/100y (N) to 0.9 C/100y (S), while for the summer season they are lower and in some cases not significant. Even if the data set has been checked for homogeneity and some series have been homogenised, trend estimates seem to be critically influenced by data homogeneity. The main problem is that data homogenisation performed on a national basis hardly allows inhomogeneities due to changes in national standards to be detected, as they concern most of the series in a rather short period. The question is still open, as more metadata have to be recovered before giving a conclusive answer. The information available at present suggests that the principal inhomogeneities seem to concern the end of the nineteenth century when in many observatories the meteorological screens were moved from north facing windows to more open positions and the end of World War II. As discussed in Böhm et al., (2001) the effects of these inhomogeneities seem to cause an underestimation of temperature trends. The progressive application of the Mann-Kendall test allows a more detailed analysis of the temperature series trends. A complete discussion of this analysis is reported in Maugeri and Nanni, (1998); the synthesis of the results is that both for N and S the positive temperature trend seems to start around 1920. After 1920 the temperature rises rapidly till 1950, then it is more or less constant from 1950 to 1985, with only a slight drop in the period 1970-1980. After 1985 it begins to rise again in all seasons. Concerning DTR, the results of the analysis are discussed in detail in Brunetti et al., 2000b . The results of the Mann-Kendall test indicate that DTR has a positive trend (sl 95%) with the only exception of winter in N (negative) and of spring and summer in S (not significant). The increase in the annual DTR in the period 1865-1996 is weak but significant (0.22 C for N and 0.12 C for S) due to the stronger increase of Tmax compared to Tmin. The comparison of these results with the literature shows that the Italian situation is anomalous, because generally the DTR is characterised by a negative trend (Karl et al.,, 1993; Easterling et al.,, 1997). A detailed comparison of the results for the period 1865-1996 is however hampered by the lack of literature data. A more detailed analysis of the DTR series can be obtained with the progressive application of the Mann Kendall test. The results indicate that in the last decades of the 19th century the DTR trend was generally negative. After the initial decrease, in all the seasons (except winter) the DTR trend begins to increase from a date included in the period 1920-1940 for N and in the period 1900-1920 for S. Then it continues to increase till around 1970 in N and around 1950 in S. In the last decades the trends are generally constant in N, whereas in S they are constant in autumn and decreasing in spring and in summer. In winter there is a tendency towards a negative trend in N and a positive one in S. As far as precipitation is concerned, the series cover a longer period than for temperature. However, in order to allow a better comparison, hereinafter the trend results are presented only for the common period. On a yearly basis a negative trend (sl 0.99) is evident both for N and S; on a seasonal basis, there is a negative trend in spring, summer and autumn, whereas in winter the trend is not significant (S); or it is positive (N). The slopes of the P yearly series, calculated by least squares linear fitting, range between -104 mm/100 y for S and -47 mm/100 y for N, giving estimated decreases in the period 1866-1995 of 135 and 61 mm. These values correspond, respectively, to 18% and 7% of S and N yearly mean values. Both for N and S, spring and autumn have the steepest trends.
![[Uncaptioned image]](/html/physics/0211070/assets/x3.png)
In the same way as temperature series, also precipitation series were studied by means of the progressive application of the Mann-Kendall test. A complete discussion of this analysis is reported in Buffoni et al., (1999); the most interesting result regards P in S whose high significant negative trend seems to be mainly caused by a strong precipitation decrease in the last 50 years. All the trend results are summarized in table 2.
3.2 Relationships among monthly T, P and DTR
The comparison of the behaviour of T, P and DTR for the period 1865-1996 (figure 2) has been deeply analysed by Brunetti et al., 2000b .
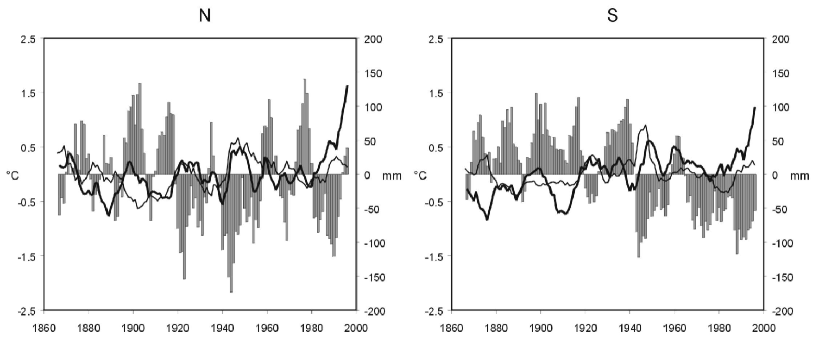
The correlation between yearly and seasonal DTR and P is always negative and highly significant ( 99%) whereas the correlation between DTR and T is positive (significance 95%) in spring and summer for N and in spring, summer and autumn for S. The negative P - DTR correlation is more significant in N than in S whereas the positive T - DTR correlation is comparable in the two geographical areas. The correlation among T, P and DTR is mainly due to high frequent variability, but the same behaviour that is present for the seasonal and yearly data is evident also on longer time scales. Both the yearly and the secular correlated behaviours are probably caused by the same changes in atmospheric circulation, with warm and dry conditions (high T and DTR, low P) being related to an increase of the frequency of subtropical anticyclones over the western Mediterranean basin. These results are also supported by the evolution of Italian total cloud amount in the 1951-1996 period, which is in very good agreement with the evolution of the other parameters. By analysing the data of 35 stations we observed that there is a highly significant negative trend in yearly and seasonal average cloud amount all over Italy (Maugeri et al.,, 2001) (table 3). The slope is highest in winter.
![[Uncaptioned image]](/html/physics/0211070/assets/x5.png)
3.3 Some results concerning daily precipitation series
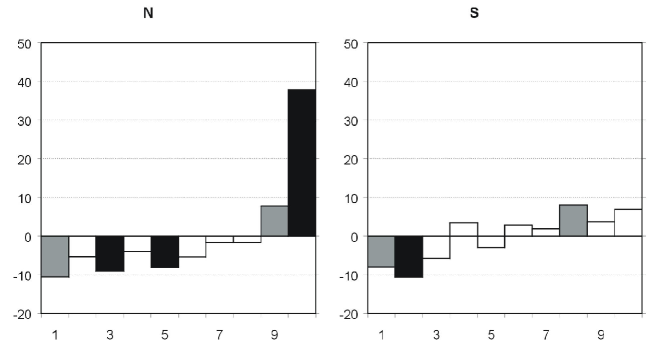
An analysis of 67 sites over 46 years of daily precipitation records for Italy was undertaken by Brunetti et al., (2001) to identify any changes in the characteristics of precipitation that may have occurred. The research concerned seasonal and yearly precipitation, number of wet days (WDs) and precipitation intensity (PI), and consisted of studying the trends both for the station records and for some different area average series. PI was analysed both as amount of precipitation per wet day and by attributing precipitation to 10 class-intervals (Osborn et al.,, 2000) removing the influence of variations in the number of WDs to yield changes in the underlying shape of the WD amount distribution.
![[Uncaptioned image]](/html/physics/0211070/assets/x7.png)
The principal results, summarized in figure 3 and table 4, are as follows:
- i.
-
The number of WDs in the year has a clear and highly significant negative trend all over Italy. It depends mainly on the winter, the season which accounts for about 50% of the N decrease, and about 75% of the S one.
- ii.
-
Besides the reduction in the number of WDs, there is a tendency towards an increase in PI. This increase is globally less strong and significant than the decrease in the number of WDs, and it is not concentrated in one specific season. It is worth noticing that, in winter, the PI trend is positive, but very weak, in N and negative in S.
- iii.
-
In N, the increase in PI is mainly due to a strong increase in precipitation, falling into the highest class-interval, whereas in S, it depends on a larger part of the WD amount distributions. As far as the lower part of the distribution is considered, the situation is more similar, and both for N and S, the negative trend is best shown for the sum of the three lower classes.
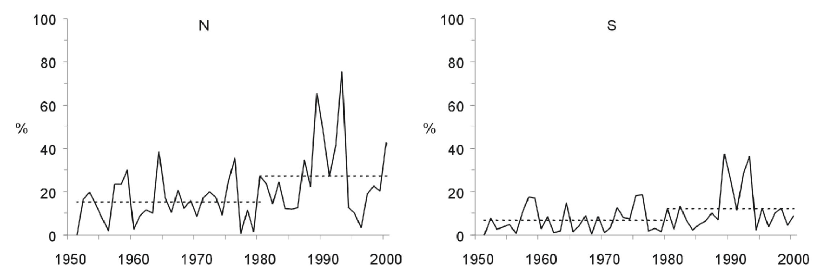
To search for a trend of dry periods in Italy for the last 50 years, Brunetti et al., (2002) proposed a new methods to manage series with missing data without using random generated numbers and analysed the previous data set enlarged to 75 stations and updated to 2000. The stations were clustered as already described for the previous database and complete daily regional average series were obtained from the incomplete station records, and analysed for droughts. Droughts were identified by means of 2 indicators: the longest dry period and the proportion of dry days. The most remarkable result is a systematic increase in winter droughts over all of Italy, especially in the North, mainly due to the very dry 1987-1993 period (figure 4).
The reliability of the regional series was checked by computing some basic statistics concerning total precipitation, rainy days and precipitation intensity and comparing them with the same statistics computed for regional series obtained by station records completed with methods based on random number generators.
4 Conclusions
Globally, our results support the hypothesis we advanced in some previous papers (Brunetti et al., 2000a, ; Brunetti et al., 2000b, ) and confirm that there are strong differences in the response to the recent global warming in Italy and other Central and Northern European areas. In fact, besides some common features (temperature increase, tendency toward an increase in precipitation intensity), there are other data (cloud cover, daily temperature range, number of wet days) that behave conversely. All these differences are probably due to the strengthening in the North Atlantic Oscillation (Hurrell,, 1995, 1996) that has accompanied the recent warming and that has caused an increase and a northerly shift in the westerlies, with consequent advection of warm and moist air over large areas of Central and Northern Europe (Hurrell,, 1995; Jones et al.,, 1997), and more frequent anticyclones over its southern part (Rodwell et al.,, 1999).
Acknowledgements.
The authors would like to thank all the institutions that contributed to the data set. They are: Italian Air Force, UCEA, Servizio Idrografico, Swiss Meteorological Institute and CNR-IATA.References
- Auer, (1992) Auer, I. 1992, Experience with the completion and homogenisation of long term precipitation series in Austria, Central European Research Initiative - Project group Meteorology - working paper 1, ed. I. Auer (Vienna).
- Böhm, (1992) Böhm, R. 1992, Description of the procedure of homogenizing temperature time series in Austria, Central European Research Initiative - Project group Meteorology - working paper 2, ed. R. Böhm, (Vienna).
- Böhm et al., (2001) Böhm, R., Auer, I., Brunetti, M., Maugeri, M., Nanni, T., Sch ner W. 2001, Regional Temperature Variability in the European Alps 1760-1998 from homogenised instrumental time series. Int. J. Climatol., 21, 1779-1801.
- (4) Brunetti, M., Maugeri, M., Nanni, T. 2000a. Variations of temperature and precipitation in Italy from 1866 to 1995. Theor. Appl. Climatol., 65, 165-174.
- (5) Brunetti, M., Buffoni, L., Maugeri, M., Nanni, T. 2000b. Trends of minimum and maximum daily temperatures in Italy from 1865 to 1996. Theor. Appl. Climatol., 66, 49-60.
- (6) Brunetti, M., Buffoni, L., Maugeri, M., Nanni, T. 2000c. Precipitation intensity trends in Northern Italy. Int. J. Climatol., 20, 1017-1031.
- Brunetti et al., (2001) Brunetti, M., Colacino, M., Maugeri, M., Nanni, T. 2001. Trends in the daily intensity of precipitation in Italy from 1951 to 1996: Int. J. Climatol., 21, 299-316.
- Brunetti et al., (2002) Brunetti, M., Maugeri, M., Nanni, T., Navarra A. 2002. Droughts and extreme events in regional daily Italian precipitation series, Int. J. Climatol., 22, 1455-1471.
- Buffoni et al., (1999) Buffoni, L., Maugeri, M., Nanni, T. 1999. Precipitation in Italy from 1833 to 1996. Theor. Appl. Climatol., 63, 33-40.
- Craddock, (1979) Craddock, J. M. 1979. Methods for comparing annual rainfall records for climatic purposes. Weather, 34, 332-346.
- Easterling et al., (1997) Easterling, D.R., Horton, B., Jones, P.D., Peterson, T.C., Karl, T.R., Prker, D.E., Salinger, M.J., Razuvayev, V., Plummer, N., Jamason, P., Folland, C.K, 1997: Maximum and minimum temperature trends for the globe. Science, 277, 364-367.
- Karl et al., (1993) Karl, T.R., Jones, P.D., Knight, R.W., Kukla, G., Plummer, N., Razuvayev, V., Gallo, K.P., Lindseay, J., Charlson R.J., Peterson T.C., 1993: Asymmetric trends of daily maximum and minimum temperature. Bull. Am. Meteorol. Soc., 74, 1007-1023.
- Karl et al., (1995) Karl, T.R., Knight, R.W. and Plummer, N. 1995. Trends in high-frequency climate variability in the twentieth century. Nature. 377: 217-220.
- Karl et al., (1998) Karl, T.R, Knight, R.W., 1998. Secular trends of precipitation amount frequency and intensity in the United States. Bull. Am. Met. Soc.. 79: 231-241.
- Hurrell, (1995) Hurrell, J.W. 1995. Decadal trend in North Atlantic oscillation regional temperatures and precipitation. Science. 269, 676-679.
- Hurrell, (1996) Hurrell, J.W., 1996. Influence of variations in extratropical wintertime teleconnections on northern hemisphere temperature, Geophys. Res. Lett, 23, 665-668.
- Jones et al., (1997) Jones, R.G., Murphy, J.M., Noguer, M., Keen, A.B. 1997. Simulation of climate change over Europe using a nested regional-climate model. II: Comparison of driving and regional model responses to a doubling of carbon dioxide, Q. J. R. Meteorol. Soc., 122, 265-292.
- Lo Vecchio and Nanni, (1995) Lo Vecchio, G., Nanni, T. 1995. The variation of the atmospheric temperature in Italy during the last one hundred years and its relationship with Solar Output. Theor. Appl. Climatol., 51 (3), 159-165.
- Maugeri and Nanni, (1998) Maugeri, M., Nanni, T. 1998. Surface air temperature variations in Italy: recent trends and an update to 1993. Theor. Appl. Climatol., 61, 191-196.
- Maugeri et al., (2001) Maugeri, M., Bagnati, Z., Brunetti, M., Nanni T. 2001. Trends in Italian cloud amount, 1951-1996. Geophys. Res. Let., 28, 4551-4554.
- Osborn et al., (2000) Osborn, T.J., Hulme, M., Jones, P.D. and Basnett, T.A. 2000. Observed trends in the daily intensity of United Kingdom precipitation. Int. J. Climatol.. 20, 347-364.
- Rodwell et al., (1999) Rodwell, M.J., Rowell, D.P., Folland, C.K. 1999. Oceanic forcing of the wintertime north atlantic oscillation and European climate, Nature, 398, 320-323.
- Sneyers, (1990) Sneyers, R. 1990. On the statistical analysis of series of observation. WMO, Technical Note N. 143, Geneve, 192 pp.